Available in: CE, BE, SE, SE+, EE
The module lifecycle stage: General Availability
The module has requirements for installation
The web interface is a single entry point for managing Deckhouse Kubernetes Platform: it simplifies administration and makes the state of the system clear at a glance. The interface is available in all editions, including Community Edition, with no feature limitations.
All users have access to the interface according to their rights in the platform.
Assuming the public domain template is %s.example.com, the web app is available at https://console.example.com.
Strengths
- A single console for the whole platform. Cluster and its updates, modules, nodes, networking, storage, access control, monitoring, logs, and virtualization — in one interface, with no switching between tools.
- Graphical forms with hints and validation for resources that are described as YAML manifests in the CLI. A YAML tab is available on every resource for direct editing.
- Built-in terminal with a session inside the platform operator pods — no separate SSH access.
- Change history with undo and redo of performed actions.
- GitOps-managed resources are marked (werf, Argo CD, Helm) — it is clear that an object is changed by automation and should not be edited manually.
- Access is limited by the user’s platform rights (RBAC): only permitted objects and actions are available in the interface.
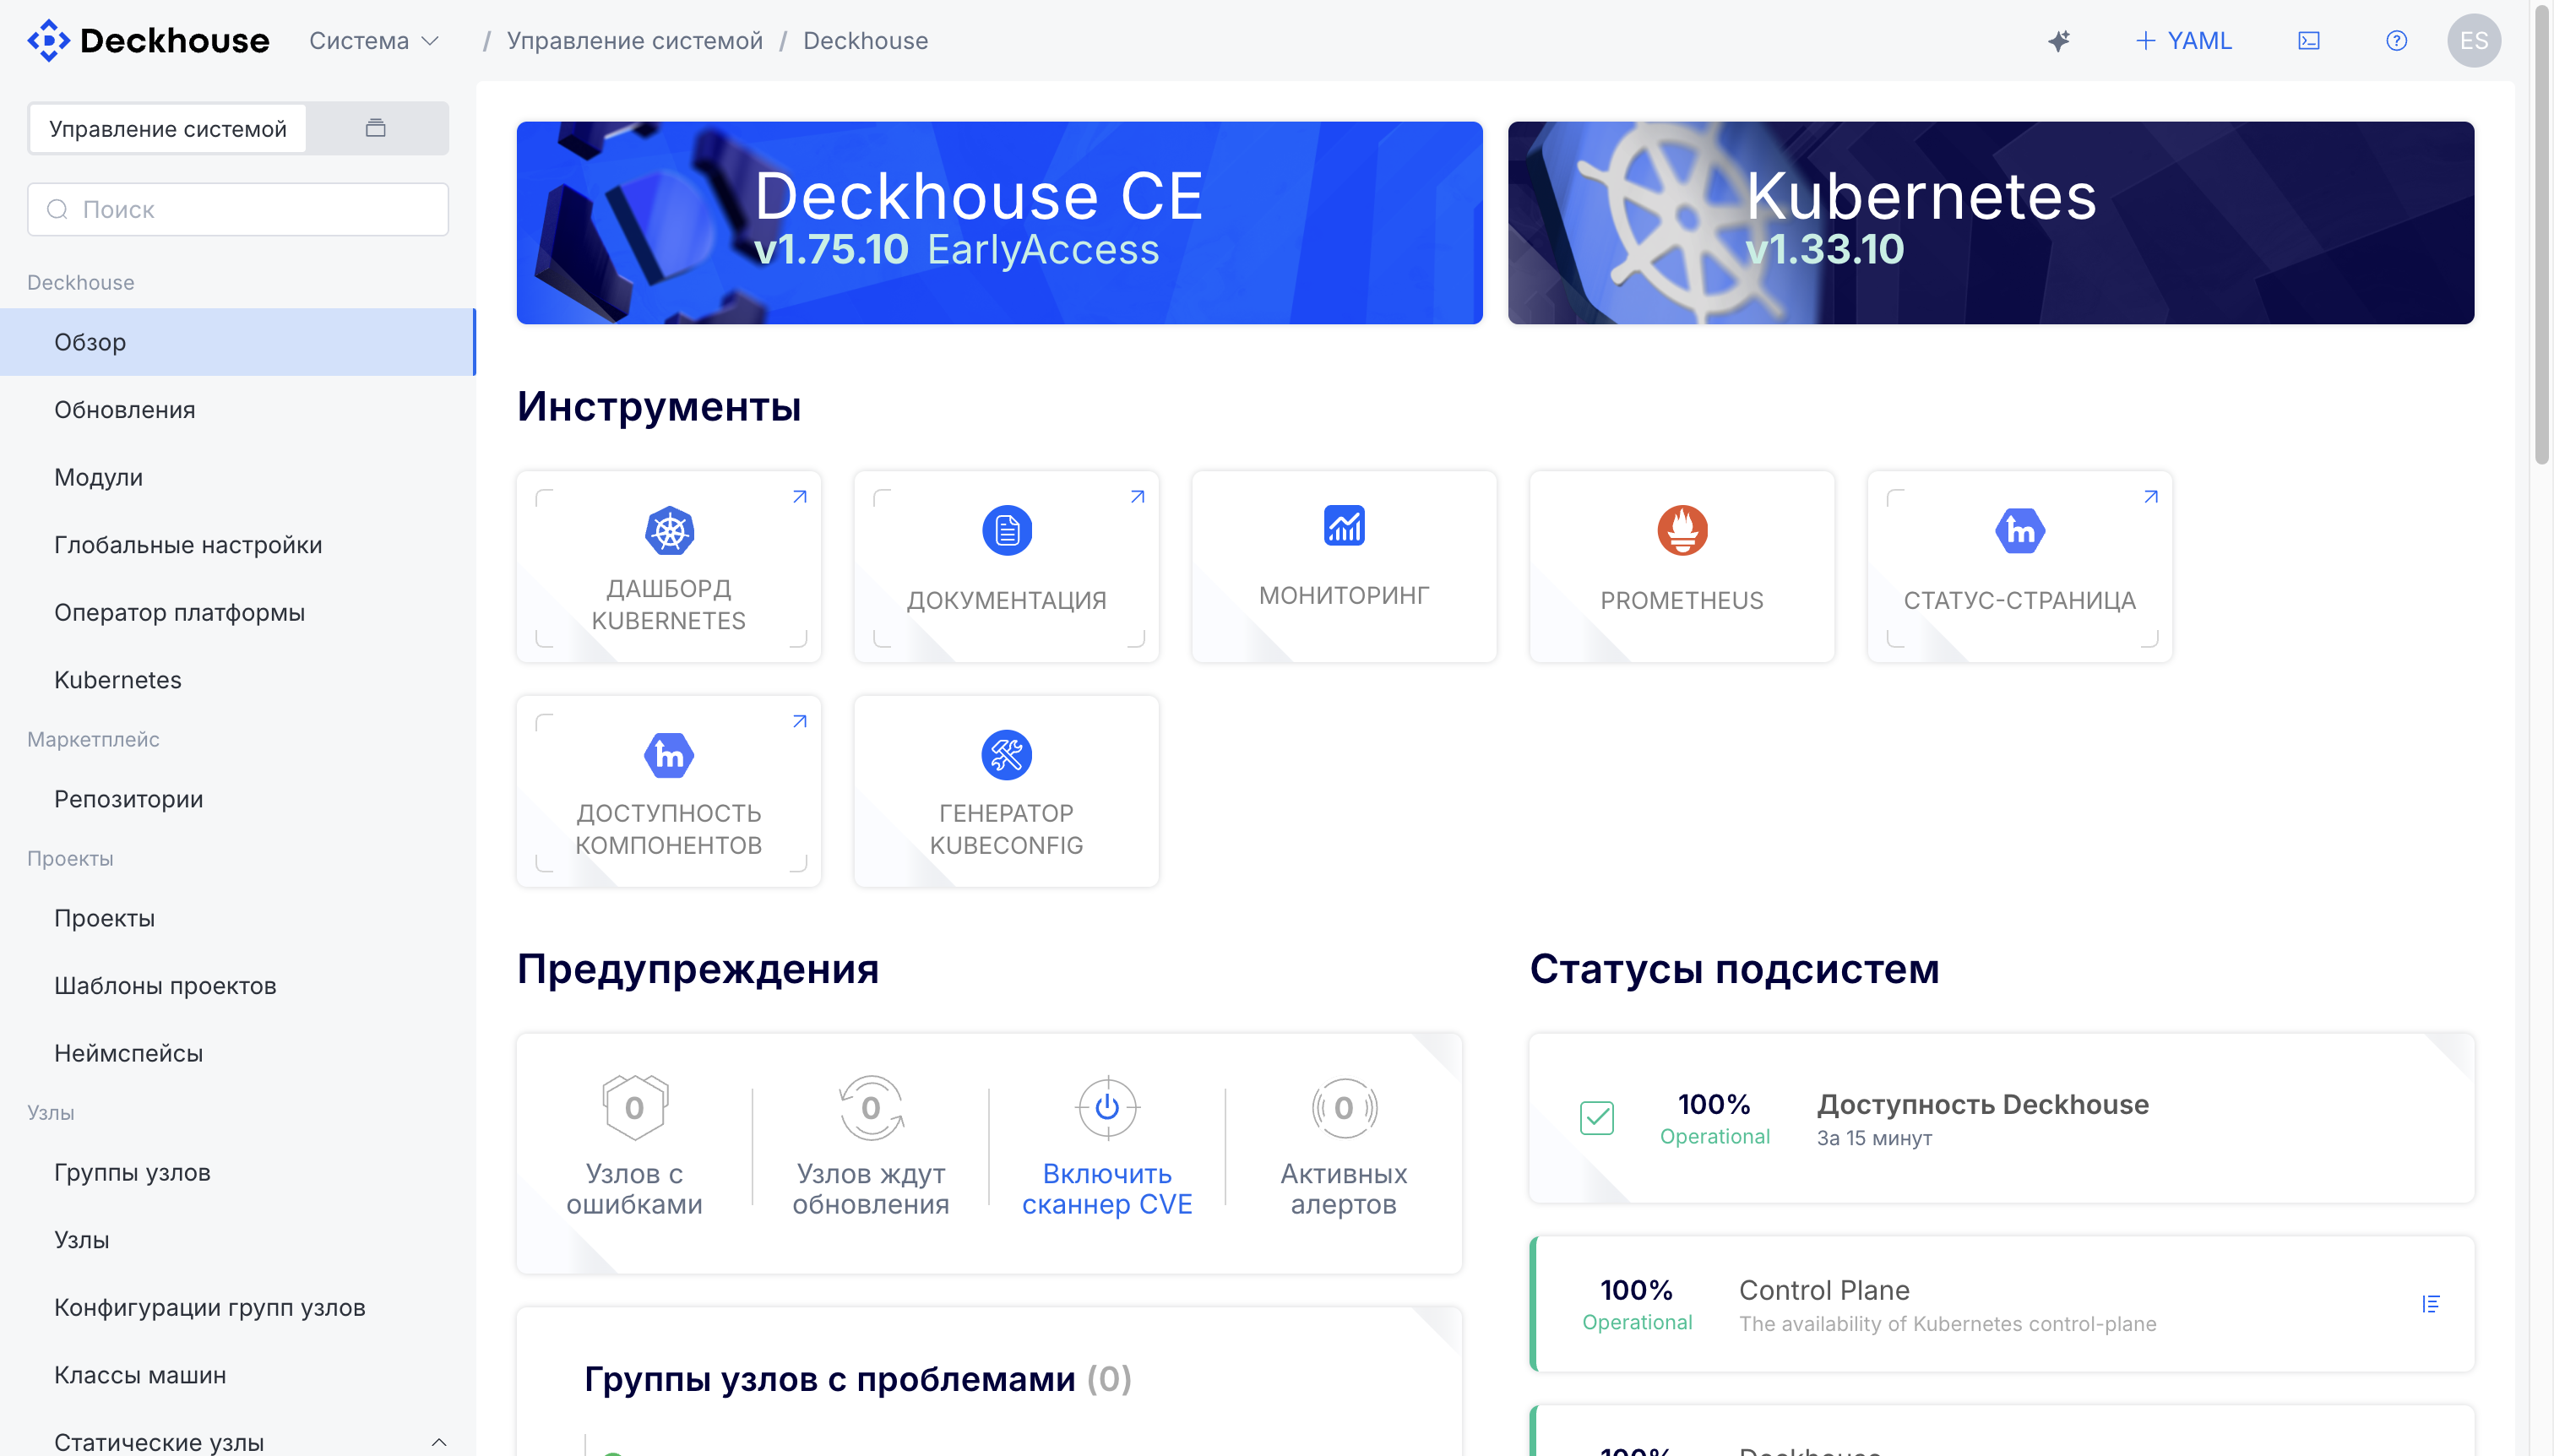
- Cluster state on a single screen: Deckhouse and Kubernetes versions, subsystem statuses, active alerts, nodes with problems, and nodes pending updates.
- One interface for all editions, including Community Edition.
How it helps your team
Lower skill requirements
The graphical interface lets you administer the platform without deep knowledge of Kubernetes and the command line. This widens the circle of employees who can work with the cluster and reduces dependence on a handful of specialists.
Faster routine operations
Routine tasks — deploying virtual machines, adding nodes, checking state — take minutes through web forms instead of hand-writing and debugging configurations.
Shorter onboarding
New team members become productive with the platform in days rather than weeks. Step-by-step flows and clear navigation replace lengthy documentation study.
Transparent platform state
A single interface with dashboards and subsystem statuses gives engineers and managers a shared picture without collecting data from different sources.
Features
The interface is split into two contexts, switched with the selector in the top-left corner:
- System management — administering the platform as a whole: updates, modules, nodes, networking, storage, access control, observability, and cluster security.
- Project — using the platform within a selected project: working with applications and resources (workloads, virtual machines, services, secrets).
Platform administration
Overview
Deckhouse and Kubernetes versions, subsystem statuses, active alerts, and the available tools: the Kubernetes dashboard, documentation, monitoring, Prometheus, the status page, the kubeconfig generator, and the vulnerability (CVE) scanner.
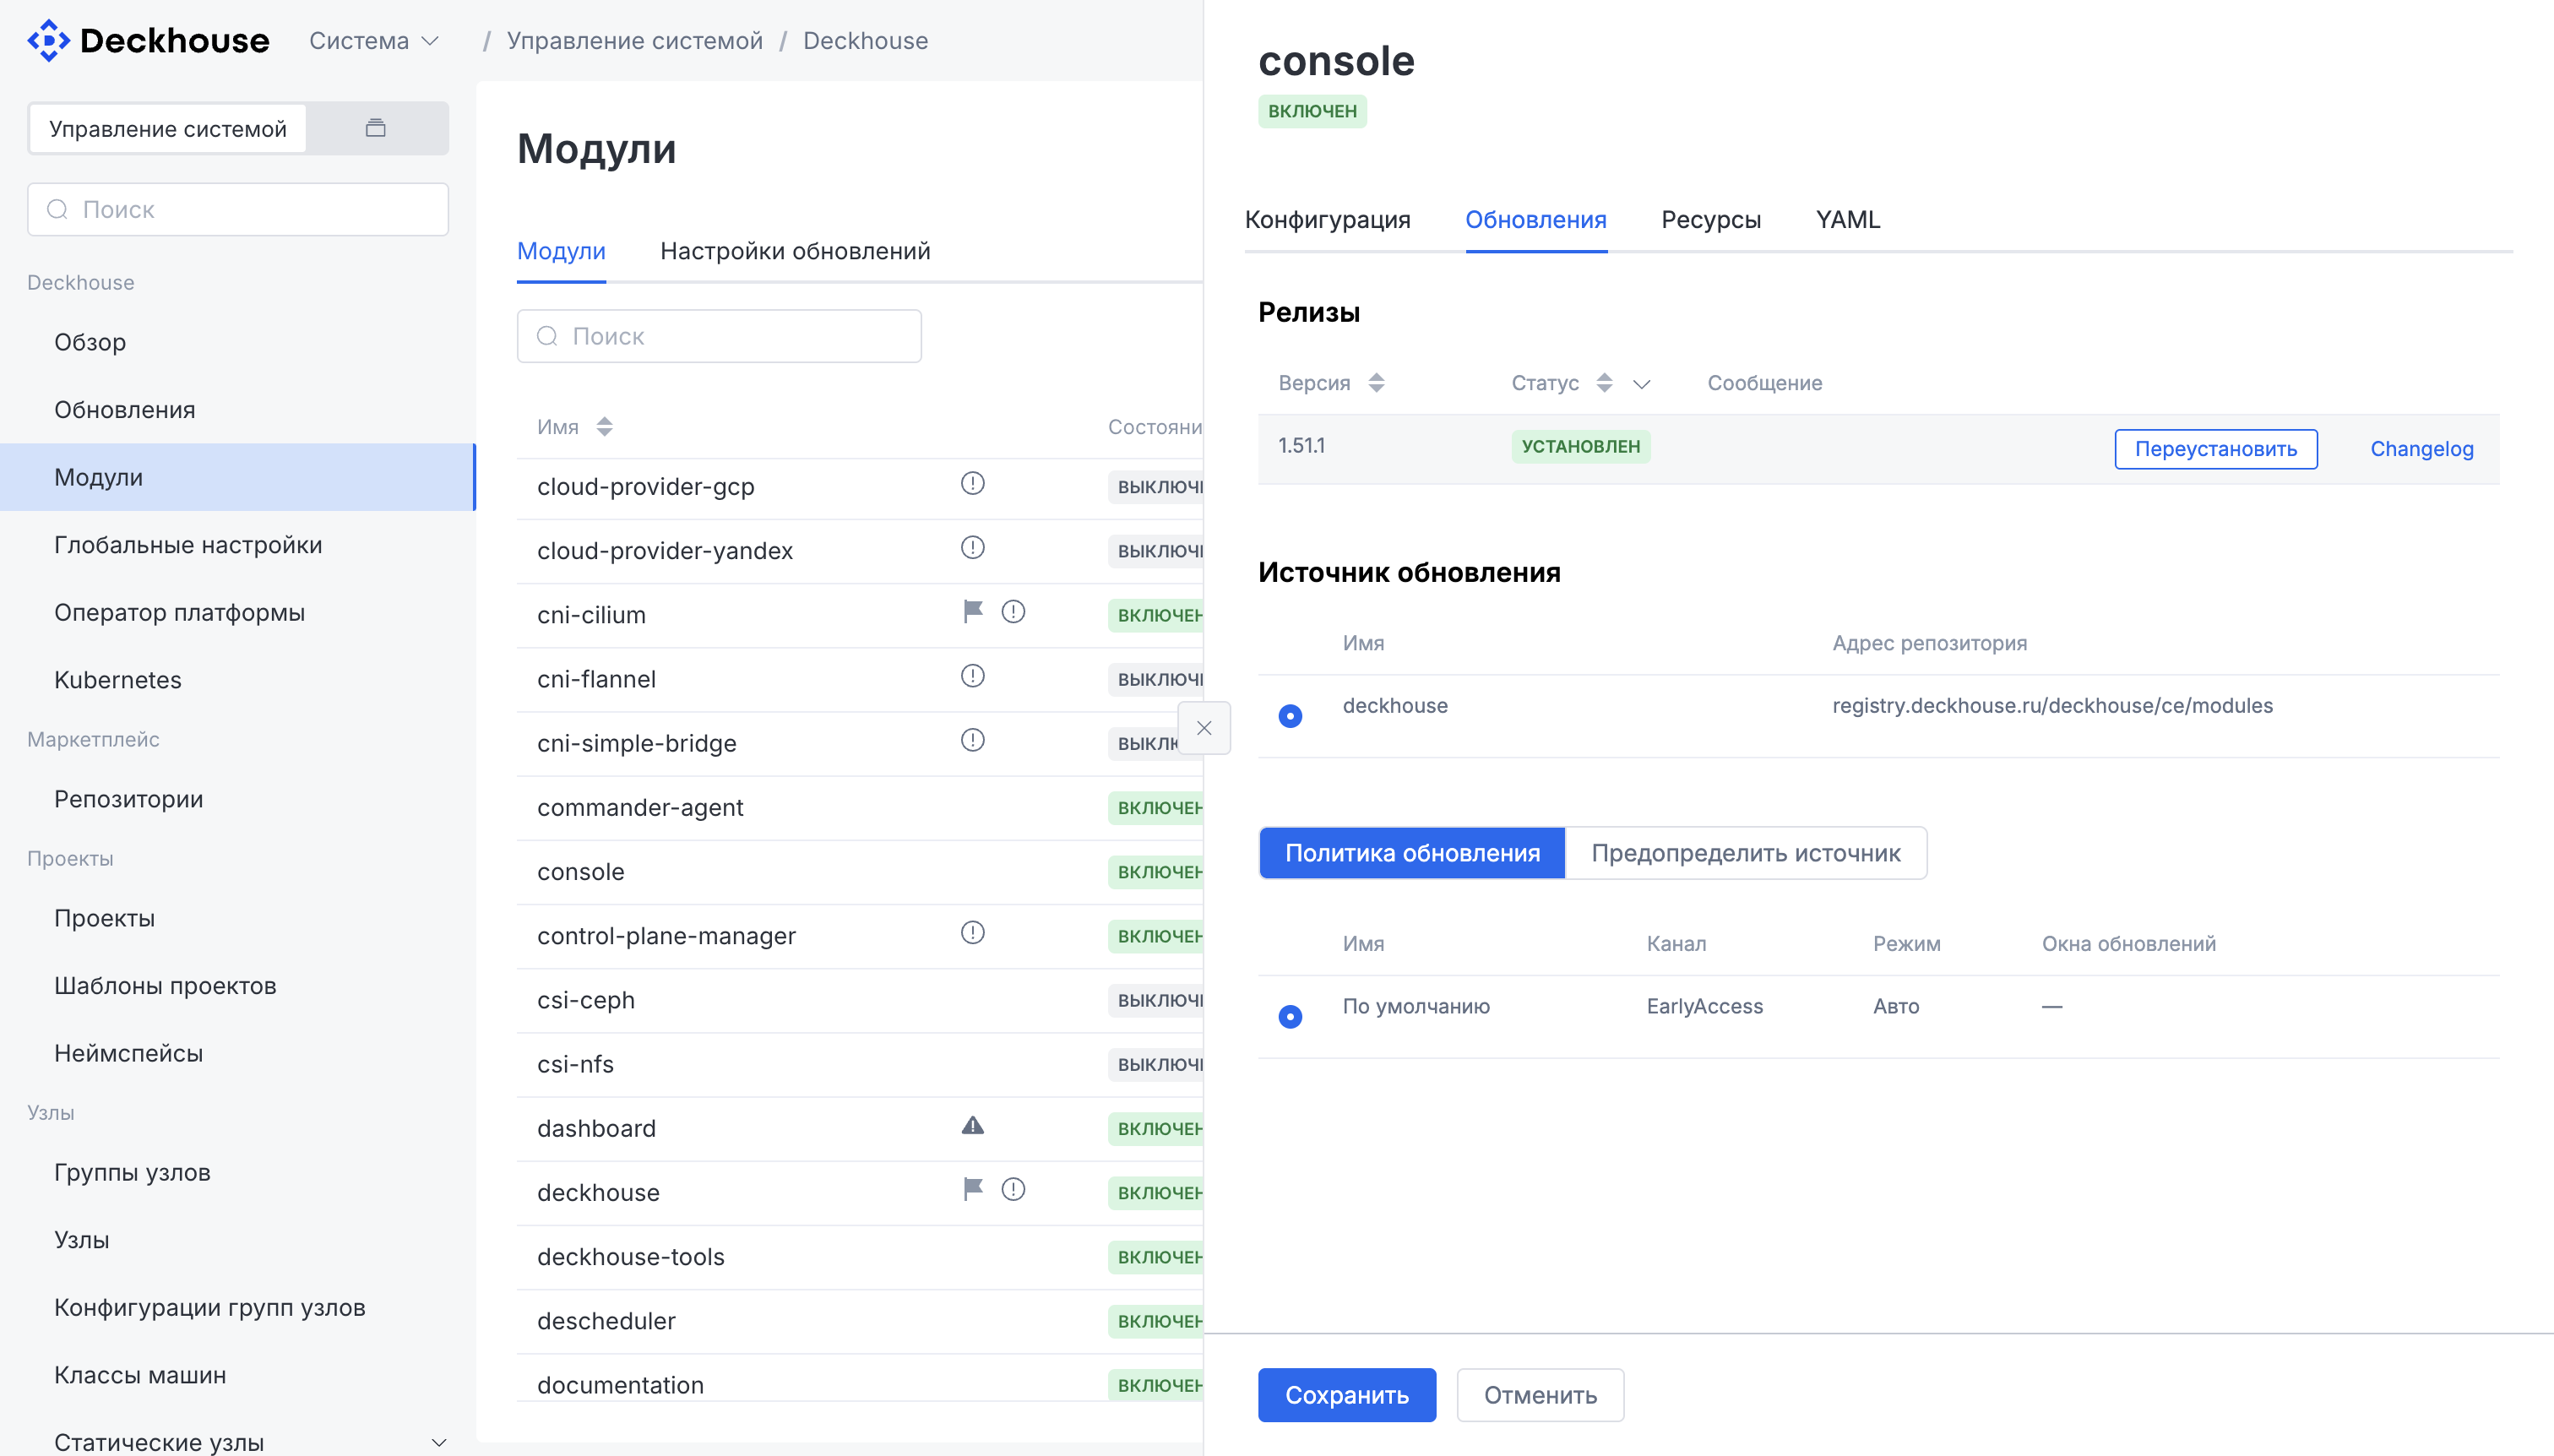
Updates and modules
Platform and Kubernetes version updates with a choice of release channel and update mode; management of modules (settings, sources, update policies, changelog, reinstall) and global module settings. Application marketplace: package repositories, application installation, their resources, and tracking of new versions.
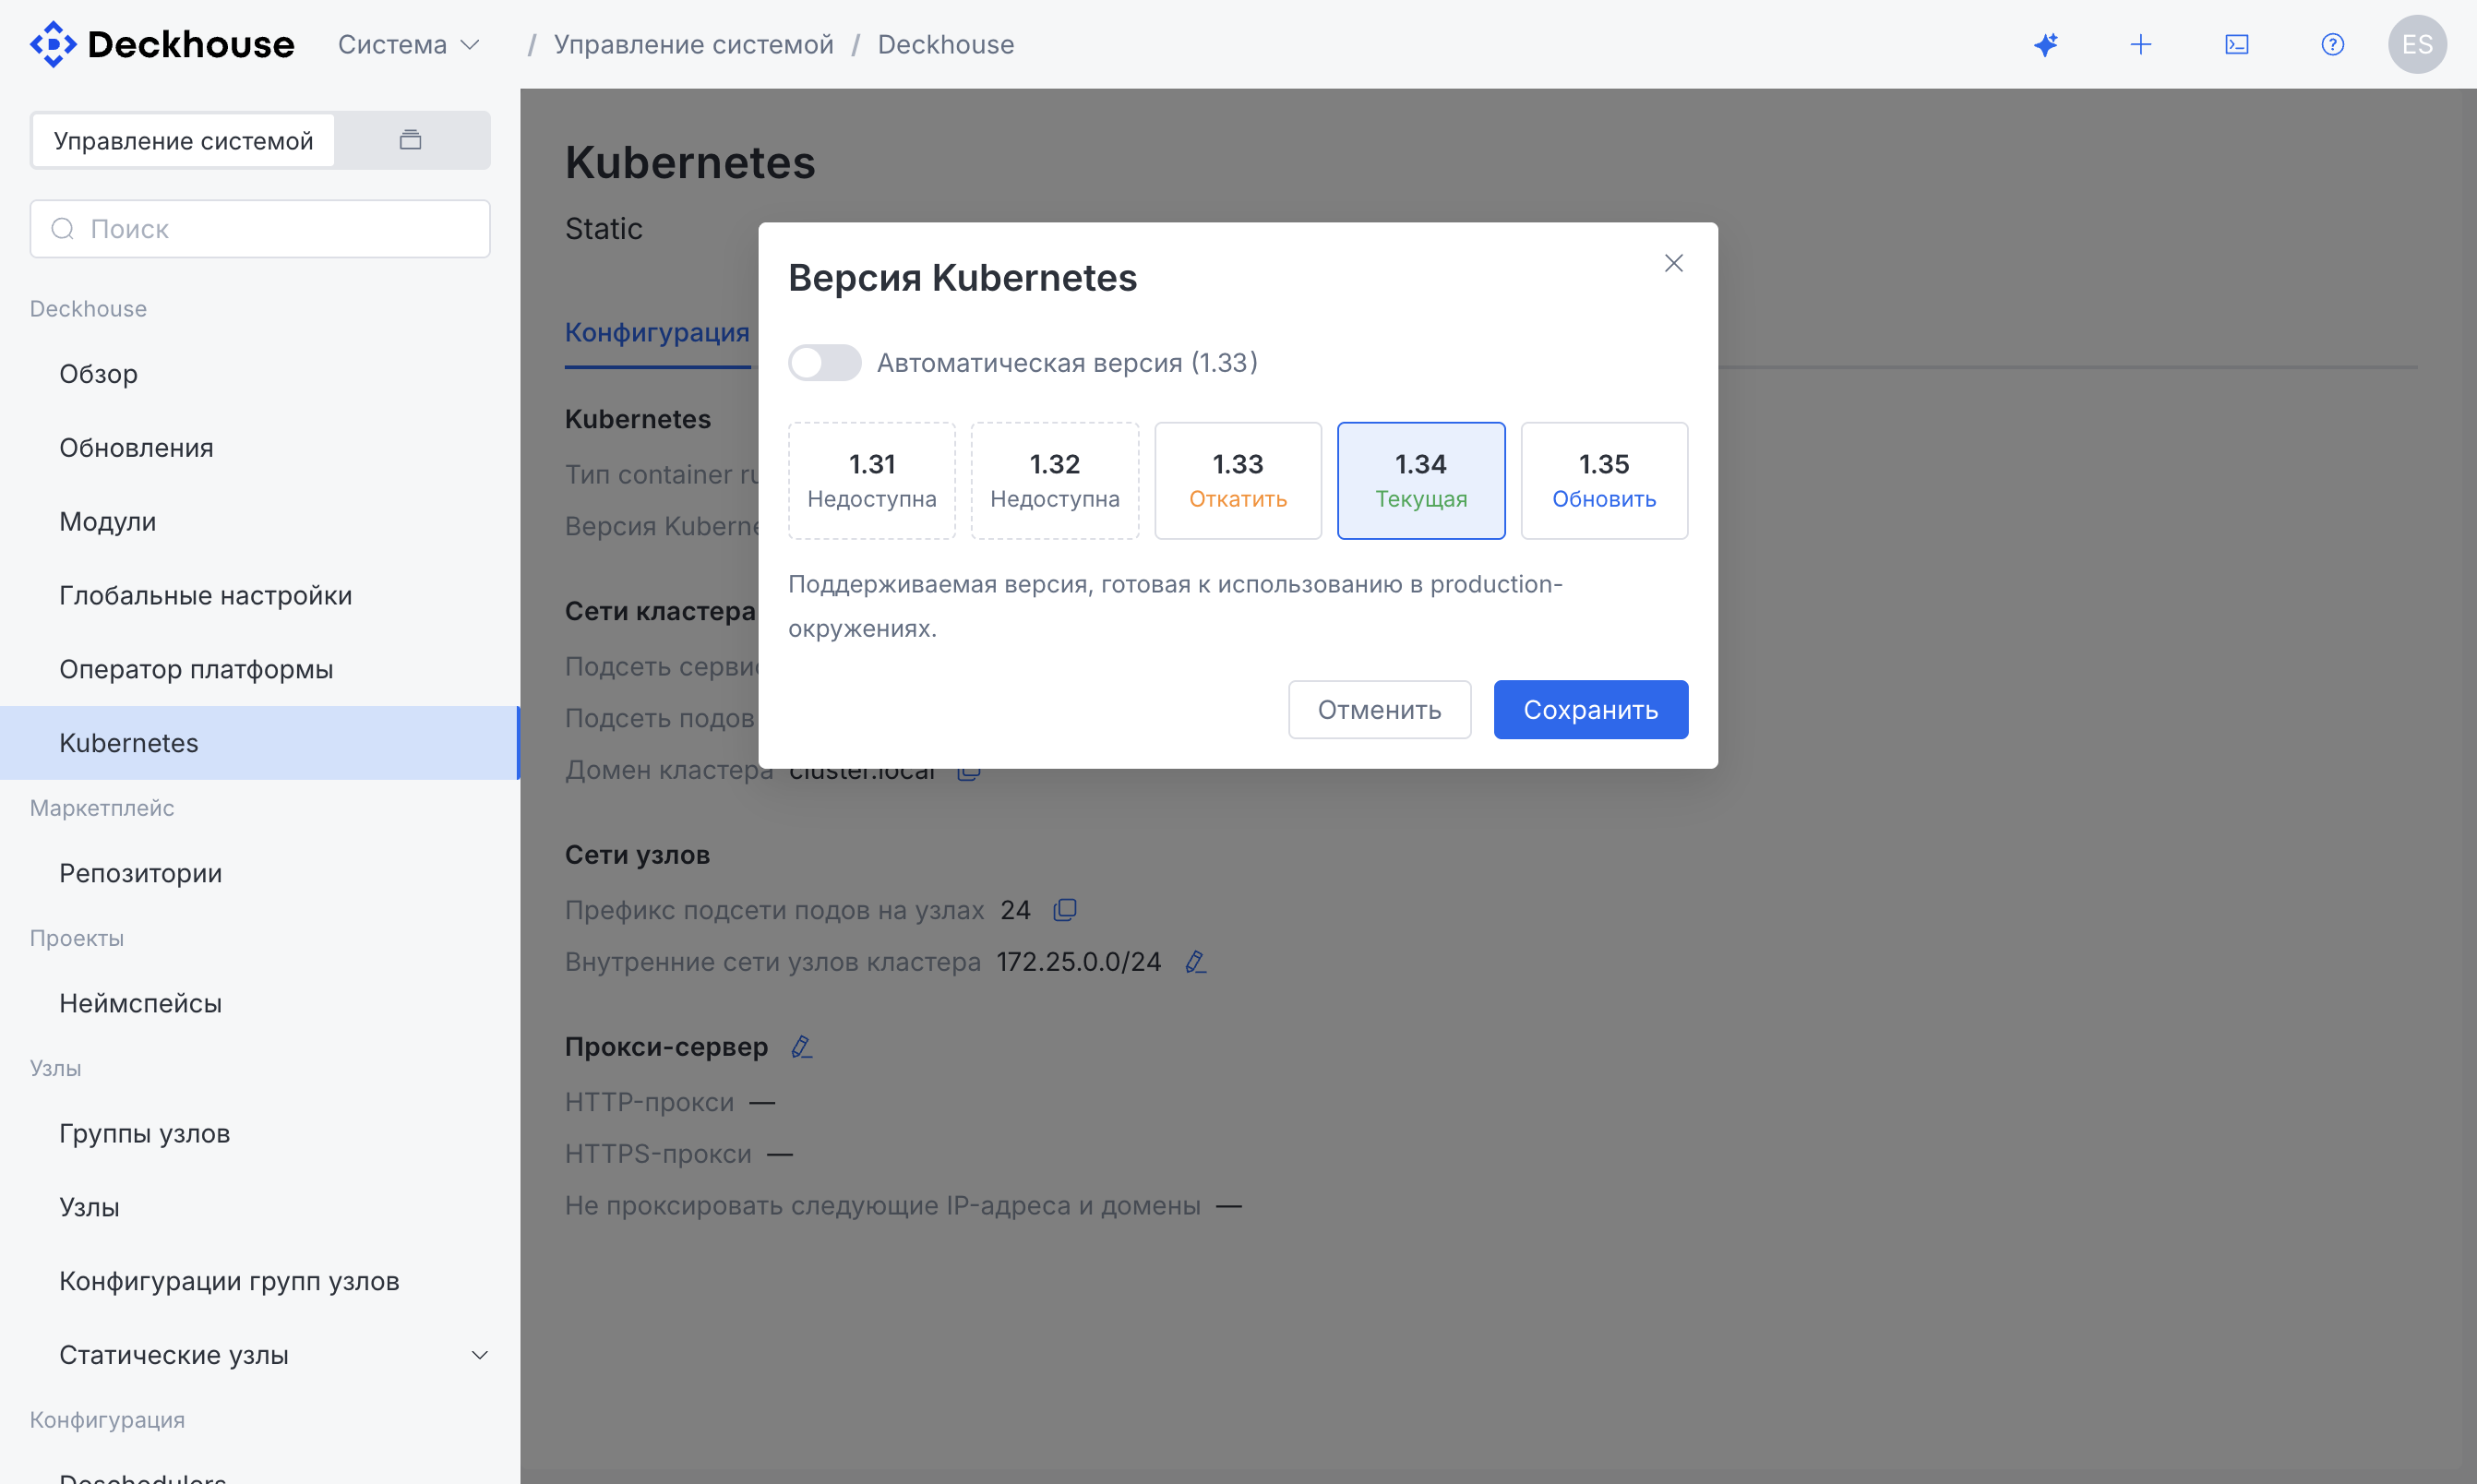
Cluster configuration
Cluster domain, service and pod subnets, the container runtime type, the container registry, and choosing and updating the Kubernetes version.
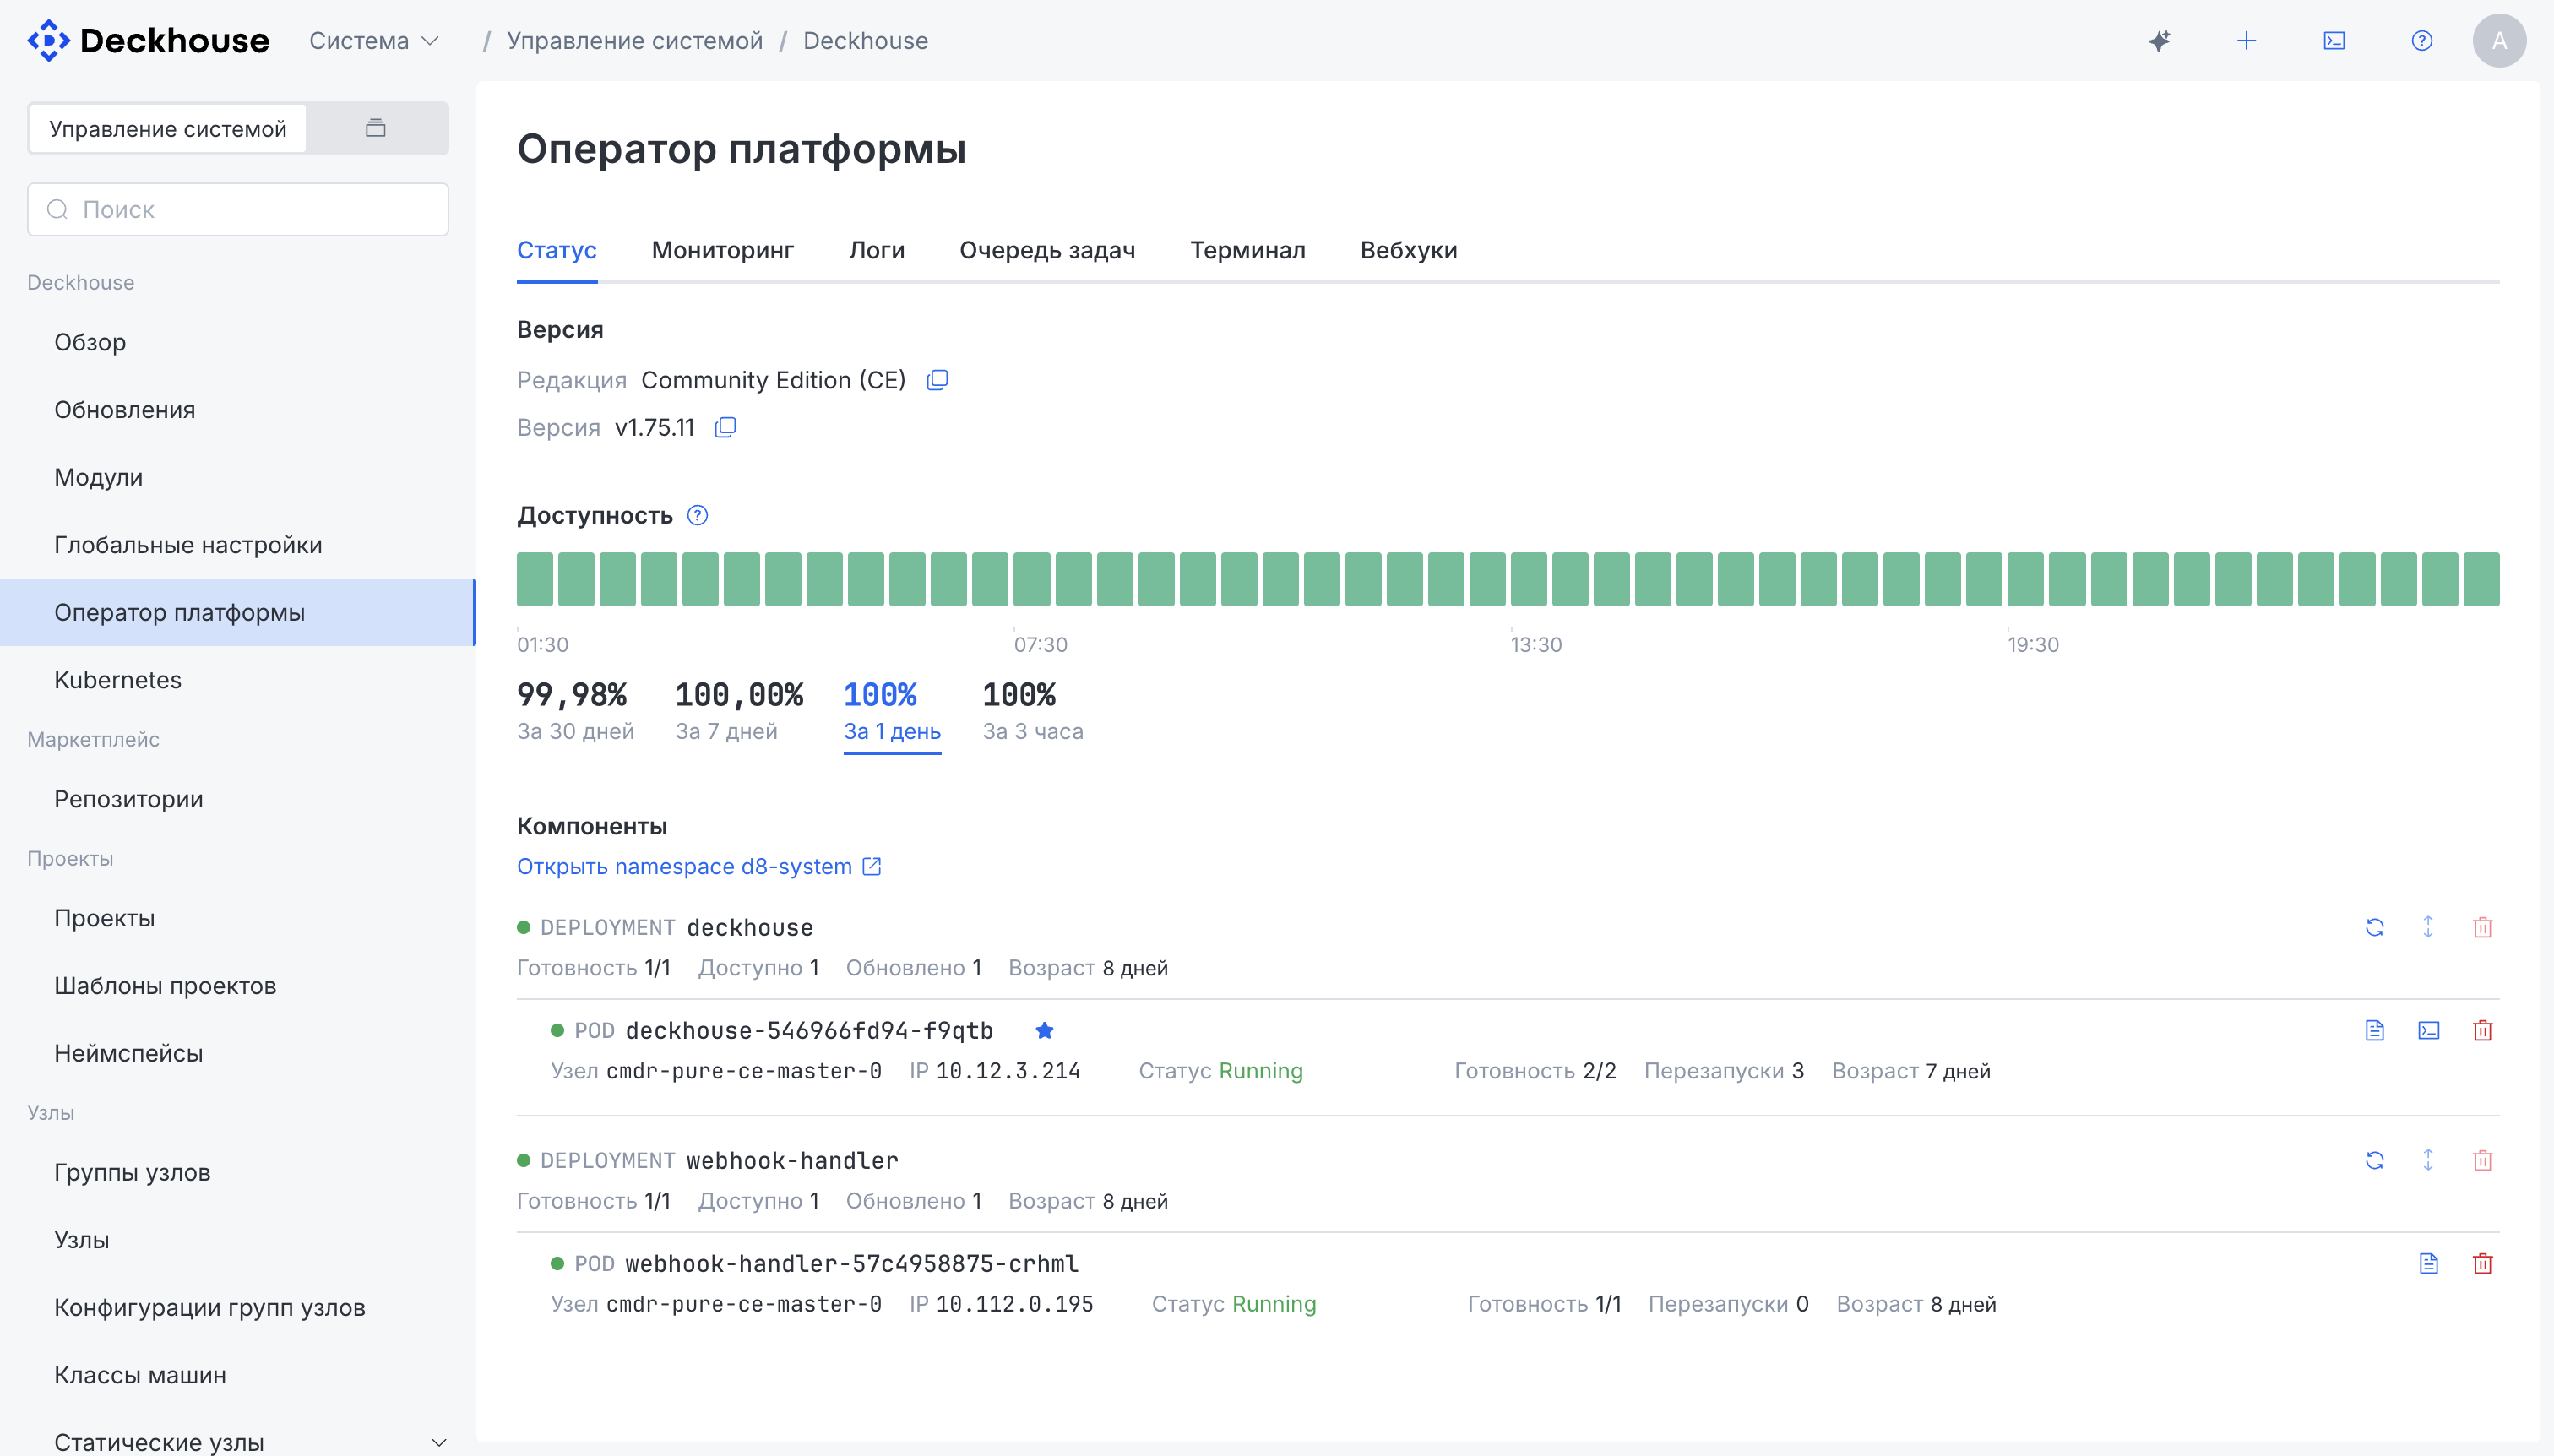
Platform operator
Status, monitoring, logs, task queue, and webhooks of the platform operator, plus a built-in terminal with a session inside its pods.
Nodes
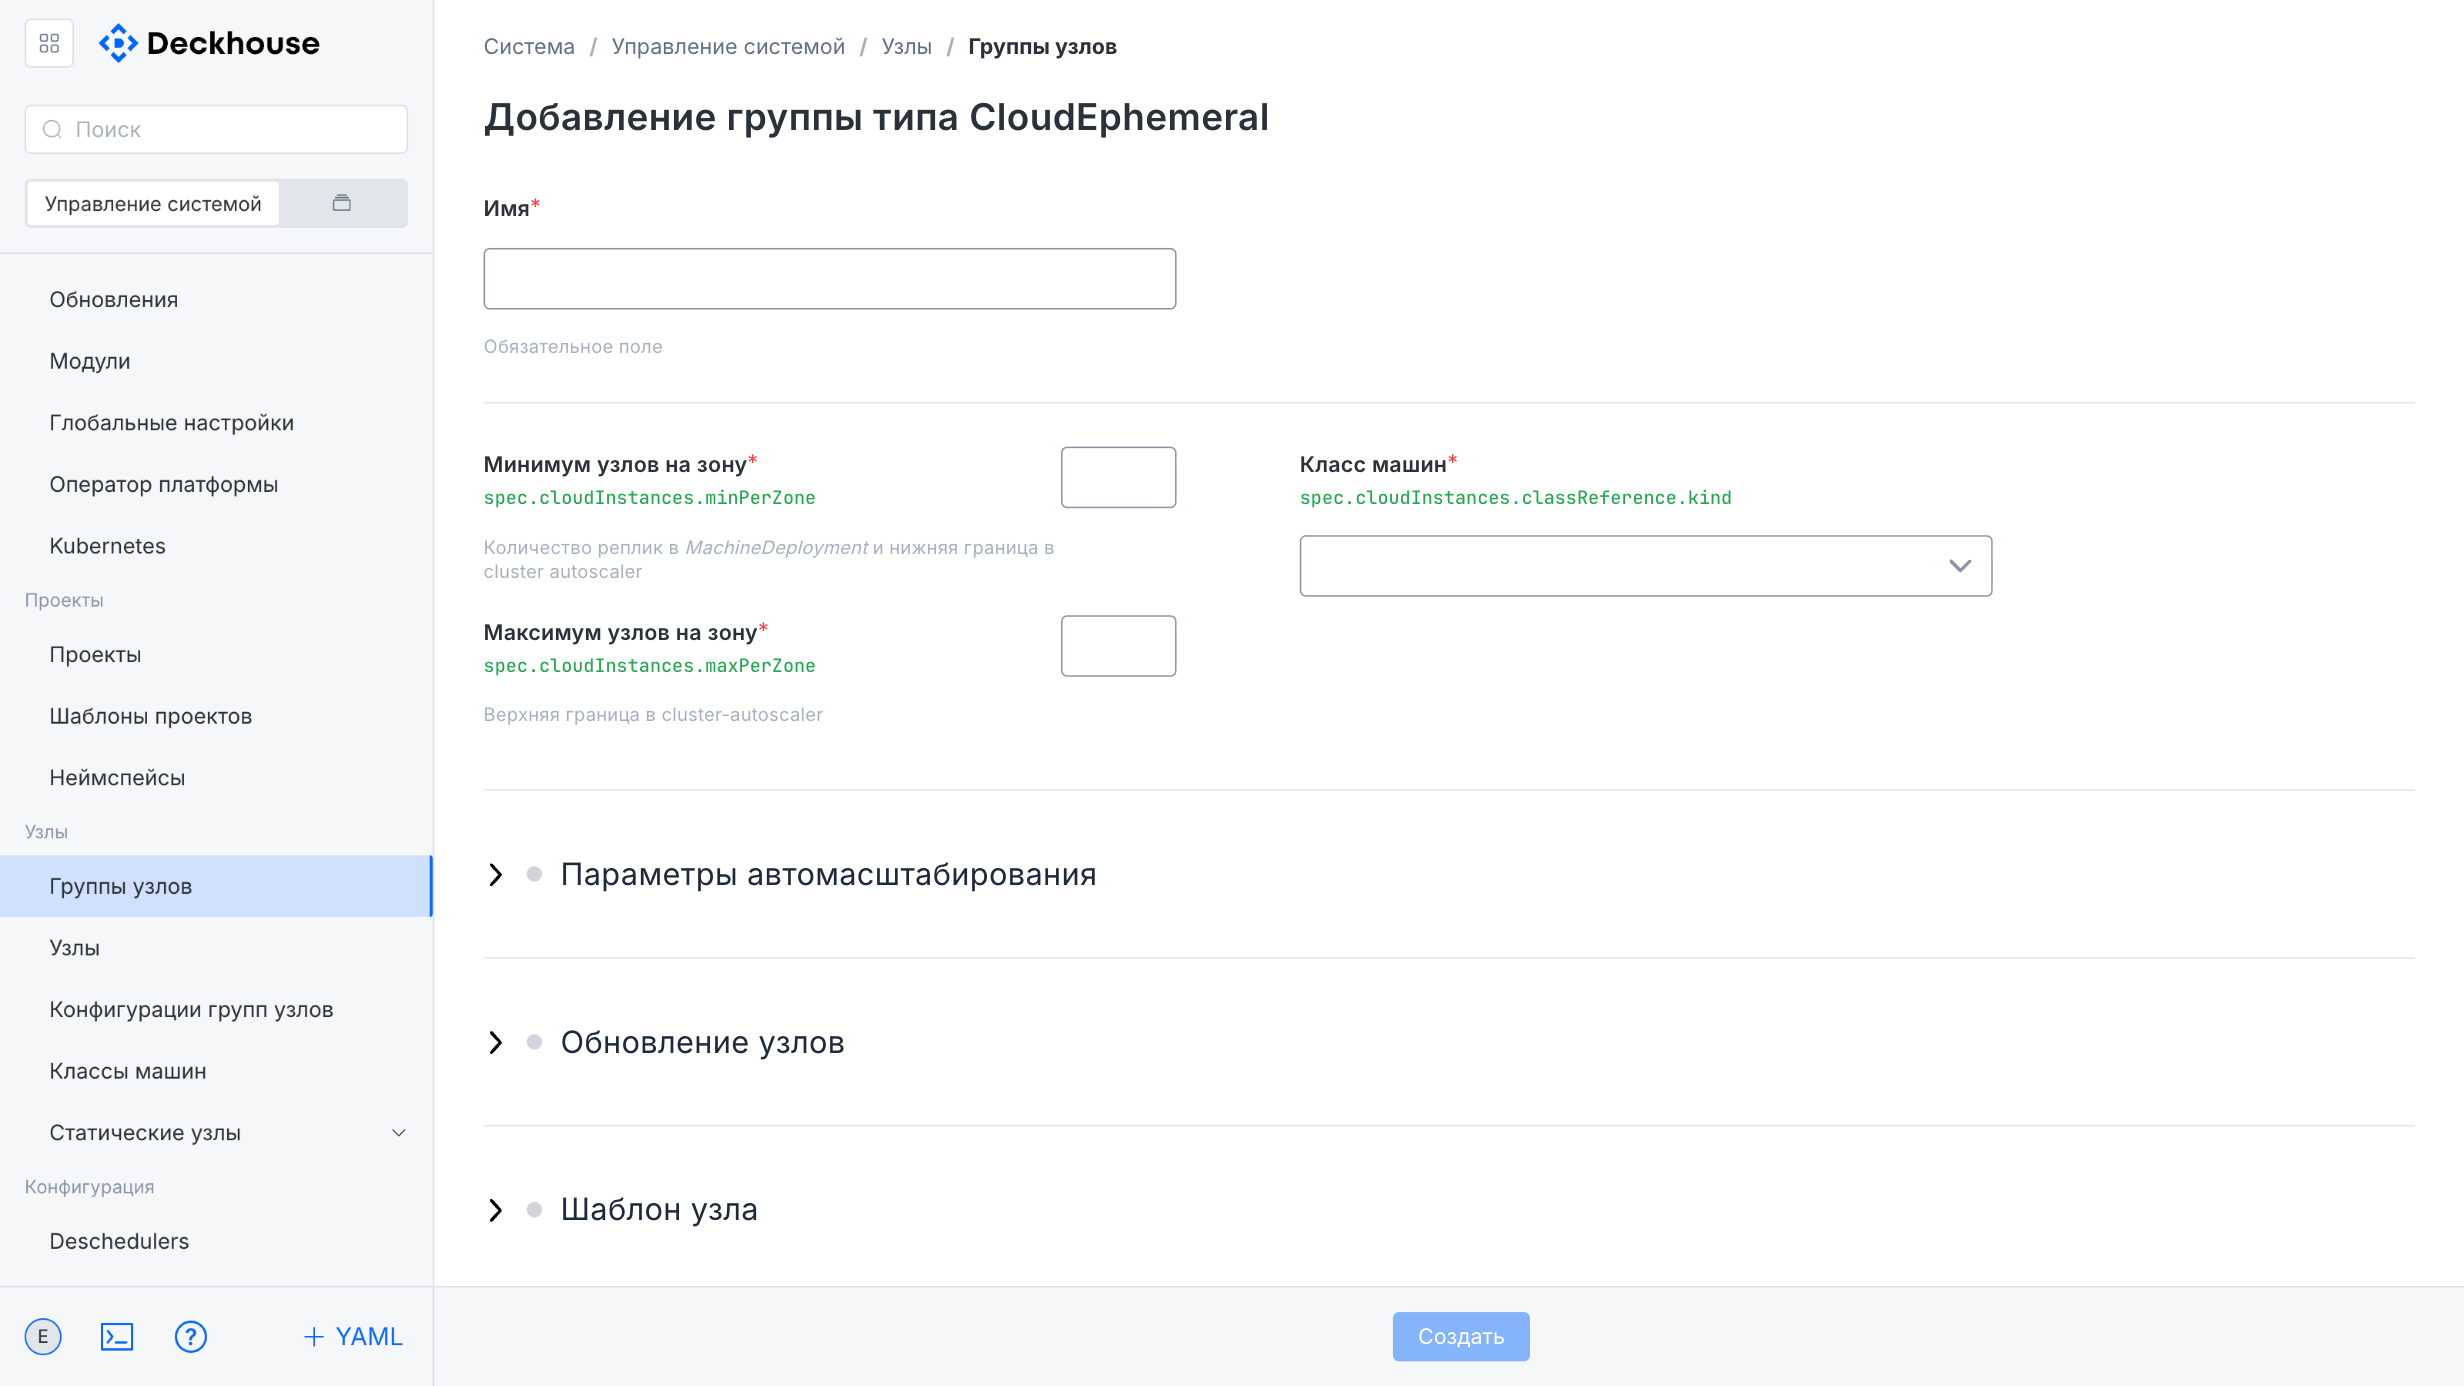
Node groups, individual nodes and their scaling, instance classes, node group configurations (NodeGroupConfiguration), static nodes and node users, metrics and monitoring per node and node group.
Networking
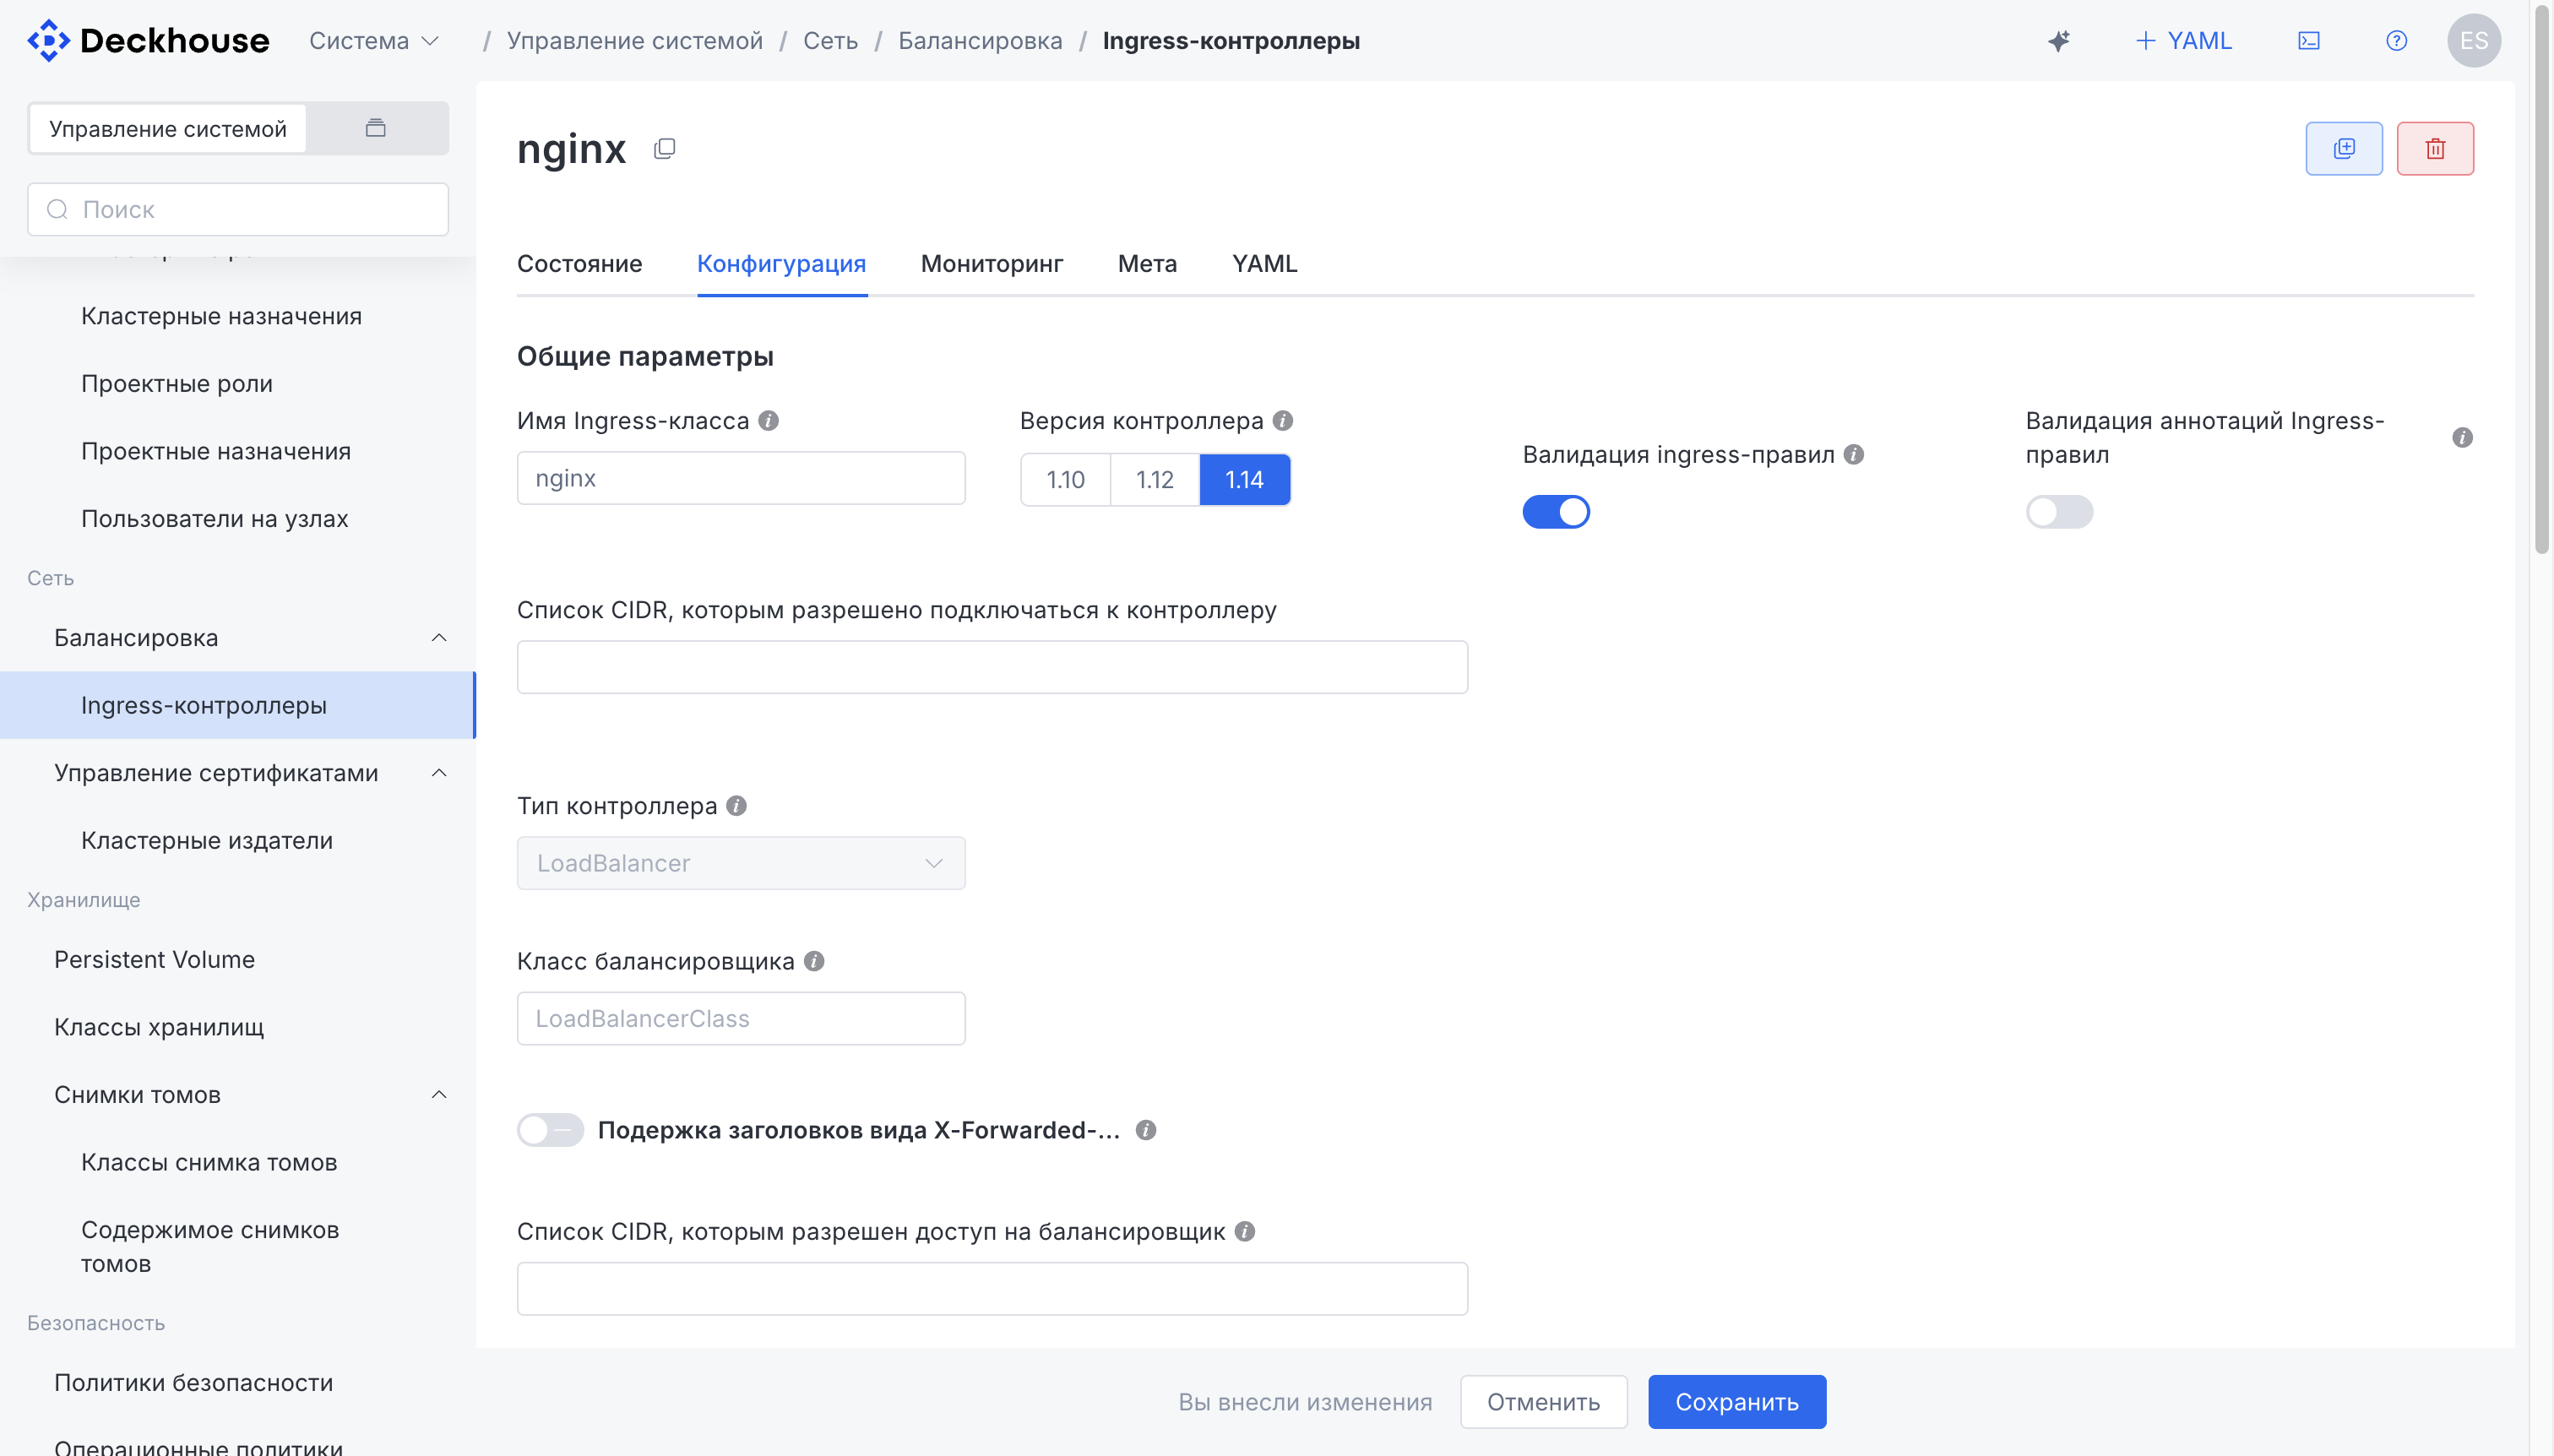
Ingress controllers configured via forms with parameter validation, TLS certificate management and cluster issuers, network policies, and the SDN module UI (if enabled).
Storage
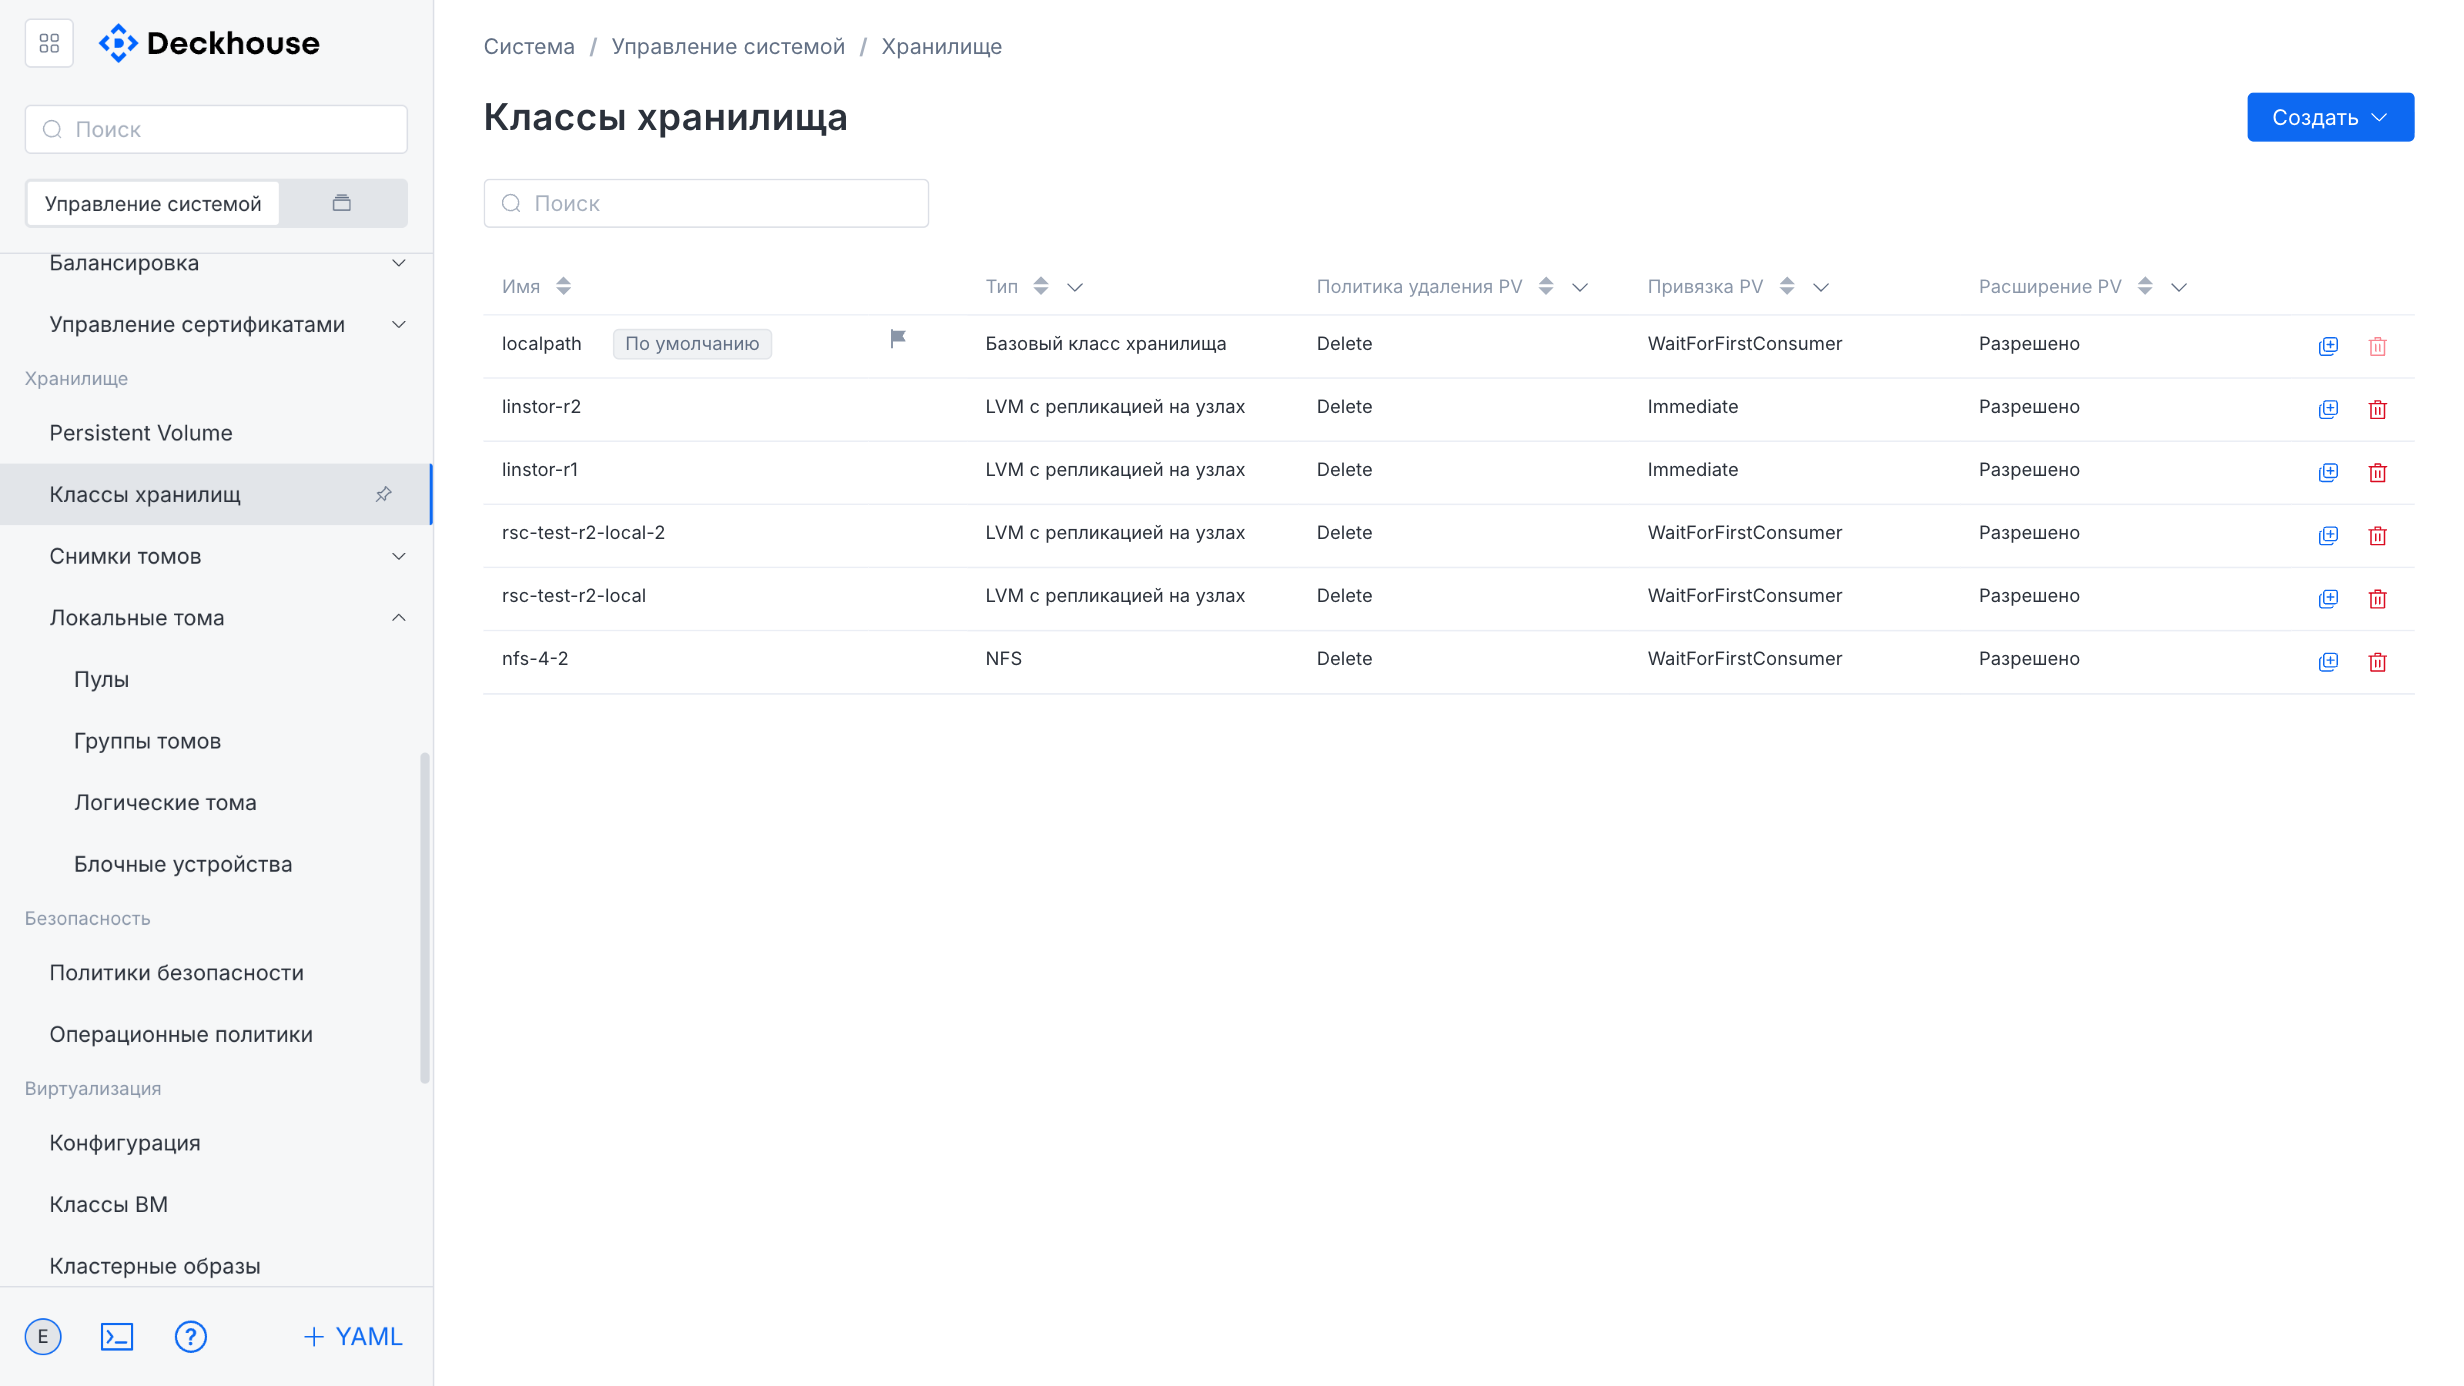
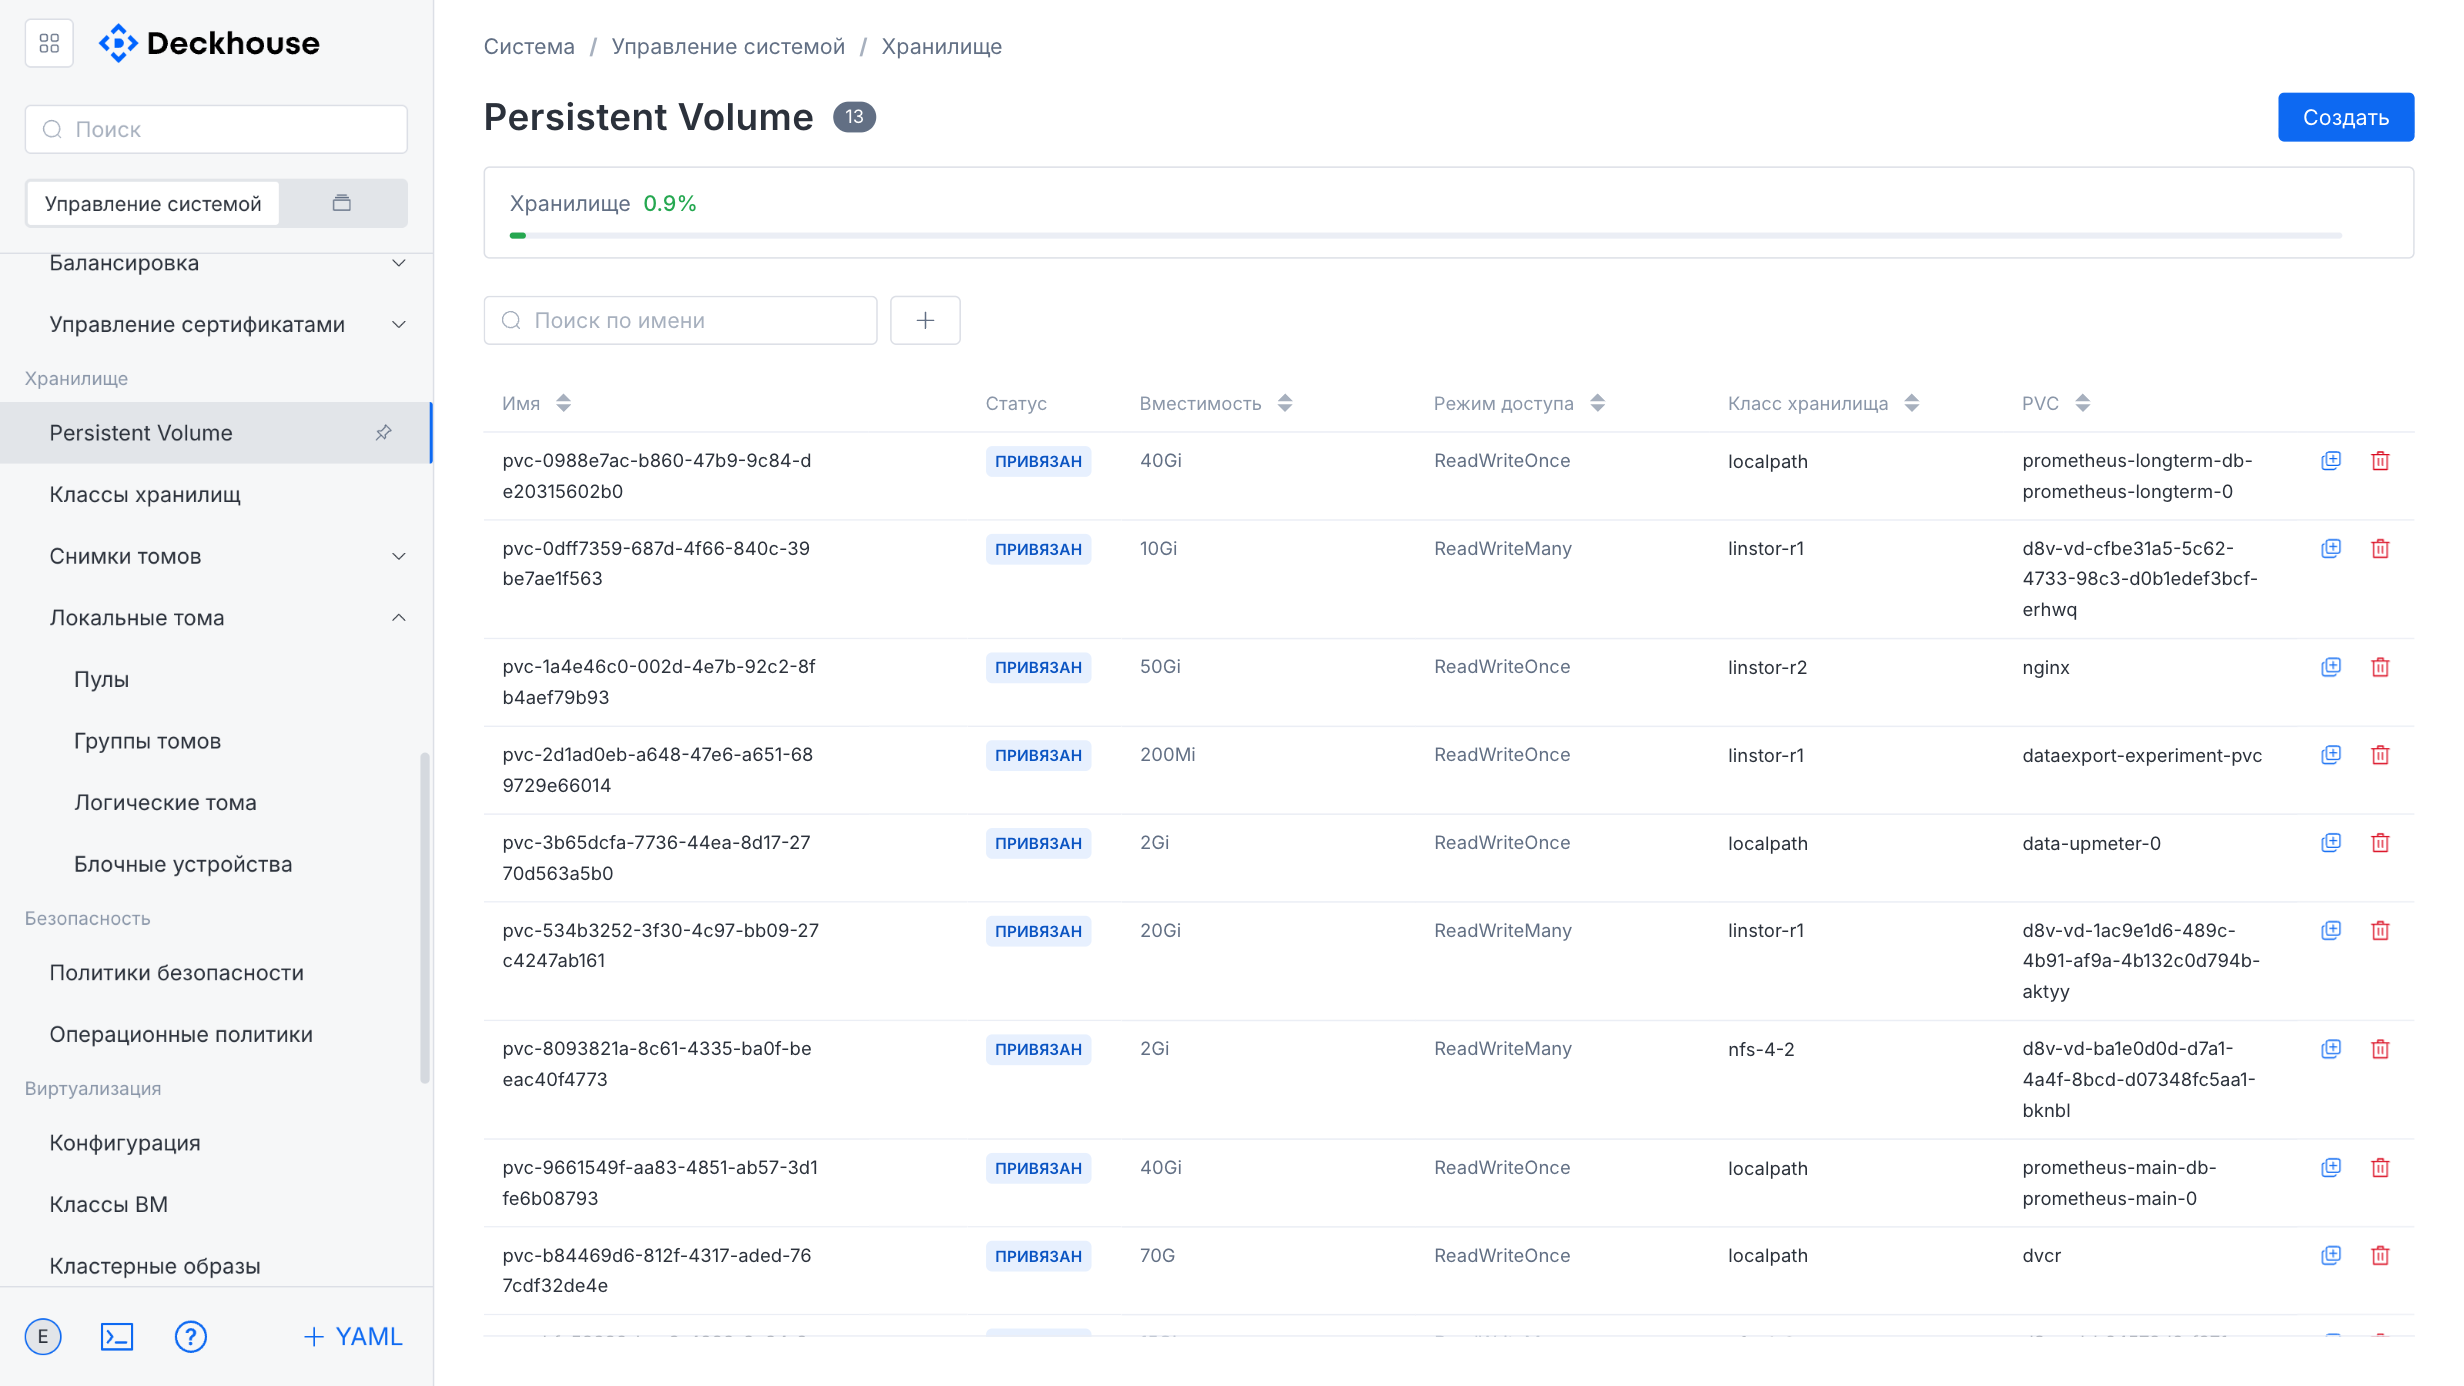
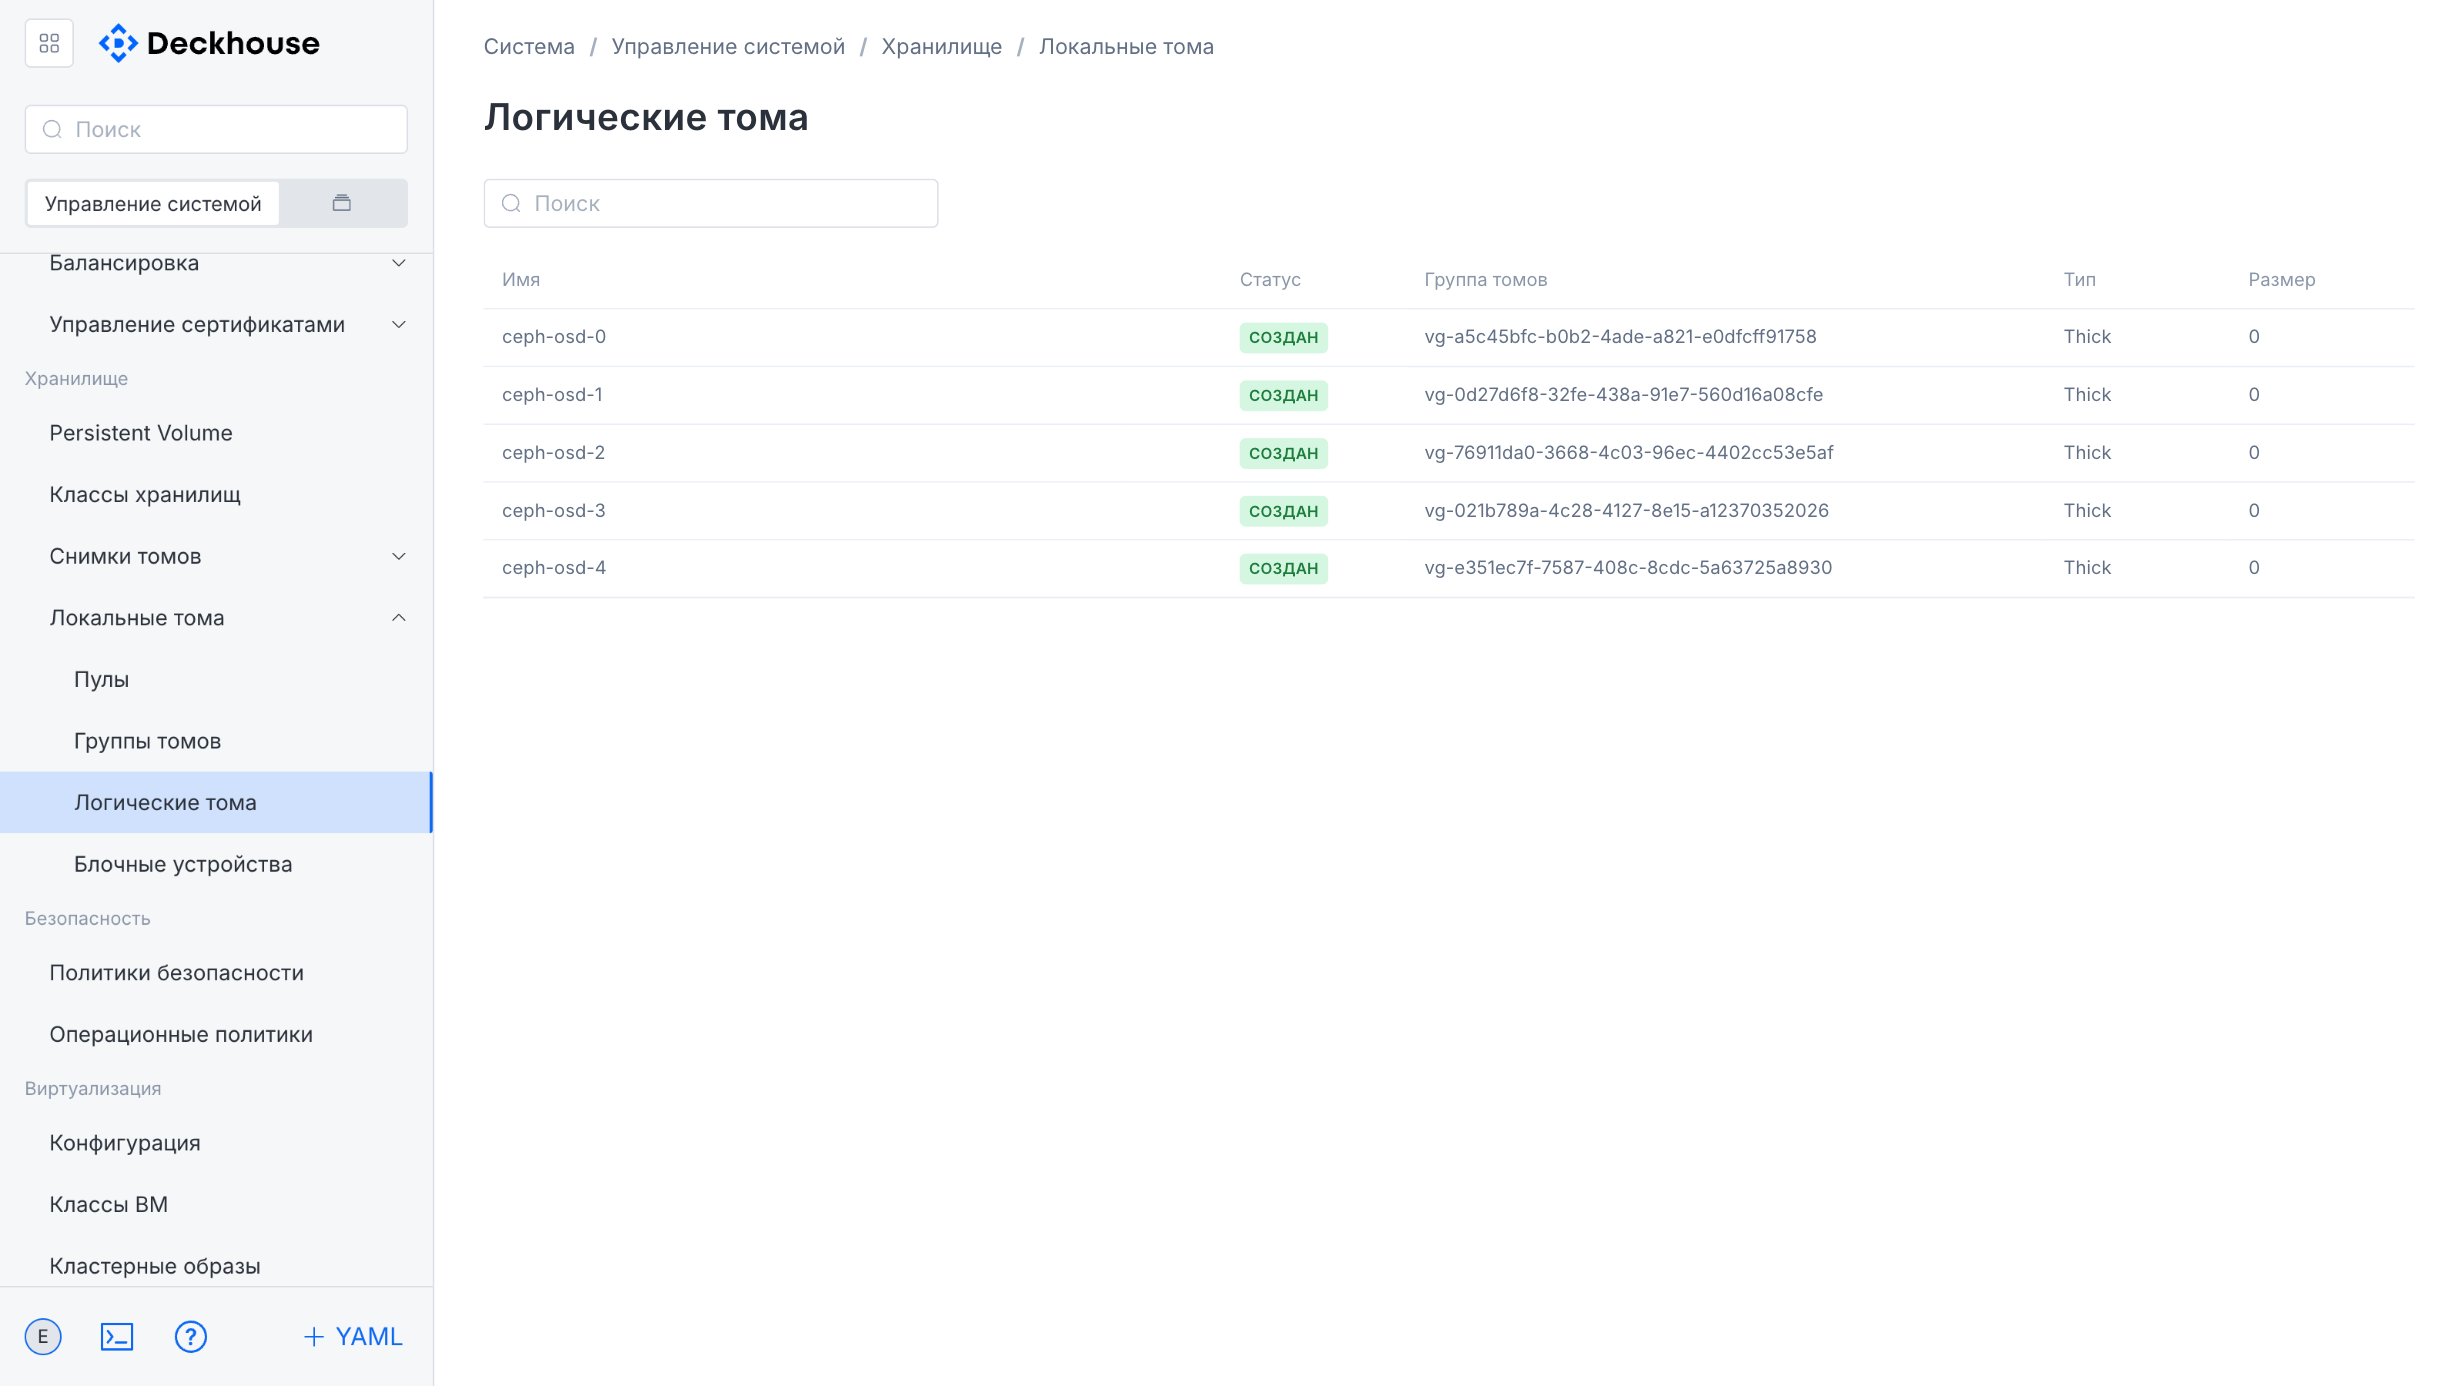
Persistent Volumes, storage classes, volume snapshots (VolumeSnapshot) and their classes. Software-defined storage (SDS): pools, volume groups and logical volumes, block devices.
Access
Authentication providers (Dex) and integration with external user directories, group and user permissions (RBAC), cluster and project role bindings, and Cluster Authorization Rules with quotas.
Security
Container runtime policies and operation policies, the vulnerability (CVE) scanner. When the corresponding modules are enabled — WAF & DLP, NeuVector, and Stronghold secrets management.
Observability
Monitoring: metrics, recording rules and alerts, Grafana dashboards and data sources, Prometheus settings, a list of firing alerts, and notification policies. Journaling: collecting logs from nodes and pods and sending them to various storage types.
Using the platform (projects)
Projects and namespaces
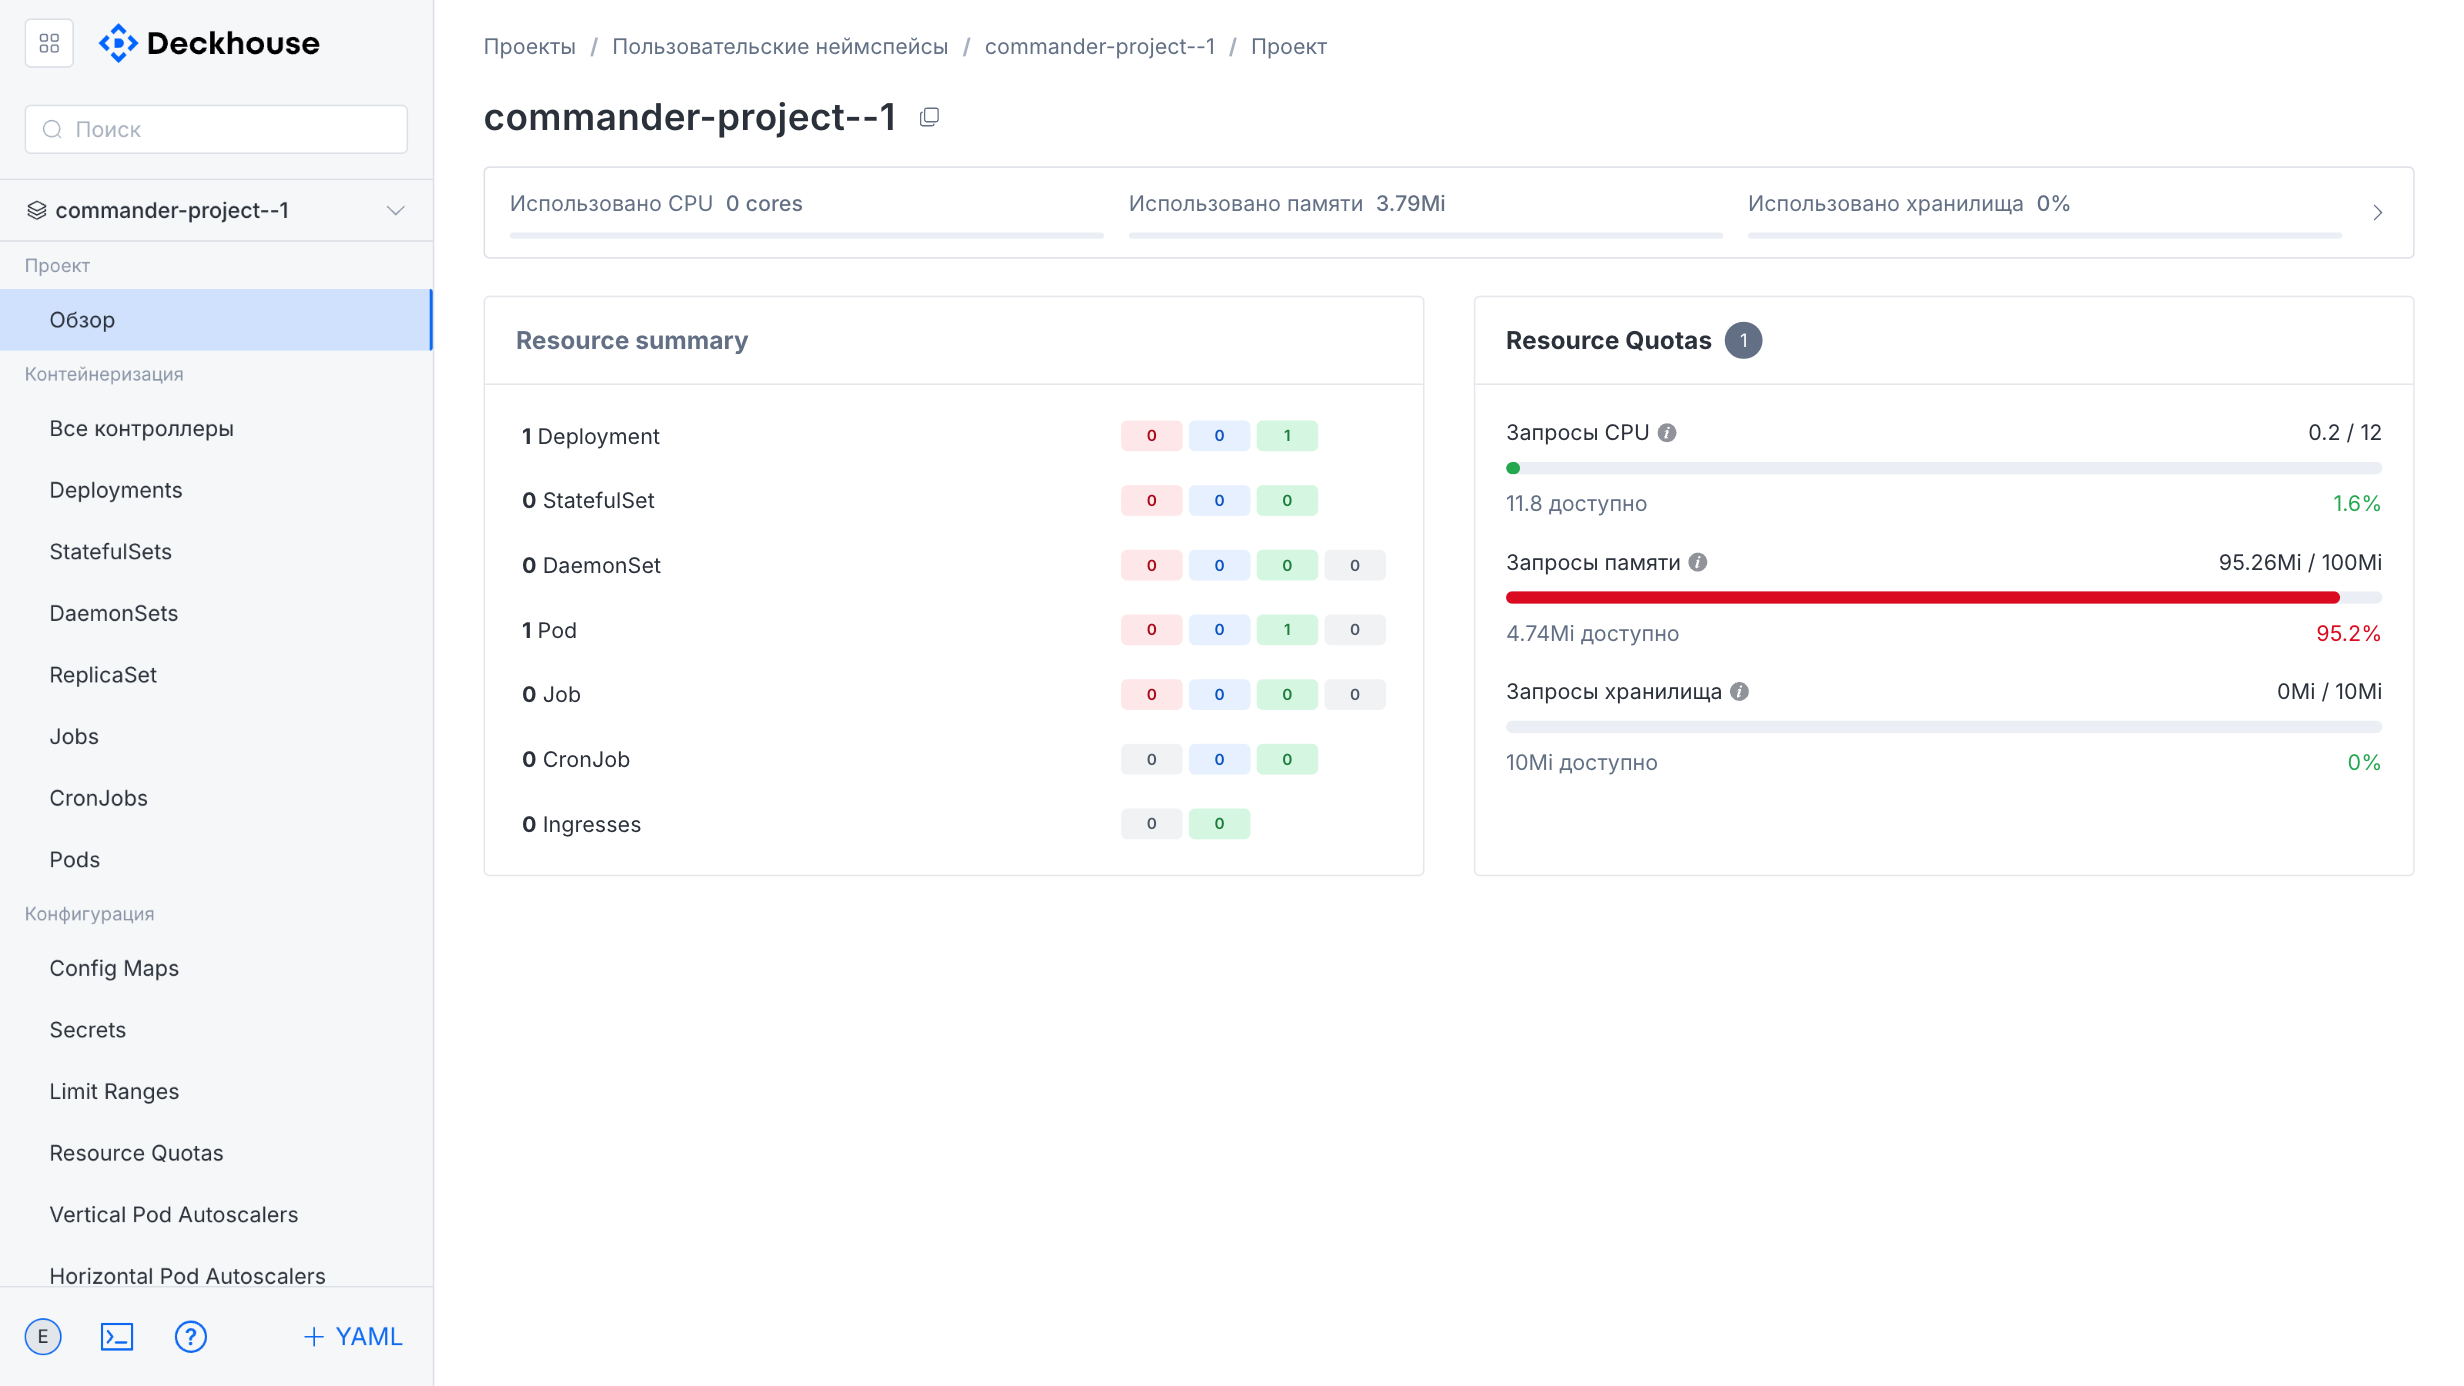
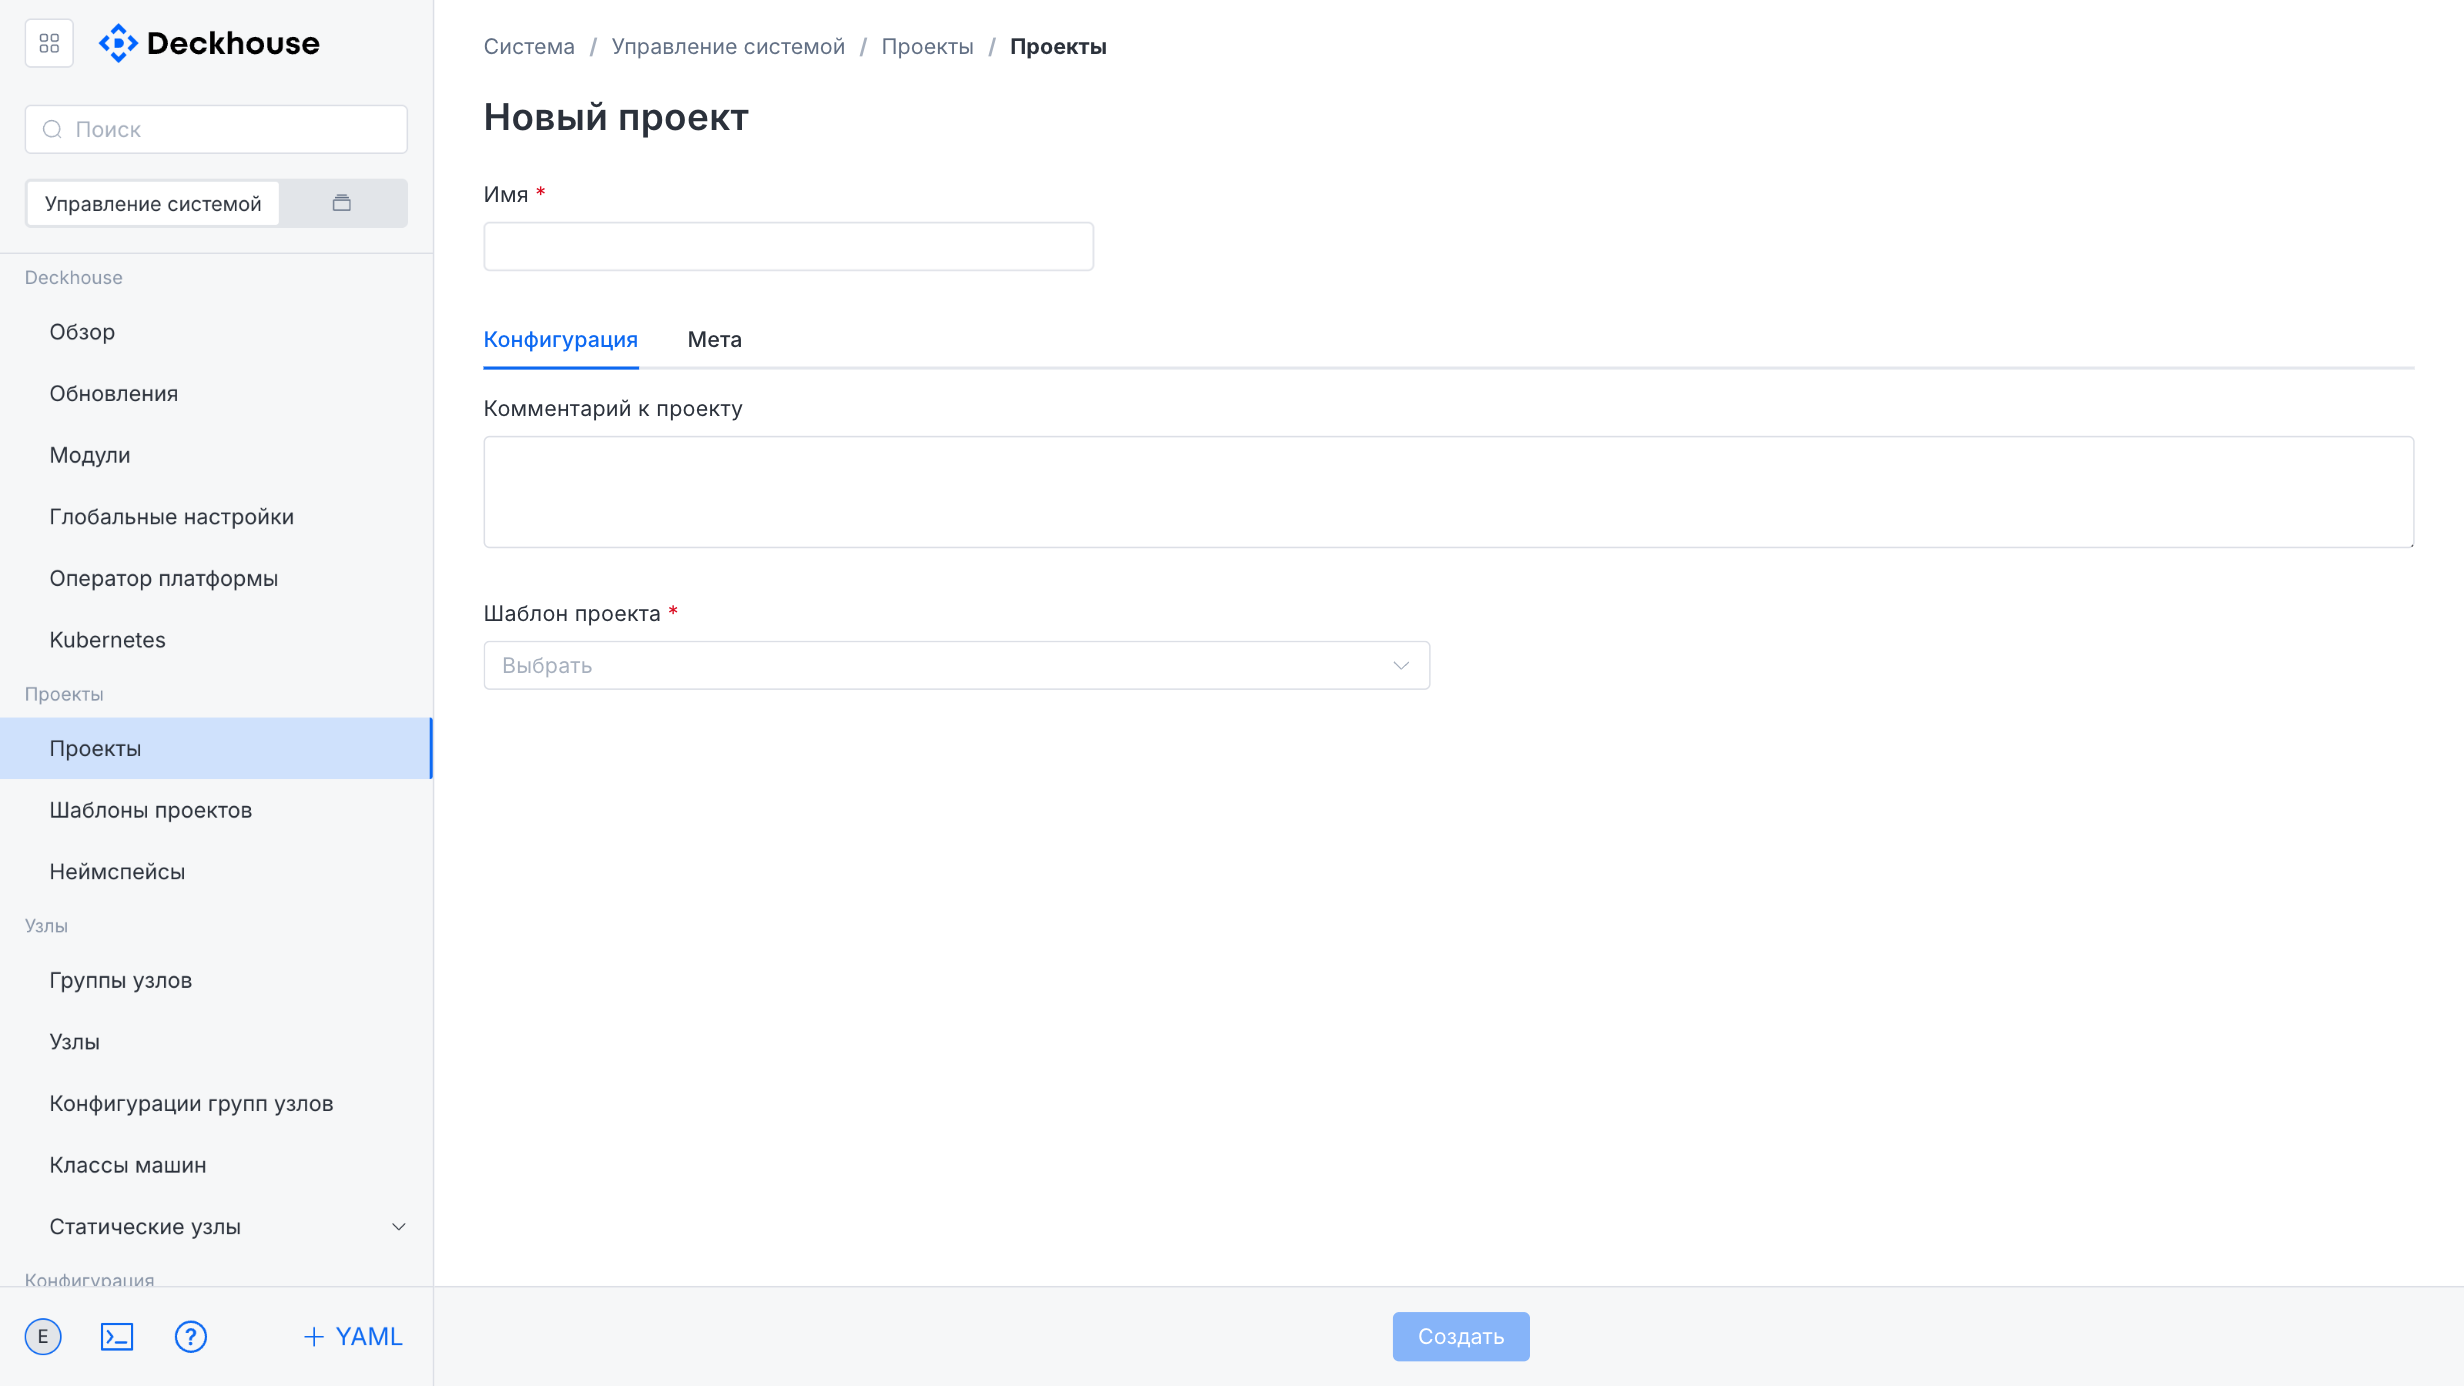
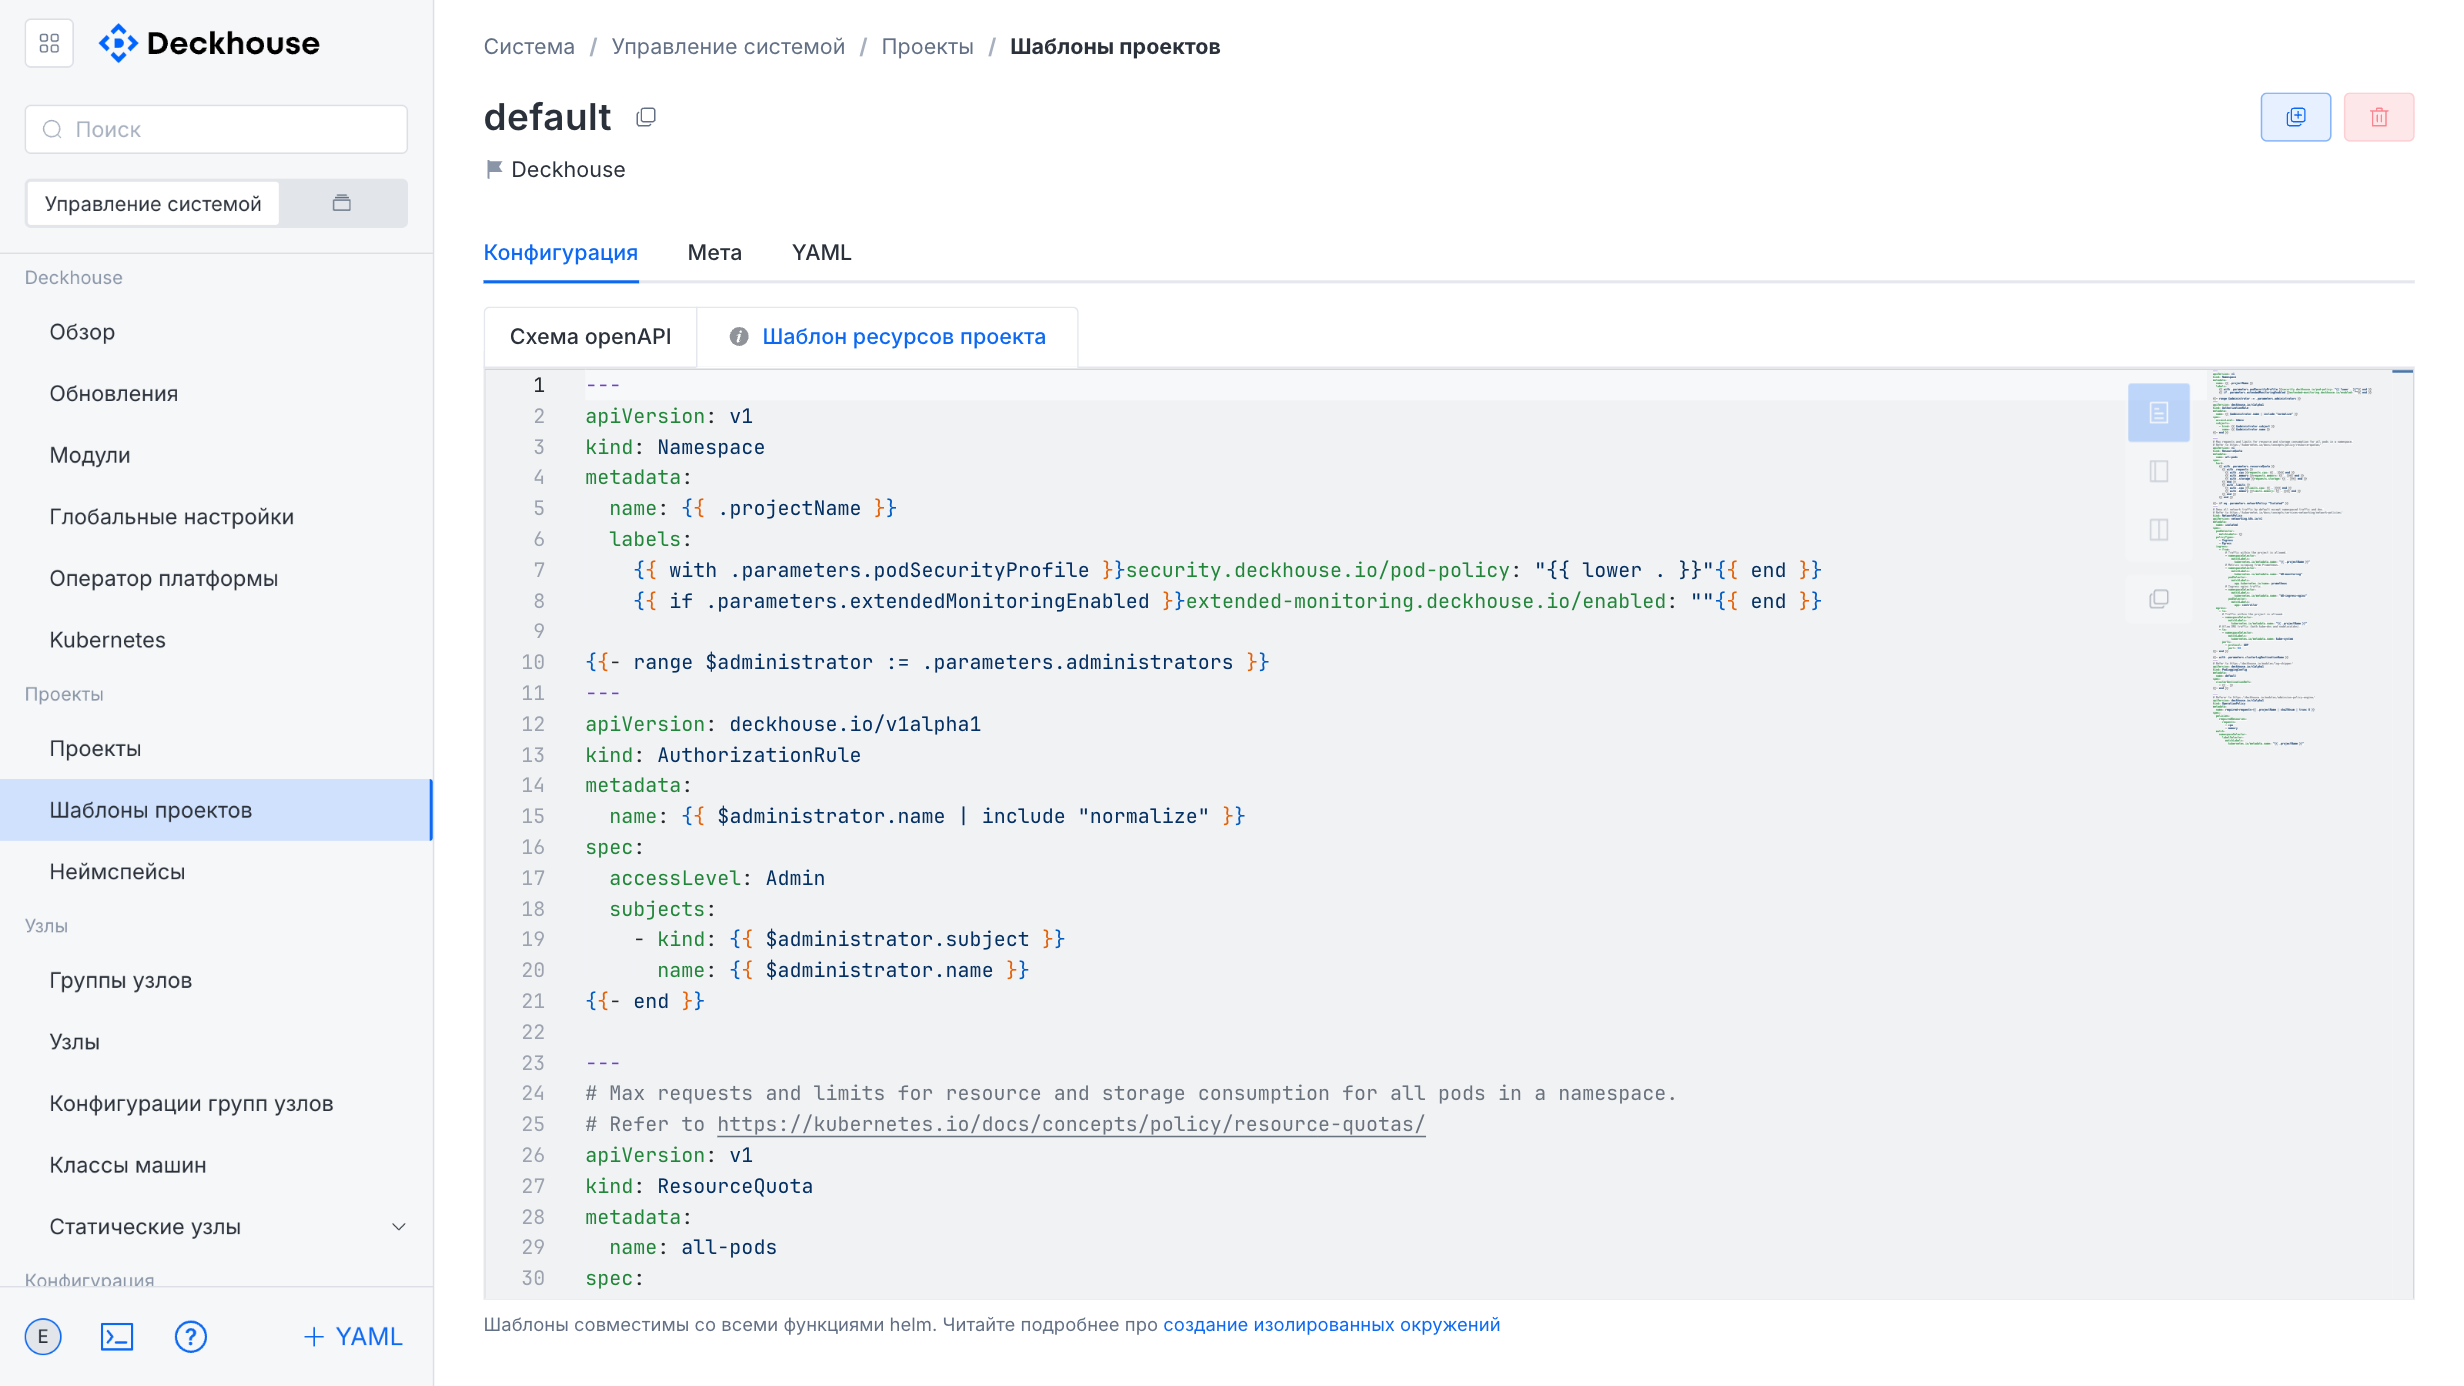
Projects and project templates (multitenancy), project and namespace overviews, project roles and bindings.
Workloads
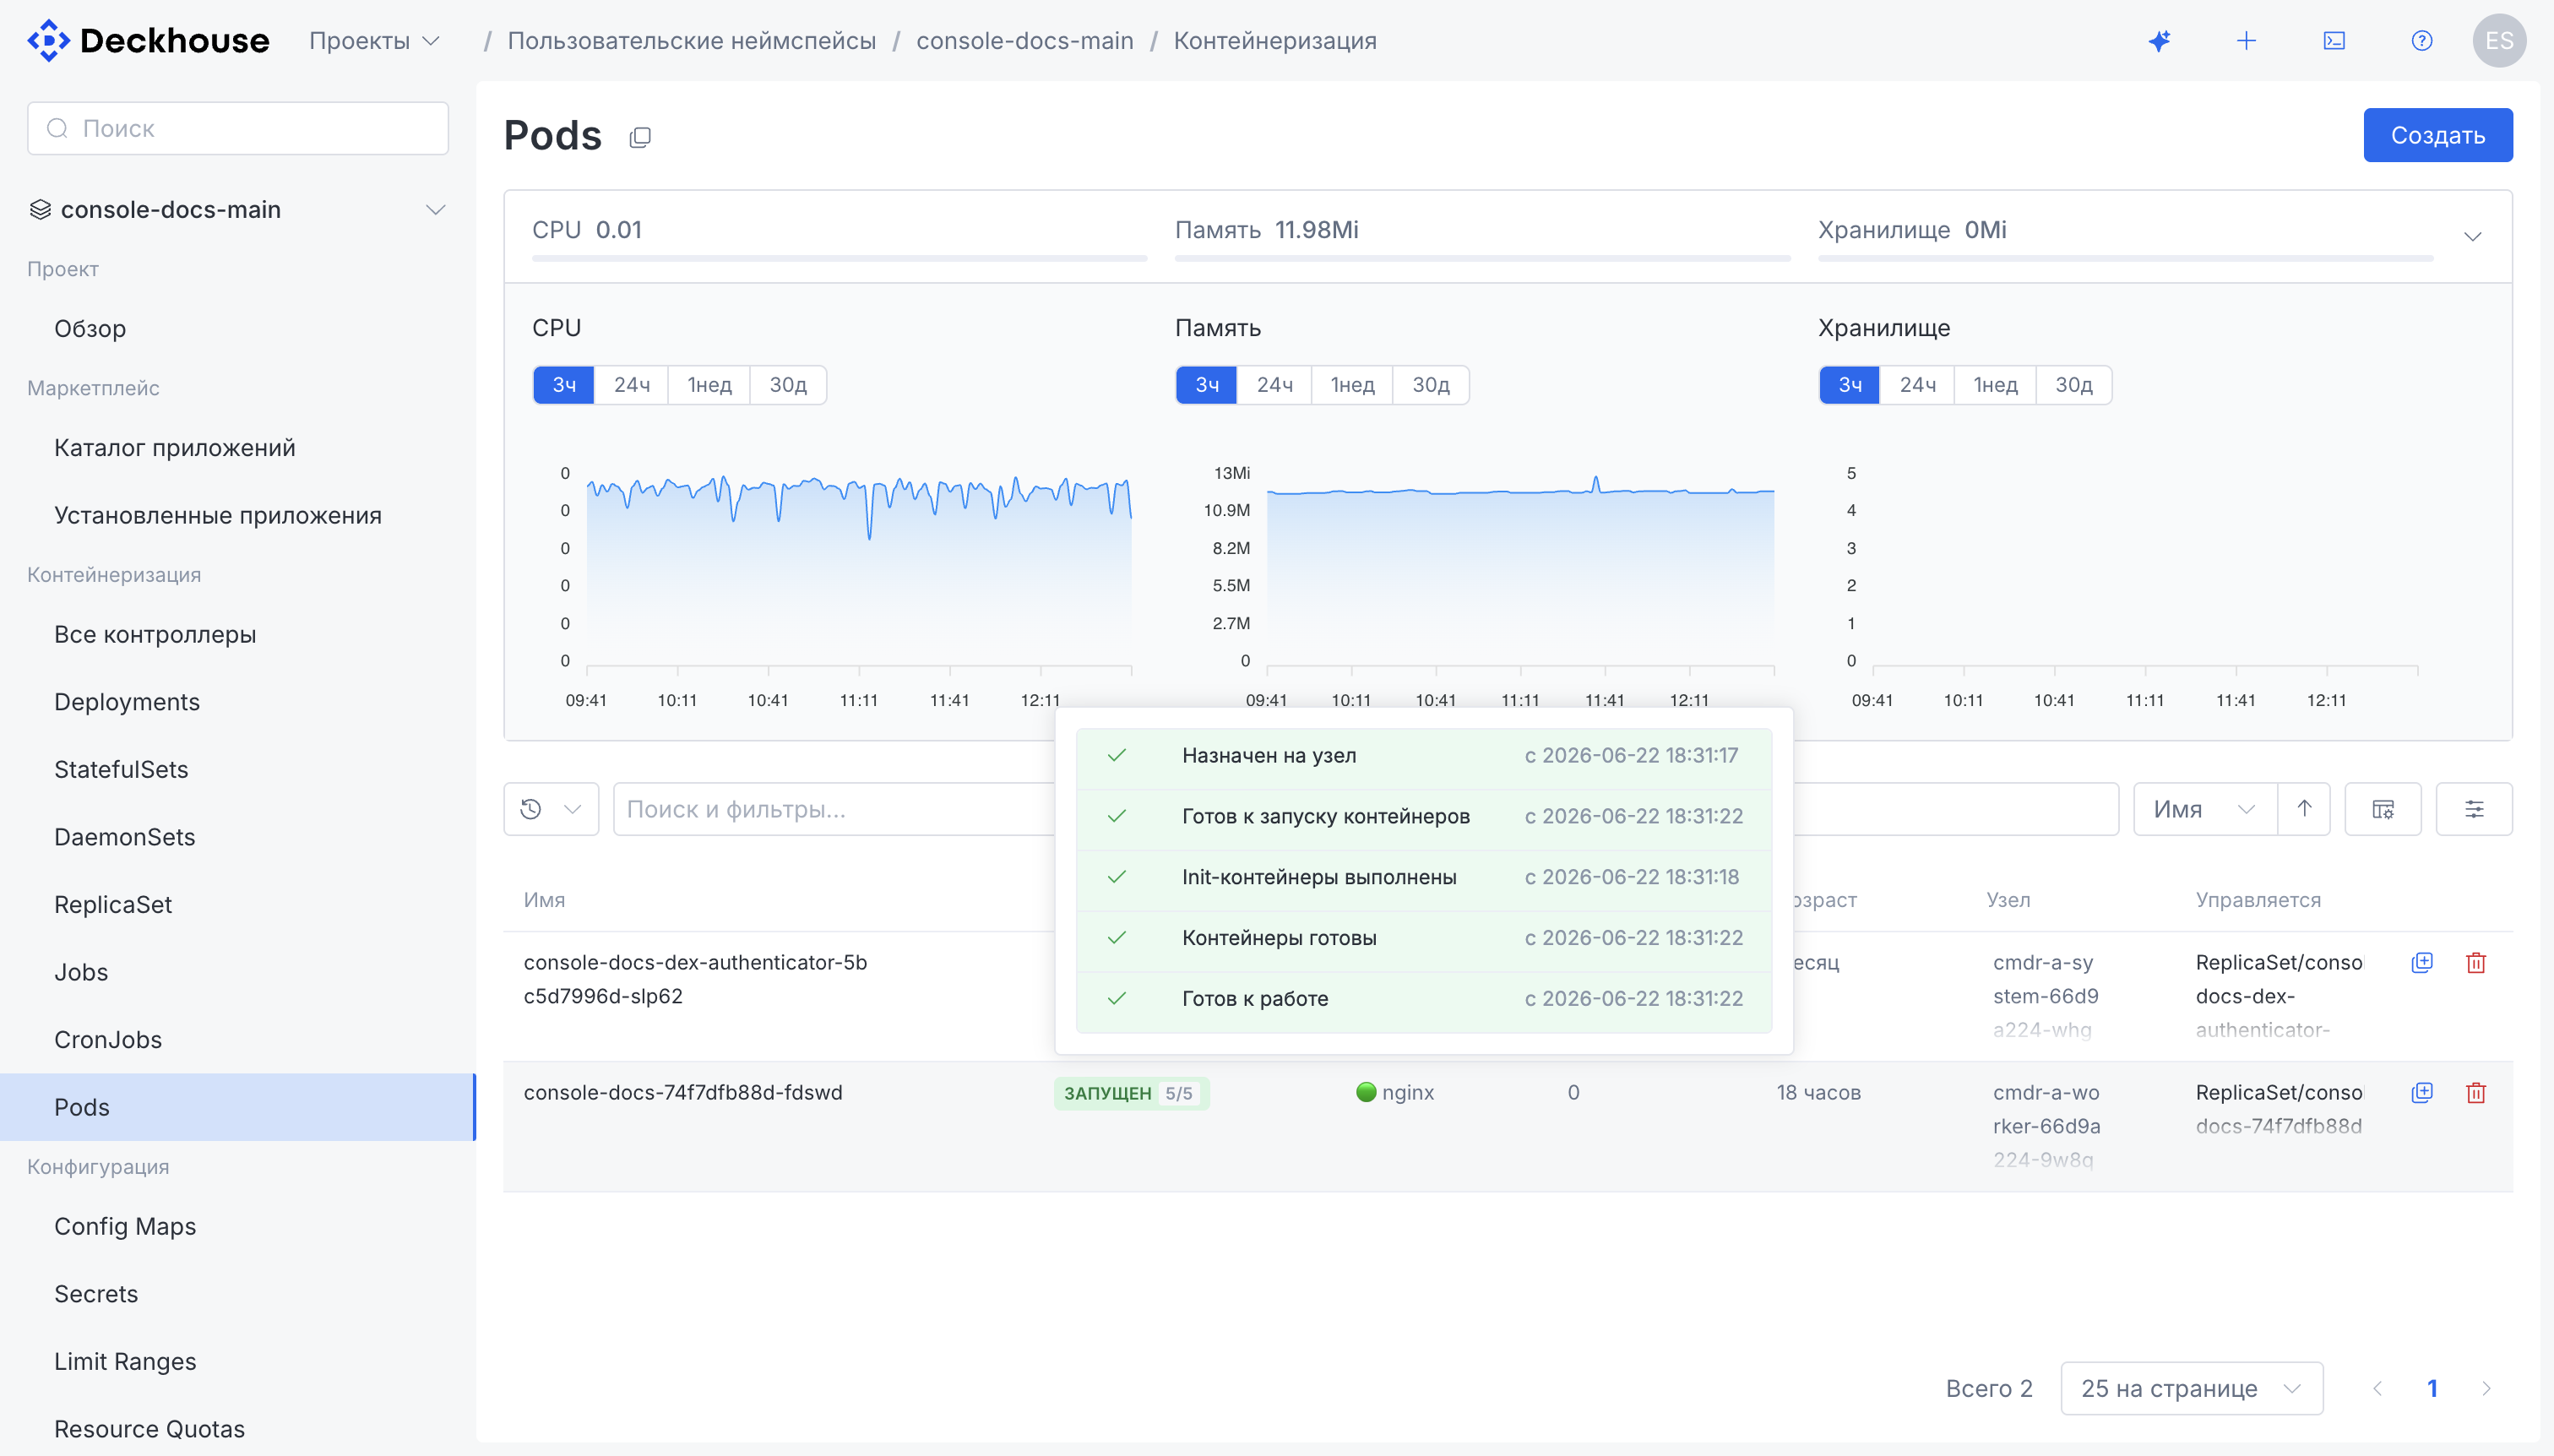
Pods, deployments, and services (including incoming traffic distribution for the LoadBalancer and HostPort types), secrets, PersistentVolumeClaims, autoscaling (VPA, HPA), and network policies.
Virtual machines
Creating VMs and configuring them via cloud-init, migration with stages and memory metrics, VNC and VM terminal access, bulk actions, disks, and images. General virtualization settings live in the administration context.
Managed services
Working with the platform’s managed services.
Interface
- AI assistant (✨) — a built-in chat about the cluster state, resources, and documentation; read-only by default and bound to the user’s permissions. See the “AI assistant” page for details.
- Working with resources as a YAML manifest: creating any resource (the “+” button) and editing an existing resource directly in YAML (a YAML tab on every resource); viewing and editing arbitrary Kubernetes resources.
- Three-column layout: navigation, the resource list, and the details (or form) of the selected resource are visible at the same time.
- Bulk actions on multiple selected resources.
- Dark and light themes.
Turning on
The module must be turned on explicitly in ModuleConfig:
apiVersion: deckhouse.io/v1alpha1
kind: ModuleConfig
metadata:
  name: console
spec:
  enabled: true
Resources requirements
Resources consumed by server-side pods are estimated as follows
| Users | CPU, cores | RAM, MiB |
|---|---|---|
| 0 | 0.02 | 80 |
| 1 | 0.04 | 100 |
| 10 | 0.37 | 120 |
| 100 | 0.85 | 260 |
| 1000 | 1.50 | 950 |
Vertical Pod Autoscaler is configured with a minimum CPU/memory limit of 100m/100MiB and a maximum of 1/512MiB. The server side pods are deployed in two replicas automatically for Deckhouse platform installation in HA mode.
Technical details
The resources that publish the web interface (Ingress, Certificate, DexAuthenticator) are created only after the cluster is bootstrapped.
Web interface address (publicDomainTemplate)
The address is built by substituting the console name into the global public domain template global.modules.publicDomainTemplate:
with the %s.example.com template, the web interface is available at console.example.com.
If the template is not set, the module still works, but the web interface is not published: Ingress, Certificate, and DexAuthenticator resources are not created.
Publishing via Ingress (ingress-nginx)
The web interface is published with Ingress resources: separate Ingresses are created for the frontend, for the server-side API (the /api path),
and for the assistant and the observability gateway when the corresponding features are enabled.
The Ingress class is taken from the module’s ingressClass parameter, falling back to the global global.modules.ingressClass.
The Ingress resources rely on nginx.ingress.kubernetes.io/* annotations: API path rewriting, external authentication,
IP address allowlisting, and proxy buffer sizes. Therefore, they must be handled by an NGINX-based Ingress controller,
such as the ingress-nginx module. Whether the ingress-nginx module itself is enabled is not checked:
the Ingresses are always created, and routing is provided by whichever controller serves the specified class.
If the HTTPS mode is Disabled, no Ingresses are created and the web interface is unavailable.
HTTPS and cert-manager
The HTTPS mode is set by the module’s https.mode parameter, falling back to the global global.modules.https.mode:
CertManager— the module creates a Certificate resource, and the specified ClusterIssuer issues a certificate into theingress-tlsSecret. The Certificate is created only if thecert-manager.io/v1/CertificateCRD is available in the cluster. The check is deliberately for the CRD rather than for thecert-managermodule being enabled: a third-party cert-manager installed outside of Deckhouse is sufficient to issue the certificate.CustomCertificate— the user-provided certificate is copied by a module hook into thed8-consolenamespace (theingress-tls-customcertificateSecret) and attached to the Ingresses.OnlyInURI— Ingresses are created without a TLS section; HTTPS is assumed to be terminated outside the cluster.Disabled— the web interface is not published.
Vertical Pod Autoscaler
A VerticalPodAutoscaler resource with the InPlaceOrRecreate update mode is created for every Deployment of the module.
The VPA is created only if the vertical-pod-autoscaler module is enabled AND the verticalpodautoscalers.autoscaling.k8s.io CRD (the autoscaling.k8s.io/v1 API) is present in the cluster.
The double check is intentional: the CRD may be installed by a third-party VPA,
so its presence alone does not mean the platform module is enabled.
Besides, the InPlaceOrRecreate update mode is handled correctly by the platform’s own VPA controller,
while a third-party VPA installation may not support it.
When the VPA is not created, pods get static resource requests equal to the VPA minimums.