Ultimate real-time infrastructure and application observability
Deckhouse
Observability Platform

Key benefits
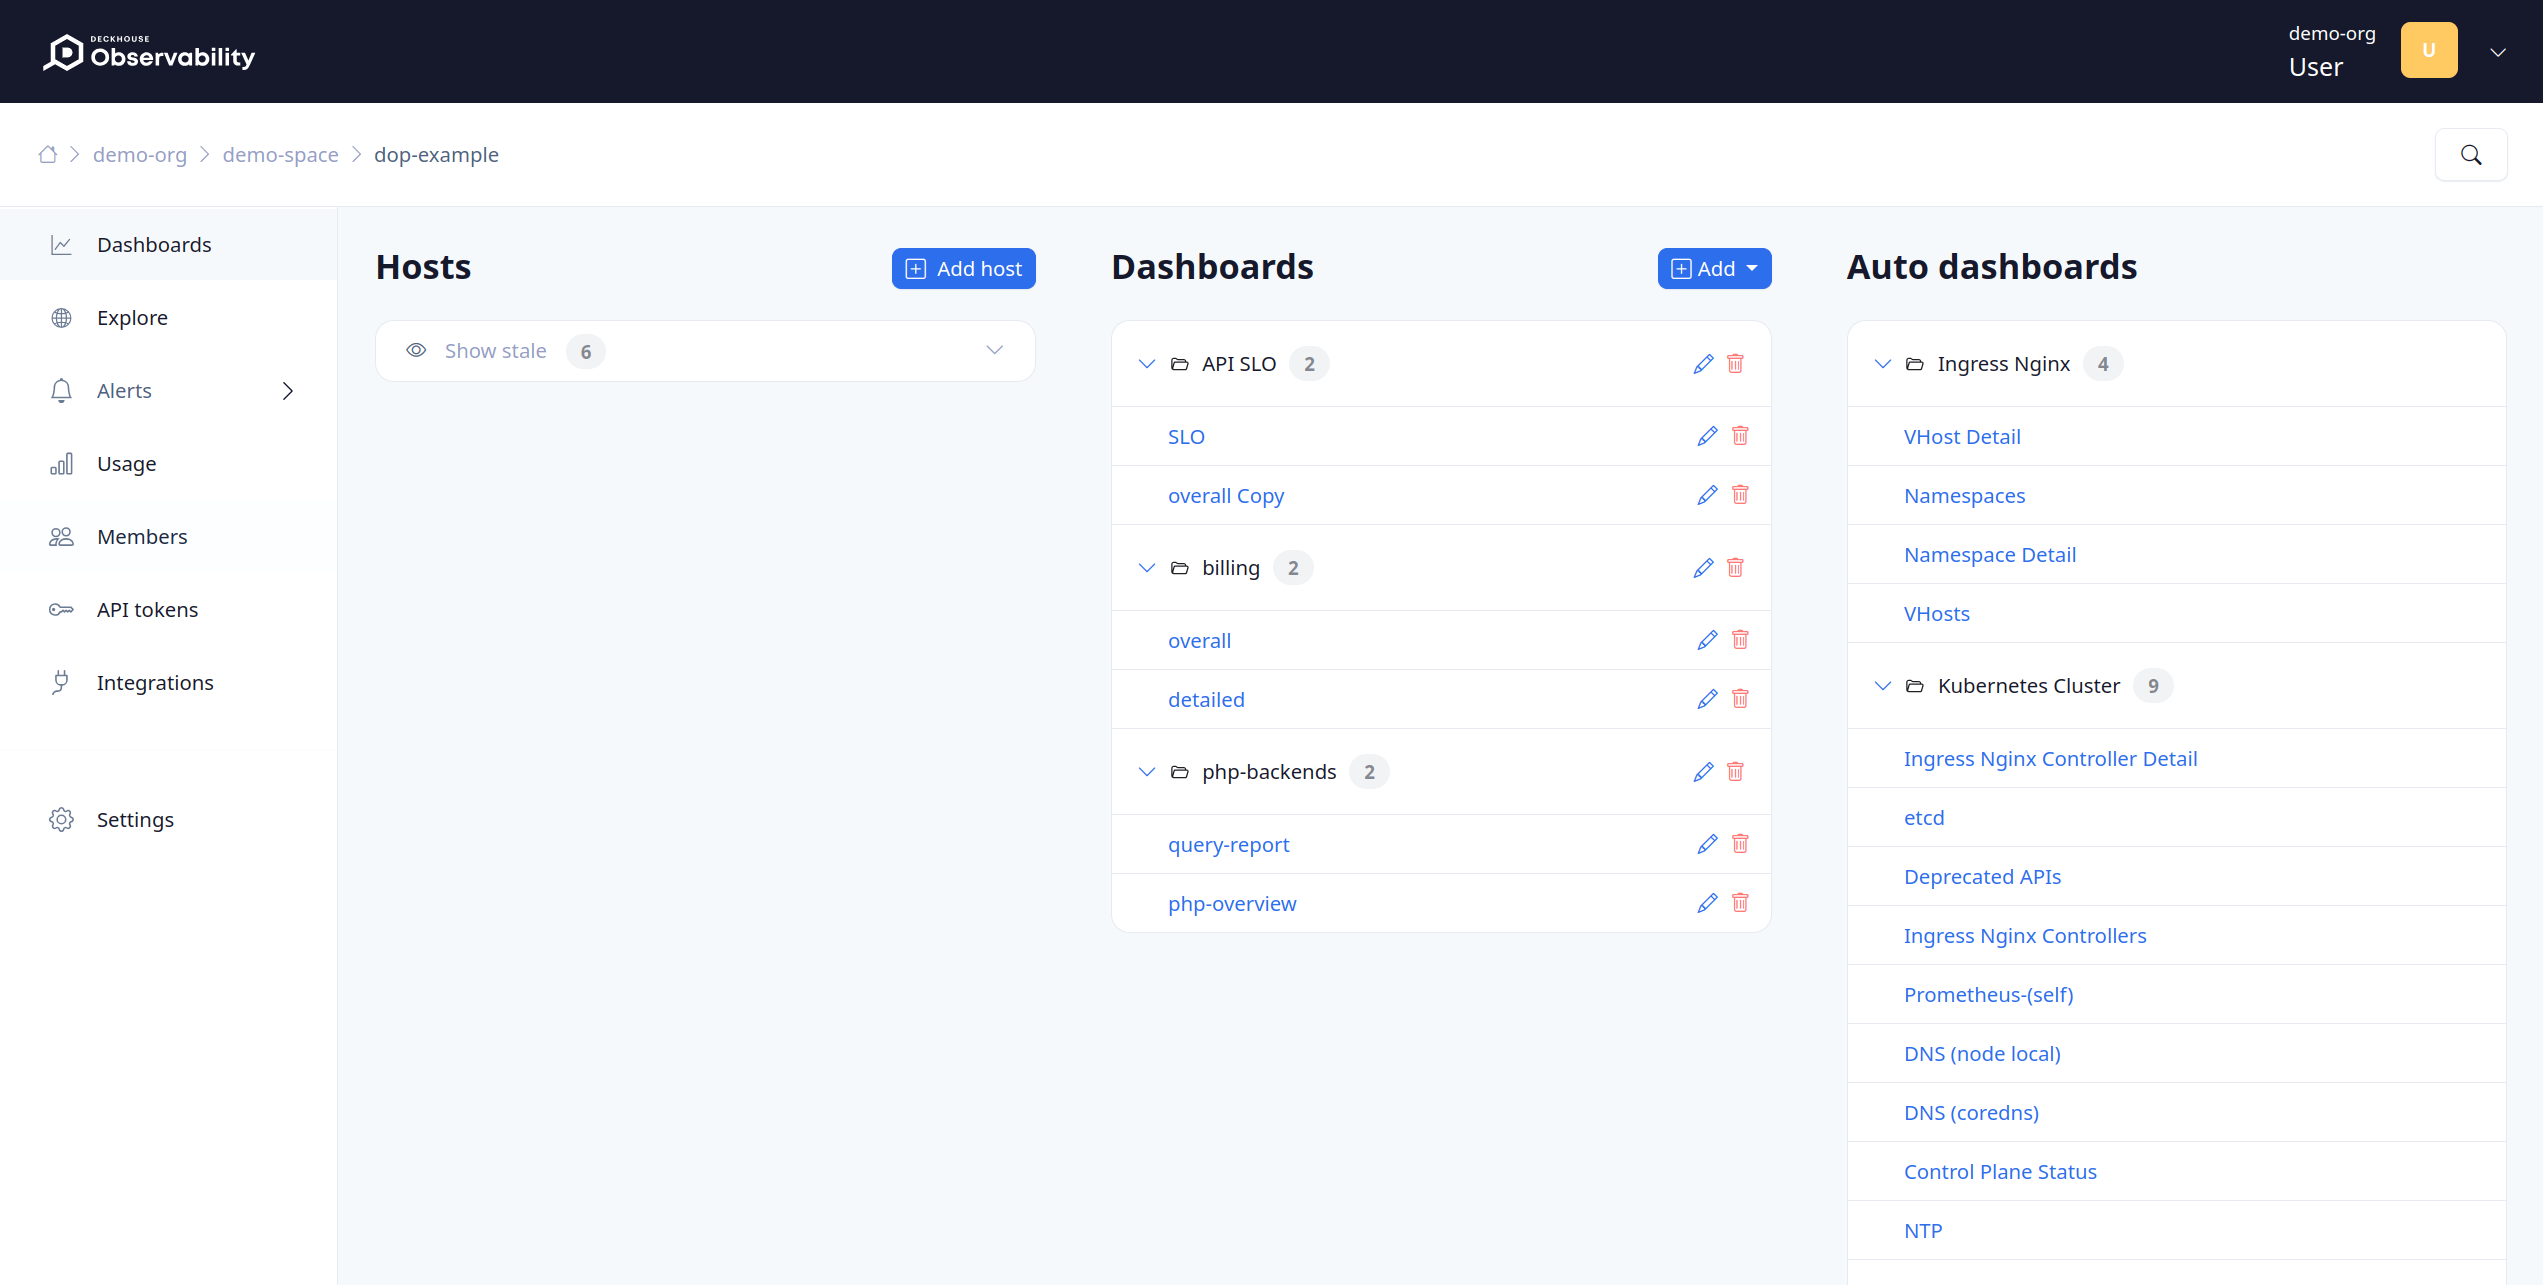
Out-of-the-box monitoring
Preconfigured dashboards and triggers: 99% of the time, no additional customization is required to commence infrastructure and application monitoring
Centralized storage
Long-term (5+ years) storage of metrics and logs in one place while preserving details; flexibility in setting access rights and limits; audit logs for all events
Automatic data collection
The monitoring agent automatically discovers and collects data across hardware, OS, and services such as databases, queue managers, and web servers
Low entry threshold
Compatibility with industry standards such as Grafana, Prometheus, Loki, and their PromQL/LogQL query languages greatly simplifies the adoption process
How it works

Set up metrics and logs streaming from your systems, set up agents

The interface automatically displays pre-built monitoring dashboards for detected services; the corresponding alerts get configured

Monitor all the metrics and logs coming into the system, create your own dashboards and triggers if needed

Restrict or grant access to data using a role-based model to ensure control and security

Monitor events in multi-cluster projects using the built-in Deckhouse Commander integration
Use cases

Observability for infrastructures with different kinds of Kubernetes clusters
Collect metrics and logs in an infrastructure that includes different kinds of Kubernetes clusters (Deckhouse Kubernetes Platform, vanilla Kubernetes, OpenShift, Rancher) in a single centralized repository

Observability for heterogeneous and distributed infrastructures
Collect metrics and logs from any Kubernetes cluster, as well as from nodes outside of Kubernetes clusters (e.g., databases running on virtual machines outside of the cluster) into a single centralized repository with minimal resource consumption

Application observability for Deckhouse Kubernetes Platform clusters
Collect metrics and logs and store them for a short time (e.g., 14 days) in a single centralized repository for an infrastructure that includes one or more Deckhouse Kubernetes Platform clusters. Sources of monitoring data can be both internal and external
Contact Us
+7 (495) 721-10-27
