Available with limitations in: EE
The module lifecycle stage: General Availability
The module has requirements for installation
Welcome to the home page of the Deckhouse Observability Platform documentation!
Deckhouse Observability Platform (DOP) is a centralized monitoring platform for collecting, storing, and analyzing metrics and logs from various sources.
Platform capabilities
The platform features the following capabilities:
- Collection of monitoring data (metrics, logs, and traces) via a unified centralized interface with the option of multi-year storage.
- User-friendly and intuitive interface for browsing monitoring data.
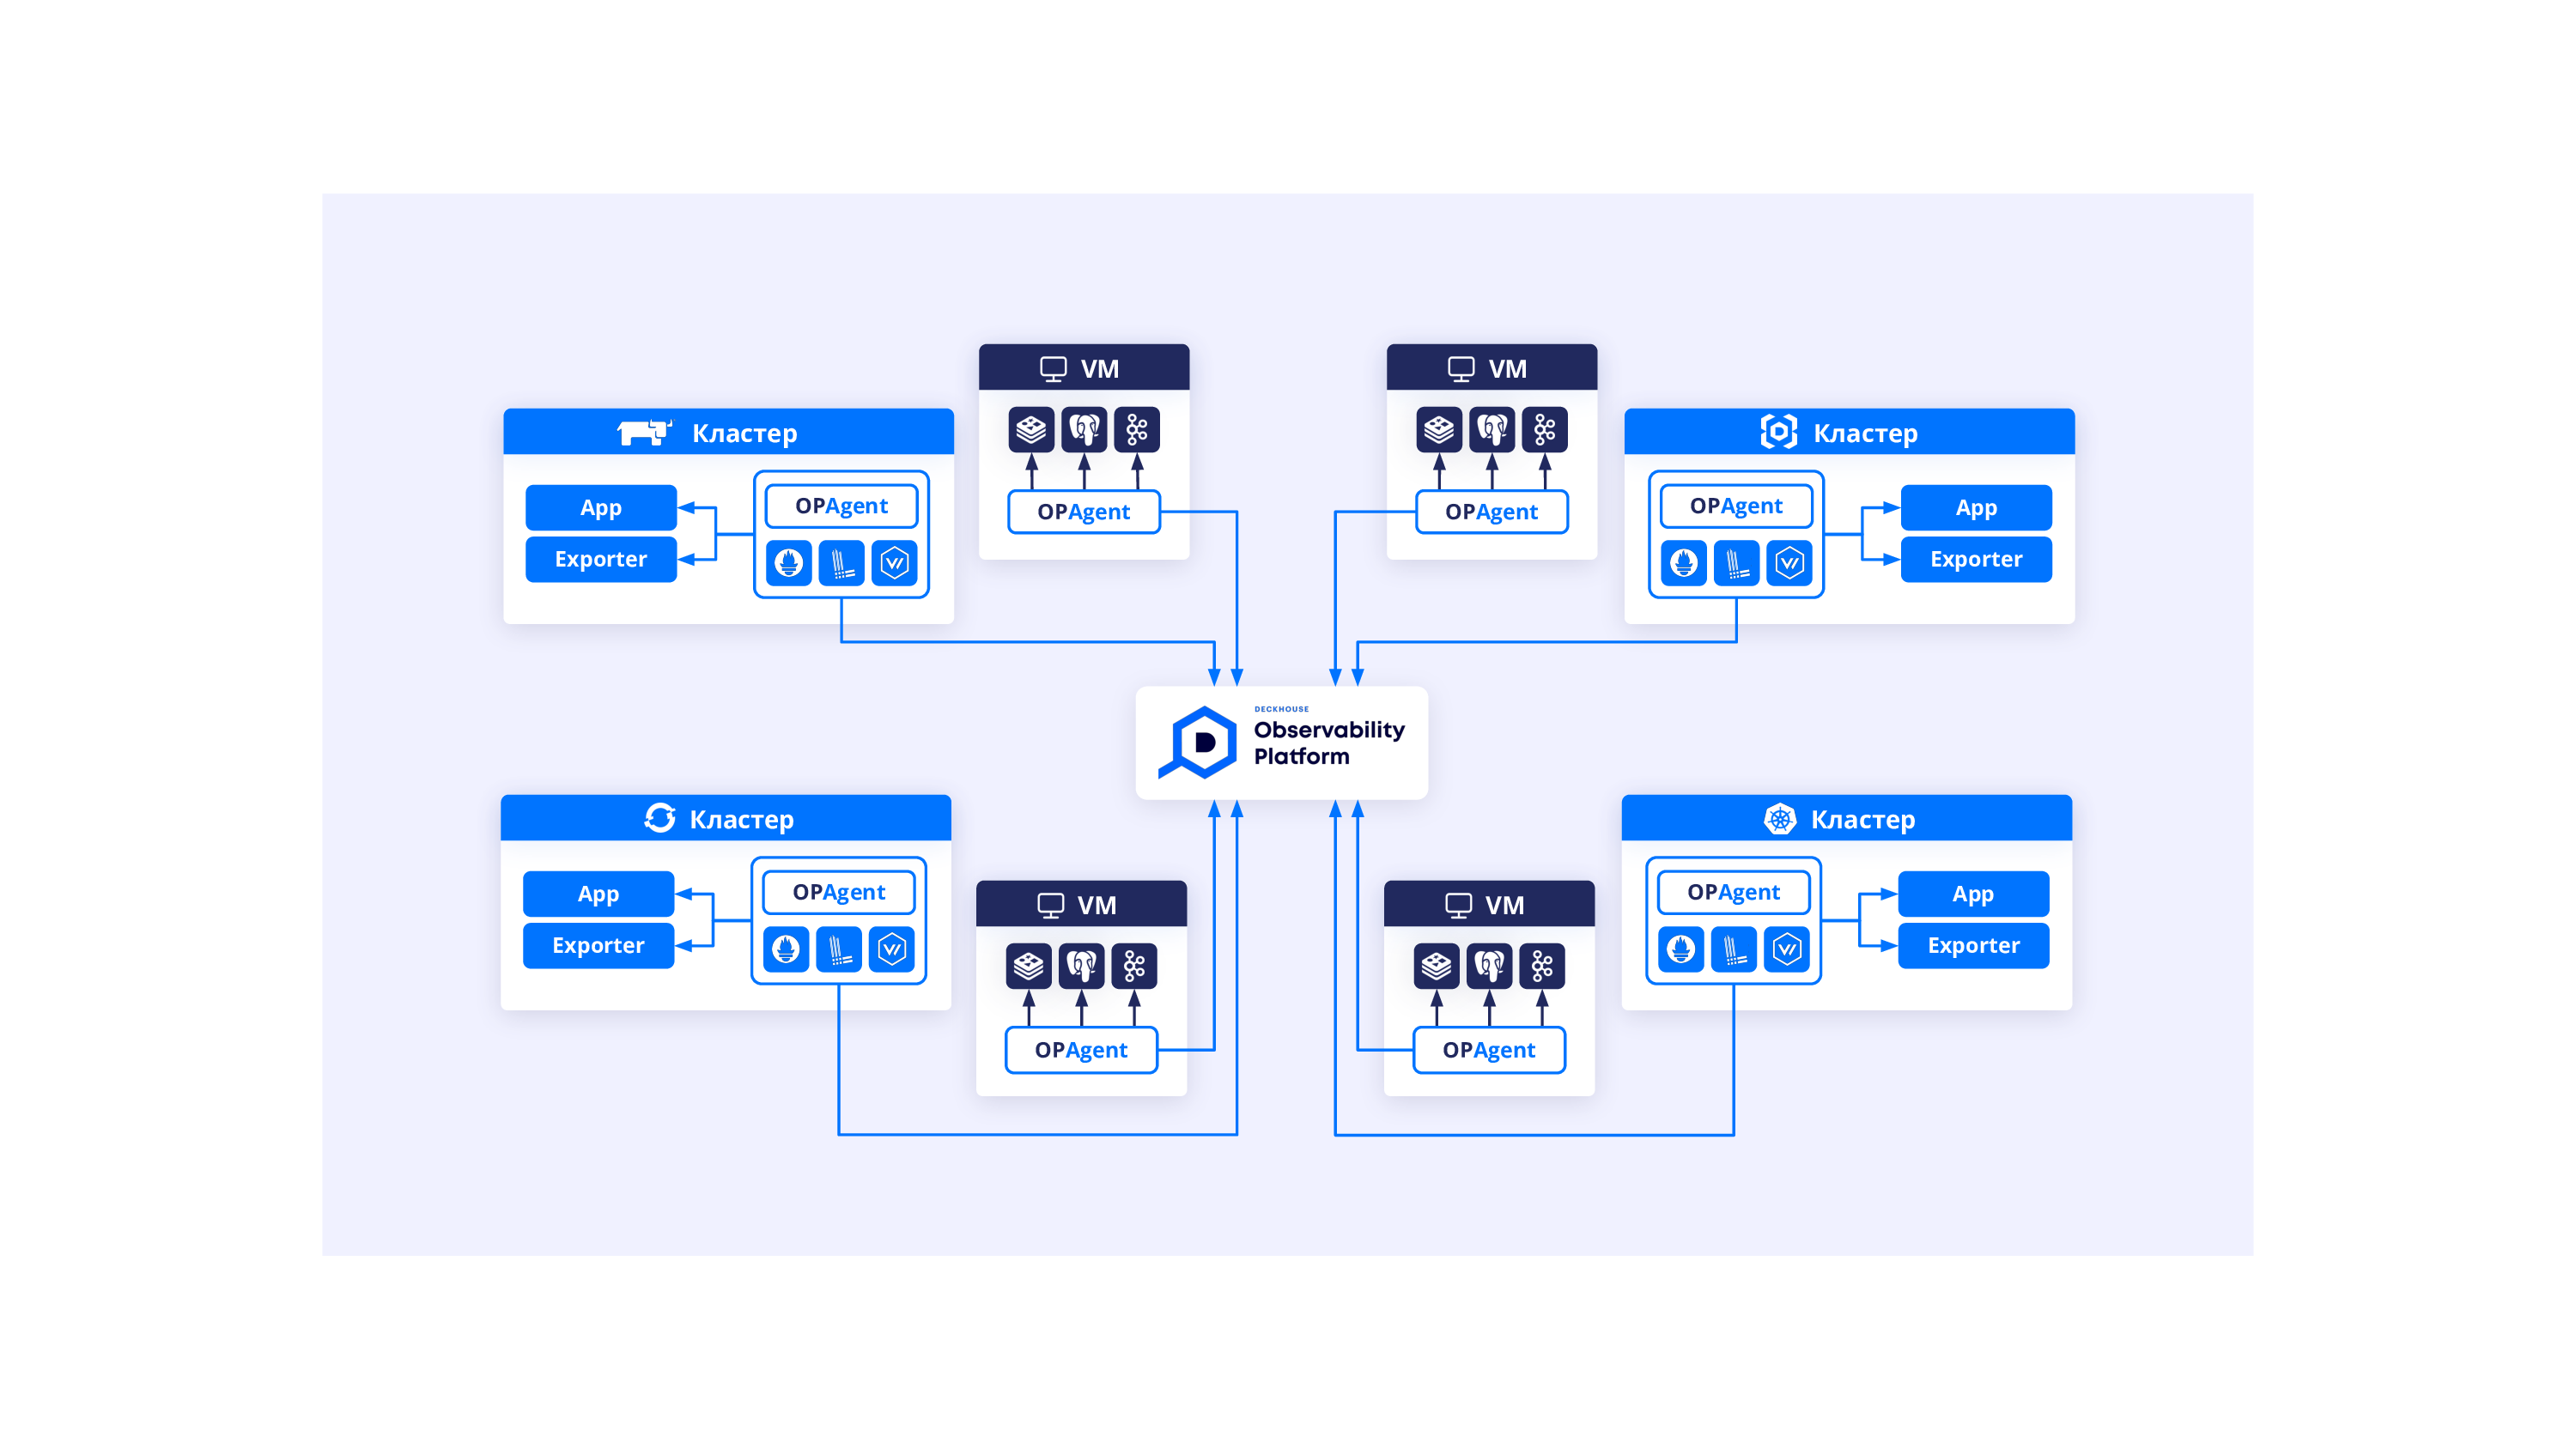
- Monitoring agent for servers with built-in integrations (i.e. they are automatically detected and put on monitoring) running common software, such as databases, queue managers, load balancers, etc.
- Ready-to-use dashboards and alerts for built-in integrations.
- Option to set up your own dashboards and alerts, as well as alert delivery channels.
- Notification center to browse through triggered alerts and their history.
- Flexible permissions system with role-based model and support for authentication using third-party systems.
Typical usage scenario

Platform’s key features
- Capable of storing hundreds of millions of unique, highly granular metrics.
- Long-term data retention (5 years or more).
- System for differentiating metric flows and access rights:
- Separation of metrics on a per-project basis — each project or service can push metrics to its own repository.
- Multi-project query mode — the option to make a query to display metrics from multiple projects at a time.
- Flexible permissions system:
- Role-based model for controlling user access to various system components and data.
- Support for authentication using third-party systems such as LDAP, OAuth2, and others.
- Storing metrics from any source that supports the Remote Write protocol (e.g., Prometheus, VictoriaMetrics, etc.), logs using Loki, and traces using OpenTelemetry (OTLP), Jaeger, and Zipkin protocols.
- Per-tenant statistics of storage resource utilization.
- Unified web interface:
- For handling graphs; supports the Grafana dashboard format.
- For working with alerts and triggers.
- For managing and customizing the platform.
- Notification center:
- Convenient handling of active alerts and their history.
- Filtering and sorting notifications based on multiple criteria.
- Option to temporarily disable alerts if necessary.
- Rapid response to changes in system state.
- Flexible dashboards and triggers setup with the option for common company-wide settings, allowing you to conveniently manage single-type dashboards and triggers while maintaining the flexibility to customize at the individual project level.
Agent’s key features
Description
Deckhouse Observability Platform Agent (hereinafter referred to as opAgent) is a statically built binary file written in Go language. As such, it can be run in any Linux-like operating system. opAgent supports x86_64 and ARM architectures.
opAgent is deployed in one command . It automatically starts collecting metrics from both the operating system and the application software installed on the servers. opAgent features more than 15 different integrations with application software, allowing it to automatically discover, connect to, and scrap key metrics from that software. In most cases, the opAgent does not require any configuration. However, in some cases, it needs to be granted appropriate permissions so that it can collect metrics (the system will notify you and prompt for commands to execute).
What opAgent can do
opAgent can collect basic server utilization metrics such as:
- CPU;
- Disk;
- RAM + SWAP;
- Network / Network connections (netstat);
- OS resources broken down by processes.
opAgent can automatically detect various applications installed on servers and set them to be monitored:
- PostgreSQL;
- PgBouncer;
- MySQL;
- MongoDB;
- Redis;
- Memcached;
- Cassandra;
- Elasticsearch;
- ZooKeeper;
- Kafka;
- Sphinx;
- RabbitMQ;
- Nginx;
- PHP-FPM;
- Java/JMX;
- Envoy.
opAgent can collect custom metrics in a wide range of ways:
- SQL-query — running SQL queries;
- Redis-query — running Redis queries;
- Exec — running the executable file and retrieving metrics from it;
- Logparser — parsing logs and converting log fields into metrics;
- HTTP-query — making HTTP requests to retrieve metrics;
- StatsD — StatsD server built into the agent for quick counter collection;
- Prometheus exporters — scraping metrics from any OpenMetrics-compatible exporters.