Composition and interaction scheme of monitoring components

Components installed by Deckhouse
| Component | Description |
|---|---|
| prometheus-operator | Deckhouse module responsible for running Prometheus in the cluster. |
| prometheus-main | Main Prometheus that performs scraping every 30 seconds (this value can be changed using the scrapeInterval parameter). It processes all rules, sends alerts and is the main source of data. |
| prometheus-longterm | Additional Prometheus that stores sparse data samples from the main prometheus-main |
| aggregating-proxy | Aggregating and caching proxy that combines main and longterm into one source. Helps avoid data gaps when one of the Prometheus instances is unavailable. |
| memcached | In-memory data caching service. |
| grafana | UI for displaying metrics in dashboard format. |
| metrics-adapter | Component that provides Kubernetes API for accessing metrics. Required for proper VPA operation. |
| Various exporters | Set of ready-made Prometheus exporters for all necessary metrics: kube-state-metrics, node-exporter, oomkill-exporter, image-availability-exporter. |
| upmeter | Module for assessing DVP component availability. |
| trickster | Caching proxy that reduces load on Prometheus. Will be deprecated in the near future. |
External components
Deckhouse can integrate with a large number of diverse solutions in the following ways:
| Name | Description |
|---|---|
| Alertmanagers | Alertmanagers can be connected to Prometheus and Grafana and be located both in the Deckhouse cluster and outside it. |
| Long-term metrics storages | Using the remote write protocol, it is possible to send metrics from Deckhouse to a large number of storages, including Cortex, Thanos, VictoriaMetrics. |
Prometheus
Prometheus collects metrics and executes rules:
- For each target (monitoring target) with a given periodicity
scrape_interval, Prometheus makes an HTTP request to this target, receives metrics in its own format in response and saves them to its database. - Each
evaluation_intervalprocesses rules (rules), based on which:- sends alerts;
- or saves new metrics (result of rule execution) to its database.
Prometheus is installed by the prometheus-operator DVP module, which performs the following functions:
- defines the following custom resources:
Prometheus: Defines the installation (cluster) of Prometheus.ServiceMonitor: Defines how to collect metrics from services.Alertmanager: Defines the cluster of Alertmanagers.PrometheusRule: Defines the list of Prometheus rules.
- monitors these resources, and also:
- generates
StatefulSetwith Prometheus itself; - creates secrets with configuration files necessary for Prometheus operation (
prometheus.yaml— Prometheus configuration, andconfigmaps.json— configuration forprometheus-config-reloader); - monitors
ServiceMonitorandPrometheusRuleresources and updates Prometheus configuration files based on them by making changes to secrets.
- generates
What’s in the Prometheus pod?
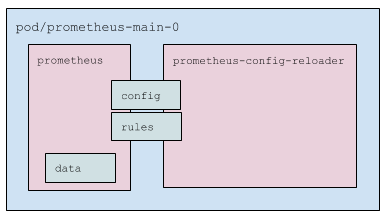
- Two containers:
prometheus: Prometheus itself.prometheus-config-reloader: Wrapper that:- Monitors changes to
prometheus.yamland, if necessary, calls Prometheus configuration reload (via special HTTP request, see more details below). - Monitors PrometheusRules (see more details below) and downloads them and restarts Prometheus as needed.
- Monitors changes to
- Pod uses three volumes:
- Config: mounted secret (two files:
prometheus.yamlandconfigmaps.json). Connected to both containers; - Rules:
emptyDir, which is filled byprometheus-config-reloaderand read byprometheus. Connected to both containers, but inprometheusin read-only mode; - Dat0a: Prometheus data. Mounted only in
prometheus.
- Config: mounted secret (two files:
How is Prometheus configured?
- Prometheus server has config and rule files (files with rules);
- The
confighas the following sections.scrape_configs: Settings for finding targets (monitoring targets, see more details in the next section).-
rule_files: List of directories where rules that need to be loaded are located:rule_files: - /etc/prometheus/rules/rules-0/* - /etc/prometheus/rules/rules-1/* alerting: Settings for finding Alert Managers to send alerts to. This section is very similar toscrape_configs, only the result of its work is a list of endpoints that Prometheus will send alerts to.
Where does Prometheus get the list of targets?
-
In general, Prometheus works as follows:
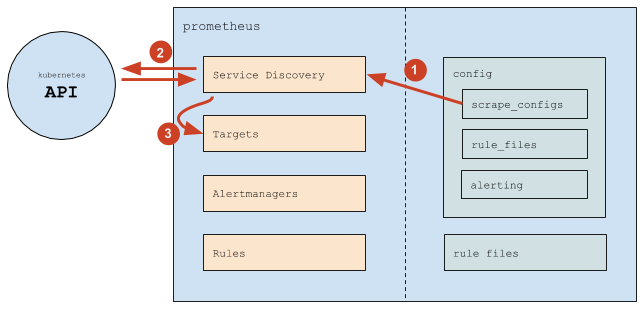
- (1) Prometheus reads the
scrape_configssection of the config, according to which it configures its internal Service Discovery mechanism. - (2) The Service Discovery mechanism interacts with the Kubernetes API (mainly — gets endpoints).
- (3) Based on what happens in Kubernetes, the Service Discovery mechanism updates Targets (list of targets).
- (1) Prometheus reads the
-
In
scrape_configsa list of scrape jobs (internal Prometheus concept) is specified, each of which is defined as follows:scrape_configs: # General settings - job_name: d8-monitoring/custom/0 # just the name of the scrape job, shown in the Service Discovery section scrape_interval: 30s # how often to collect data scrape_timeout: 10s # request timeout metrics_path: /metrics # path to request scheme: http # http or https # Service discovery settings kubernetes_sd_configs: # means that targets are obtained from Kubernetes - api_server: null # means to use the API server address from environment variables (which are in every Pod) role: endpoints # take targets from endpoints namespaces: names: # search for endpoints only in these namespaces - foo - baz # "Filtering" settings (which endpoints to take and which not) and "relabeling" (which labels to add or remove, on all received metrics) relabel_configs: # Filter by the value of the prometheus_custom_target label (obtained from the service associated with the endpoint) - source_labels: [__meta_kubernetes_service_label_prometheus_custom_target] regex: .+ # matches any NON-empty label action: keep # Filter by port name - source_labels: [__meta_kubernetes_endpointslice_port_name] regex: http-metrics # matches only if the port is called http-metrics action: keep # Add job label, use the value of the prometheus_custom_target label of the service, to which we add the "custom-" prefix # # The job label is a Prometheus service label: # * it determines the name of the group in which the target will be shown on the targets page # * and of course it will be on every metric obtained from these targets, so you can conveniently filter in rules and dashboards - source_labels: [__meta_kubernetes_service_label_prometheus_custom_target] regex: (.*) target_label: job replacement: custom-$1 action: replace # Add namespace label - source_labels: [__meta_kubernetes_namespace] regex: (.*) target_label: namespace replacement: $1 action: replace # Add service label - source_labels: [__meta_kubernetes_service_name] regex: (.*) target_label: service replacement: $1 action: replace # Add instance label (which will contain the Pod name) - source_labels: [__meta_kubernetes_pod_name] regex: (.*) target_label: instance replacement: $1 action: replace - Thus, Prometheus itself tracks:
- Addition and removal of Pods (when Pods are added/removed, Kubernetes changes endpoints, and Prometheus sees this and adds/removes targets).
- Addition and removal of services (more precisely endpoints) in the specified namespaces.
- Config changes are required in the following cases:
- Need to add a new scrape config (usually — a new type of services that need to be monitored).
- Need to change the list of namespaces.
How are Service Monitors processed?
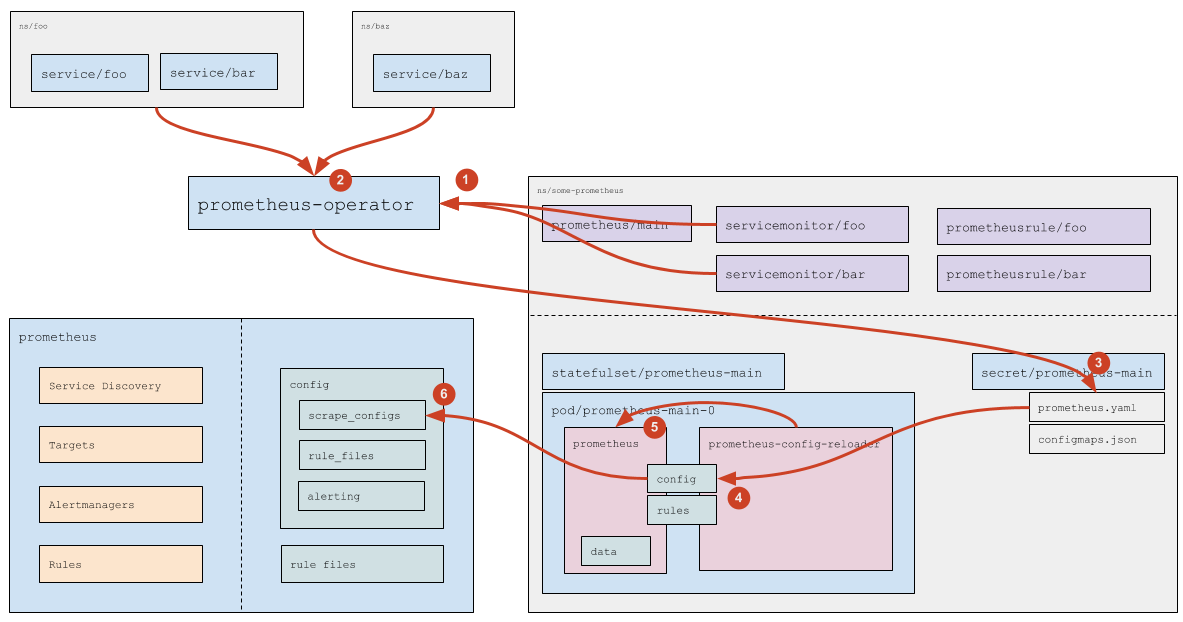
- Prometheus Operator reads (and also monitors addition/removal/changes) Service Monitors (which specific Service Monitors — specified in the
prometheusresource itself, see more details in the official documentation). - For each Service Monitor, if it does NOT specify a specific list of namespaces (specified
any: true), Prometheus Operator calculates (by accessing the Kubernetes API) a list of namespaces where there are Services (matching the labels specified in the Service Monitor). - Based on the read
servicemonitorresources (see official documentation) and based on the calculated namespaces, Prometheus Operator generates part of the config (thescrape_configssection) and saves the config to the corresponding Secret. - Using standard Kubernetes means, data from the secret comes to the Pod (the
prometheus.yamlfile is updated). - The
prometheus-config-reloadernotices the file change and sends an HTTP request to Prometheus to reload. - Prometheus re-reads the config and sees changes in scrape_configs, which it processes according to its own logic (see more details above).
How are custom resources with rules processed?
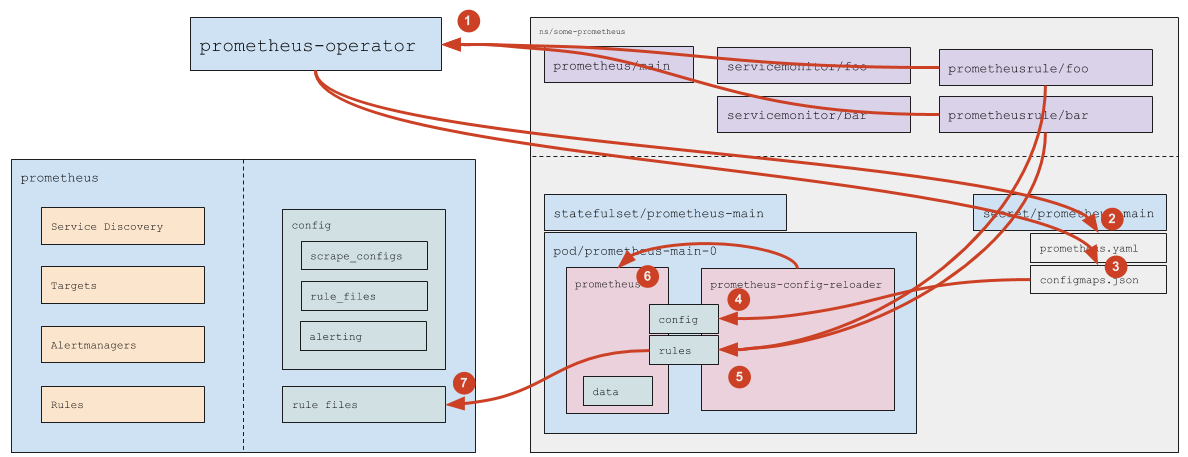
- Prometheus Operator monitors PrometheusRules (matching the
ruleSelectorspecified in theprometheusresource). - If a new PrometheusRule appears (or an existing one is removed) — Prometheus Operator updates
prometheus.yaml(and then the logic exactly corresponding to Service Monitor processing, which is described above, is triggered). - Both in case of adding/removing PrometheusRule and when changing the content of PrometheusRule, Prometheus Operator updates the ConfigMap
prometheus-main-rulefiles-0. - Using standard Kubernetes means, data from ConfigMap comes to the Pod
- The
prometheus-config-reloadernotices the file change and:- Downloads the changed ConfigMaps to the rules directory (this is
emptyDir). - Sends an HTTP request to Prometheus to reload.
- Downloads the changed ConfigMaps to the rules directory (this is
- Prometheus re-reads the config and sees the changed rules.
Architecture of DVP component availability assessment (upmeter)
Availability assessment in DVP is performed by the upmeter module.
Composition of the upmeter module:
- agent: Works on master nodes and performs availability probes, sends results to the server.
- upmeter: Collects results and maintains an API server for their extraction.
- front:
- status: Shows availability level for the last 10 minutes (requires authorization, but it can be disabled).
- webui: Shows a dashboard with statistics on probes and availability groups (requires authorization).
- smoke-mini: Maintains constant smoke testing using StatefulSet.
The module sends about 100 metric readings every 5 minutes. This value depends on the number of enabled Deckhouse Virtualization Platform modules.