Available in editions: CE, BE, SE, SE+, EE
Web interfaces associated with the module: status, upmeter
The module tests the availability of the platform and the status of cluster components in real time, and outputs information in the form of corresponding dashboards.
Module features:
- continuous testing scenarios have been developed for all major cluster components;
- the test results are saved as metrics;
- displays a dashboard showing the functionality of the components;
- the data can be exported to any external Prometheus-compatible monitoring system.
Module composition:
- agent — runs on master nodes, performs availability tests, and sends results to the server.
- upmeter — collects results and supports an API server to retrieve them.
- front
- status — shows the availability level for the last 10 minutes (requires authorization, but it can be disabled);
- webui — shows a dashboard with statistics on probes and availability groups (requires authorization).
- smoke-mini — supports continuous smoke testing using StatefulSet.
The module sends about 100 metric readings every 5 minutes. This figure depends on the number of Deckhouse Kubernetes Platform modules enabled.
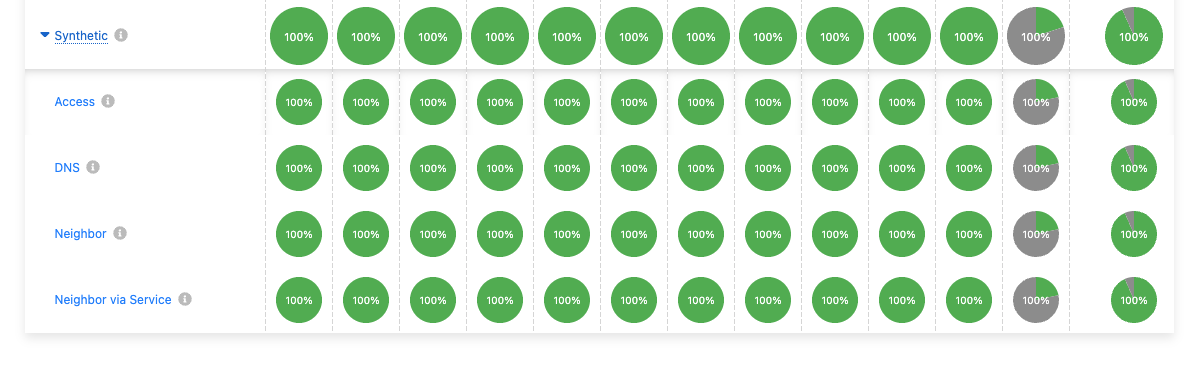
Interface
Example of a web interface:
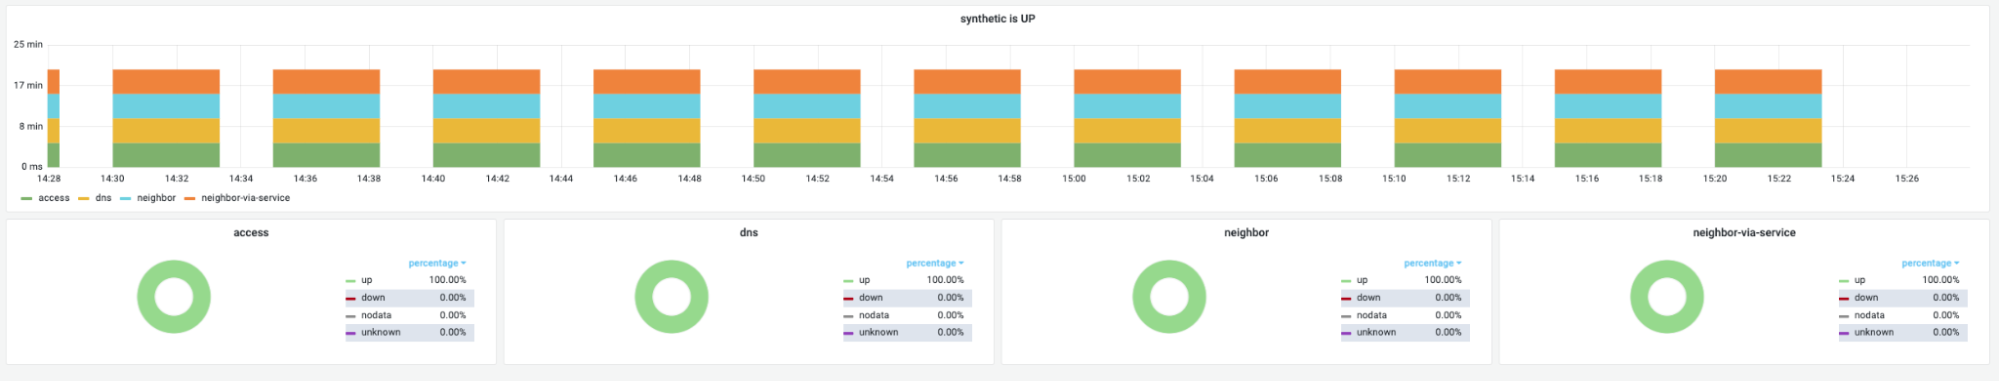
Example of Grafana plots based on upmeter metrics: