The module lifecycle stage: General Availability
The module has requirements for installation
An example of the module configuration
apiVersion: deckhouse.io/v1alpha1
kind: ModuleConfig
metadata:
  name: prometheus
spec:
  version: 2
  enabled: true
  settings:
    auth:
      password: xxxxxx
    retentionDays: 7
    storageClass: rbd
    nodeSelector:
      node-role/monitoring: ""
    tolerations:
    - key: dedicated.deckhouse.io
      operator: Equal
      value: monitoring
Writing Prometheus data to the longterm storage
Prometheus supports remote_write’ing data from the local Prometheus to a separate longterm storage (e.g., VictoriaMetrics). In Deckhouse, this mechanism is implemented using the PrometheusRemoteWrite custom resource.
For VictoriaMetrics detailed information about how to send data to vmagent can be found in the VictoriaMetrics documentation.
Example of the basic PrometheusRemoteWrite
apiVersion: deckhouse.io/v1
kind: PrometheusRemoteWrite
metadata:
  name: test-remote-write
spec:
  url: https://victoriametrics-test.domain.com/api/v1/write
Example of the expanded PrometheusRemoteWrite
apiVersion: deckhouse.io/v1
kind: PrometheusRemoteWrite
metadata:
  name: test-remote-write
spec:
  url: https://victoriametrics-test.domain.com/api/v1/write
  basicAuth:
    username: username
    password: password
  writeRelabelConfigs:
  - sourceLabels: [__name__]
    action: keep
    regex: prometheus_build_.*|my_cool_app_metrics_.*
  - sourceLabels: [__name__]
    action: drop
    regex: my_cool_app_metrics_with_sensitive_data
Connecting Prometheus to an external Grafana instance
Each ingress-nginx-controller has certificates that can be used to connect to Prometheus. All you need is to create an additional Ingress resource.
For the example below, it is presumed that Secret example-com-tls already exist in namespace d8-monitoring.
Names for Ingress my-prometheus-api and Secret my-basic-auth-secret are there for example. Change them to the most suitable names for your case.
apiVersion: networking.k8s.io/v1
kind: Ingress
metadata:
  name: my-prometheus-api
  namespace: d8-monitoring
  annotations:
    nginx.ingress.kubernetes.io/backend-protocol: HTTPS
    nginx.ingress.kubernetes.io/auth-type: basic
    nginx.ingress.kubernetes.io/auth-secret: my-basic-auth-secret
    nginx.ingress.kubernetes.io/app-root: /graph
    nginx.ingress.kubernetes.io/configuration-snippet: |
      proxy_ssl_certificate /etc/nginx/ssl/client.crt;
      proxy_ssl_certificate_key /etc/nginx/ssl/client.key;
      proxy_ssl_protocols TLSv1.2;
      proxy_ssl_session_reuse on;
spec:
  ingressClassName: nginx
  rules:
  - host: prometheus-api.example.com
    http:
      paths:
      - backend:
          service:
            name: prometheus
            port:
              name: https
        path: /
        pathType: ImplementationSpecific
  tls:
  - hosts:
    - prometheus-api.example.com
    secretName: example-com-tls
---
apiVersion: v1
kind: Secret
metadata:
  name: my-basic-auth-secret
  namespace: d8-monitoring
type: Opaque
data:
  # Basic-auth string is hashed using htpasswd.
  auth: Zm9vOiRhcHIxJE9GRzNYeWJwJGNrTDBGSERBa29YWUlsSDkuY3lzVDAK  # foo:bar
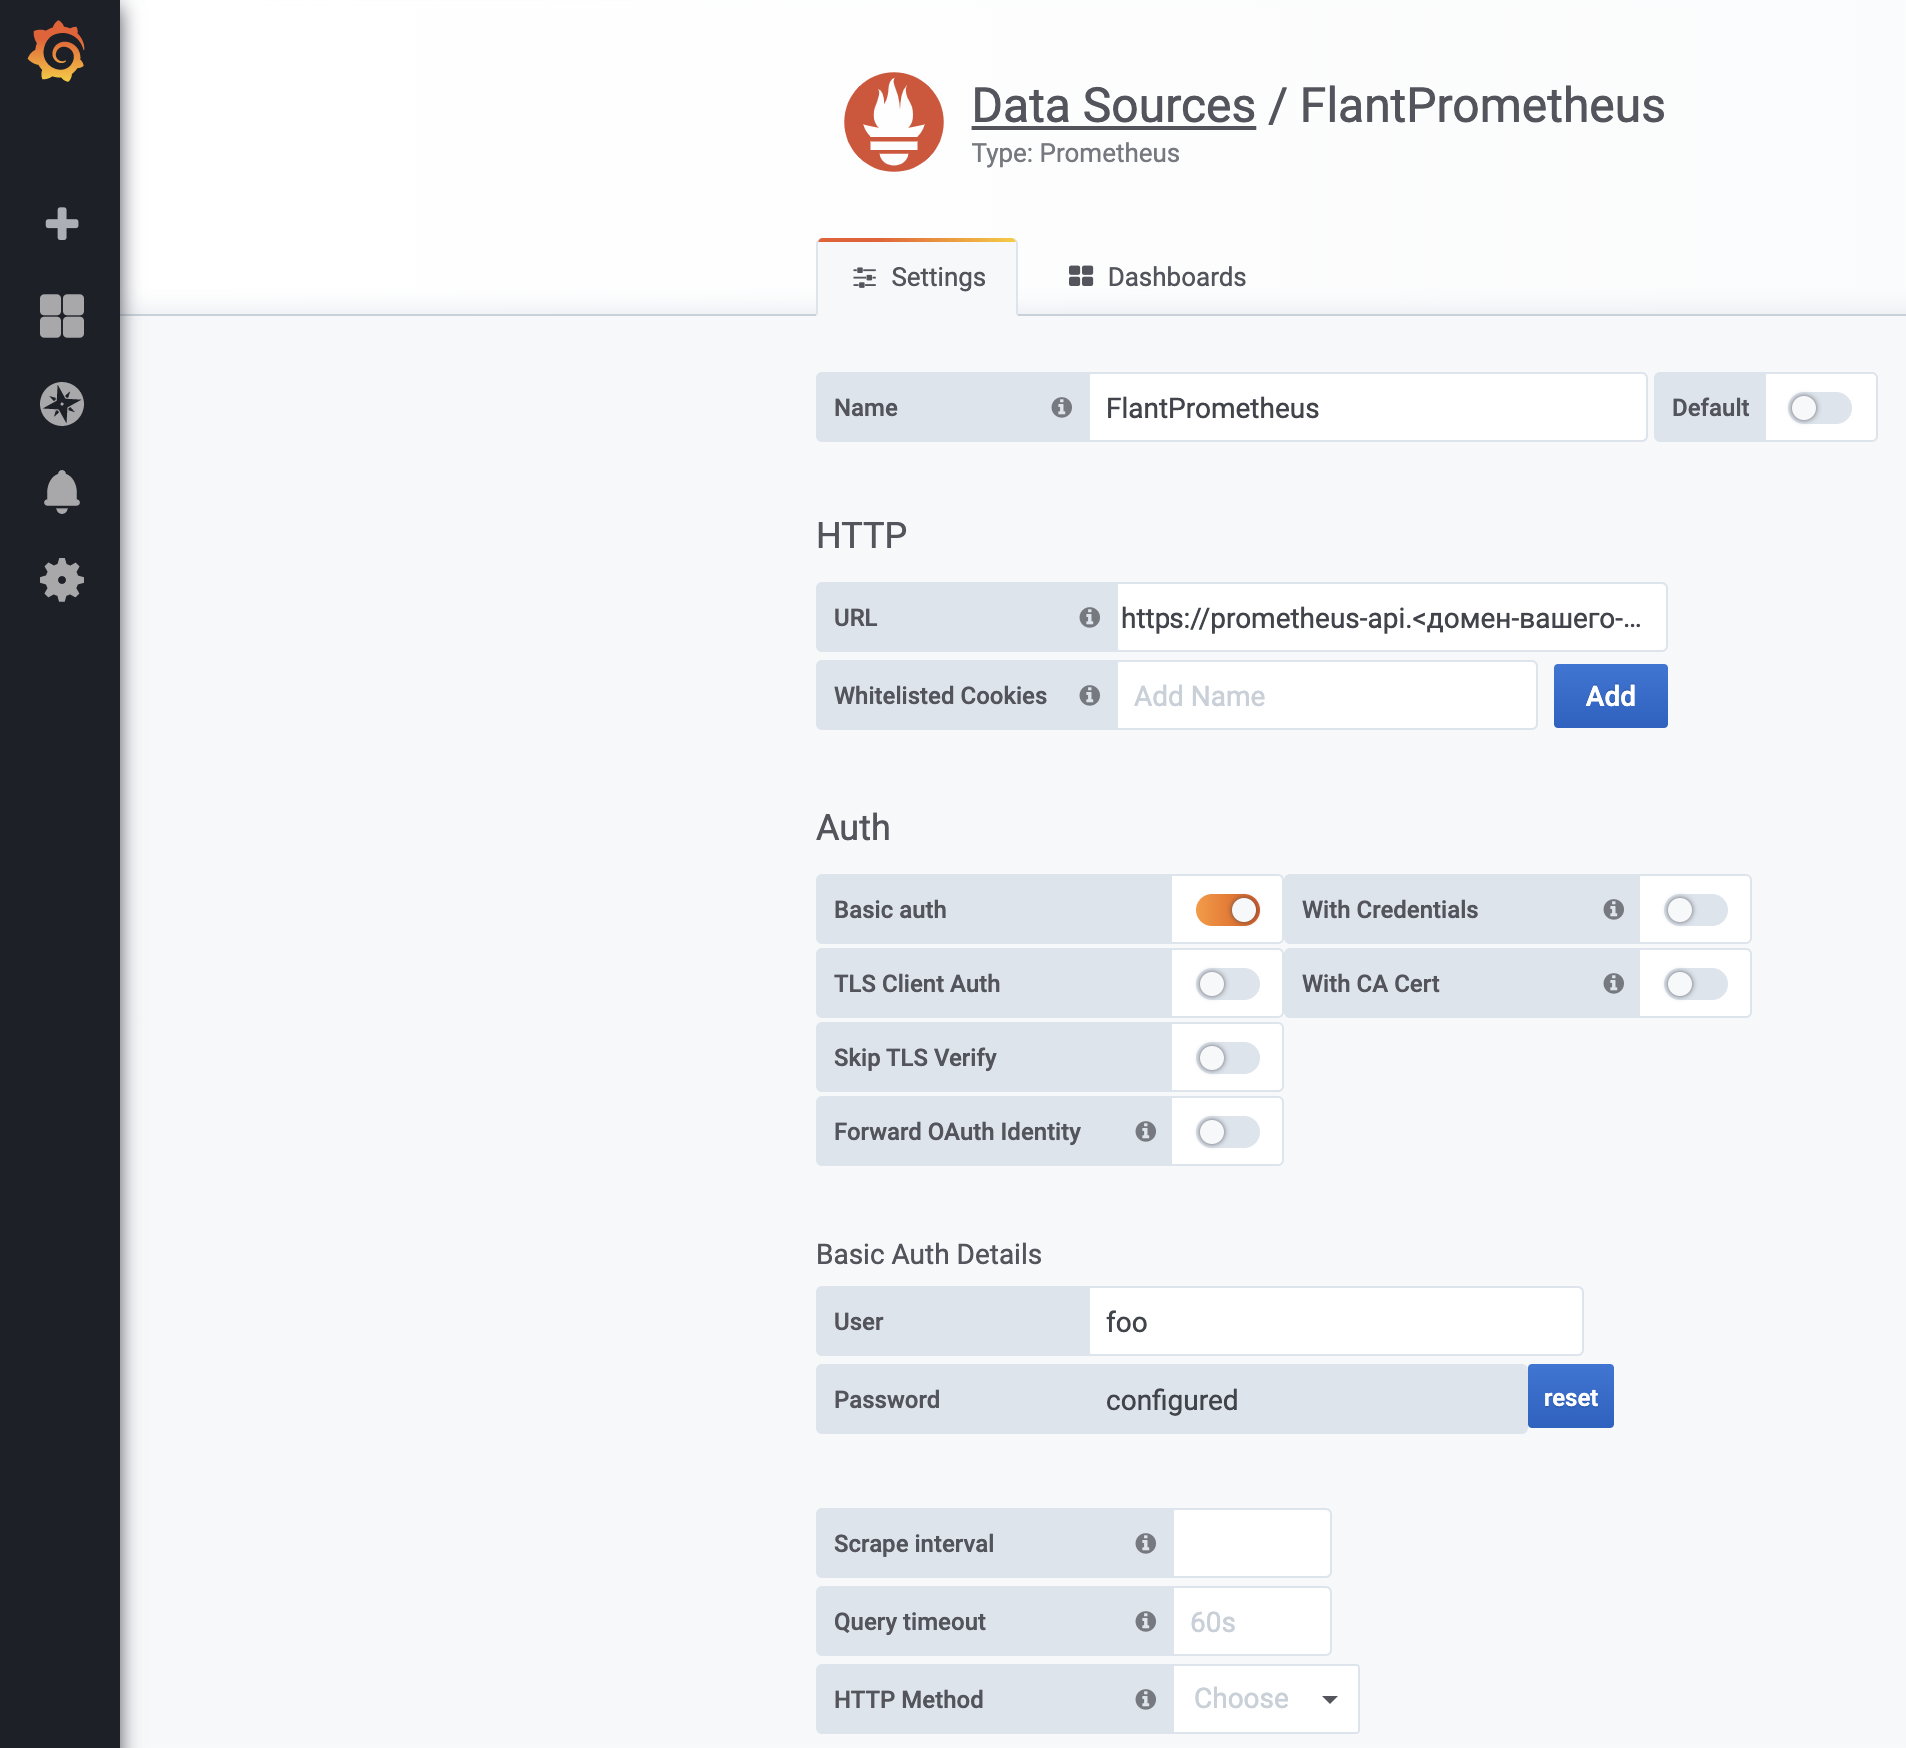
Next, you only need to add the data source to Grafana:
Specify https://prometheus-api.<cluster-domain> as the URL.
-
Note that basic authorization is not sufficiently secure and safe. You are encouraged to implement additional safety measures, e.g., attach the
nginx.ingress.kubernetes.io/whitelist-source-rangeannotation. -
It is not recommended connecting this way since you have to create an Ingress resource in the system namespace. Deckhouse does not guarantee the functionality of this connection method due to its regular updates.
-
This Ingress resource can be used to access the Prometheus API not only from Grafana but for other integrations, e.g., the Prometheus federation.
Connecting an external app to Prometheus
The connection to Prometheus is protected using kube-rbac-proxy. To connect, you need to create a ServiceAccount with the necessary permissions.
---
apiVersion: v1
kind: ServiceAccount
metadata:
  name: app
  namespace: default
---
apiVersion: rbac.authorization.k8s.io/v1
kind: ClusterRole
metadata:
  name: app:prometheus-access
rules:
- apiGroups: ["monitoring.coreos.com"]
  resources: ["prometheuses/http"]
  resourceNames: ["main", "longterm"]
  verbs: ["get"]
---
apiVersion: rbac.authorization.k8s.io/v1
kind: ClusterRoleBinding
metadata:
  name: app:prometheus-access
roleRef:
  apiGroup: rbac.authorization.k8s.io
  kind: ClusterRole
  name: app:prometheus-access
subjects:
- kind: ServiceAccount
  name: app
  namespace: default
Define the following job containing the curl request:
apiVersion: batch/v1
kind: Job
metadata:
  name: app-curl
  namespace: default
spec:
  template:
    metadata:
      name: app-curl
    spec:
      serviceAccountName: app
      containers:
      - name: app-curl
        image: curlimages/curl:7.69.1
        command: ["sh", "-c"]
        args:
        - >-
          curl -H "Authorization: Bearer $(cat /var/run/secrets/kubernetes.io/serviceaccount/token)" -k -f
          https://prometheus.d8-monitoring:9090/api/v1/query_range?query=up\&start=1584001500\&end=1584023100\&step=30
      restartPolicy: Never
  backoffLimit: 4
The job must complete successfully.
Sending alerts to Telegram
Alertmanager supports sending alerts to Telegram directly.
Create the Secret in the d8-monitoring namespace:
apiVersion: v1
kind: Secret
metadata:
  name: telegram-bot-secret
  namespace: d8-monitoring
stringData:
  token: "562696849:AAExcuJ8H6z4pTlPuocbrXXXXXXXXXXXx"
Deploy CustomAlertManager CR:
apiVersion: deckhouse.io/v1alpha1
kind: CustomAlertmanager
metadata:
  name: telegram
spec:
  type: Internal
  internal:
    receivers:
      - name: telegram
        telegramConfigs:
          - botToken:
              name: telegram-bot-secret
              key: token
            chatID: -30490XXXXX
    route:
      groupBy:
        - job
      groupInterval: 5m
      groupWait: 30s
      receiver: telegram
      repeatInterval: 12h
The fields token in the Secret and chatID in the CustomAlertmanager custom resource must be set on your own. Read more about Telegram API.
Example of sending alerts to Slack with a filter
apiVersion: deckhouse.io/v1alpha1
kind: CustomAlertmanager
metadata:
  name: slack
spec:
  internal:
    receivers:
    - name: devnull
    - name: slack
      slackConfigs:
      - apiURL:
          key: apiURL
          name: slack-apiurl
        channel: {{ dig .Values.werf.env .Values.slack.channel._default .Values.slack.channel }}
        fields:
        - short: true
          title: Severity
          value: '{{`{{  .CommonLabels.severity_level }}`}}'
        - short: true
          title: Status
          value: '{{`{{ .Status }}`}}'
        - title: Summary
          value: '{{`{{ range .Alerts }}`}}{{`{{ .Annotations.summary }}`}} {{`{{ end }}`}}'
        - title: Description
          value: '{{`{{ range .Alerts }}`}}{{`{{ .Annotations.description }}`}} {{`{{ end }}`}}'
        - title: Labels
          value: '{{`{{ range .Alerts }}`}} {{`{{ range .Labels.SortedPairs }}`}}{{`{{ printf "%s:
            %s\n" .Name .Value }}`}}{{`{{ end }}`}}{{`{{ end }}`}}'
        - title: Links
          value: '{{`{{ (index .Alerts 0).GeneratorURL }}`}}'
        title: '{{`{{ .CommonLabels.alertname }}`}}'
    route:
      groupBy:
      - '...'
      receiver: devnull
      routes:
        - matchers:
          - matchType: =~
            name: severity_level
            value: "^[4-9]$"
          receiver: slack
      repeatInterval: 12h
  type: Internal
Example of sending alerts to Opsgenie
- name: opsgenie
        opsgenieConfigs:
          - apiKey:
              key: data
              name: opsgenie
            description: |
              {{ range .Alerts }}{{ .Annotations.summary }} {{ end }}
              {{ range .Alerts }}{{ .Annotations.description }} {{ end }}
            message: '{{ .CommonLabels.alertname }}'
            priority: P1
            responders:
              - id: team_id
                type: team
Example of sending alert by Email
Create a Secret with base64 encoded password for email account as value of password:
apiVersion: v1
kind: Secret
metadata:
  name: am-mail-server-pass
  namespace: d8-monitoring
data:
  password: BASE64_ENCODED_PASSWORD_HERE
Change values in CustomAlertManager manifest as you need and apply the resource:
apiVersion: deckhouse.io/v1alpha1
kind: CustomAlertmanager
metadata:
  name: mail
spec:
  type: Internal
  internal:
    receivers:
      - name: devnull
      - name: mail
        emailConfigs:
          - to: oncall@example.com
            from: prom@example.com
            smarthost: mx.example.com:587
            authIdentity: prom@example.com
            authUsername: prom@example.com
            authPassword:
              key: password
              name: am-mail-server-pass
            # In case you have custom TLS certificates, you can put public part of your CA in a ConfigMap and deploy it in d8-monitoring namespace
            # tlsConfig:
            #   insecureSkipVerify: true
            #   ca:
            #     configMap:
            #       key: ca.pem
            #       name: alertmanager-mail-server-ca
            sendResolved: true
            requireTLS: true
    route:
      groupBy:
        - job
      groupInterval: 5m
      groupWait: 30s
      receiver: devnull
      repeatInterval: 24h
      routes:
        - matchers:
          - matchType: =~
            name: severity_level
            value: "^[1-4]$"
          receiver: mail