Available in: CE, BE, SE, SE+, EE
The module lifecycle stage: General Availability
The module has requirements for installation
The module tests the availability of the platform and the status of cluster components in real time, and outputs information in the form of corresponding dashboards.
Module features:
- continuous testing scenarios have been developed for all major cluster components;
- the test results are saved as metrics;
- displays a dashboard showing the functionality of the components;
- the data can be exported to any external Prometheus-compatible monitoring system.
Module composition:
- agent — runs on master nodes, performs availability tests, and sends results to the server.
- upmeter — collects results and supports an API server to retrieve them.
- front
- status — shows the availability level for the last 10 minutes (requires authorization, but it can be disabled);
- webui — shows a dashboard with statistics on probes and availability groups (requires authorization).
- smoke-mini — supports continuous smoke testing using StatefulSet.
The module sends about 100 metric readings every 5 minutes. This figure depends on the number of Deckhouse Kubernetes Platform modules enabled.
Interface
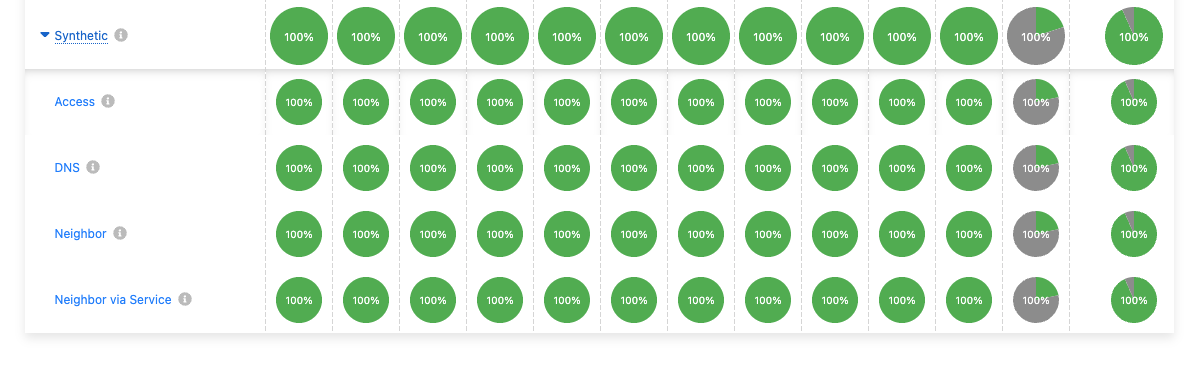
Example of a web interface:
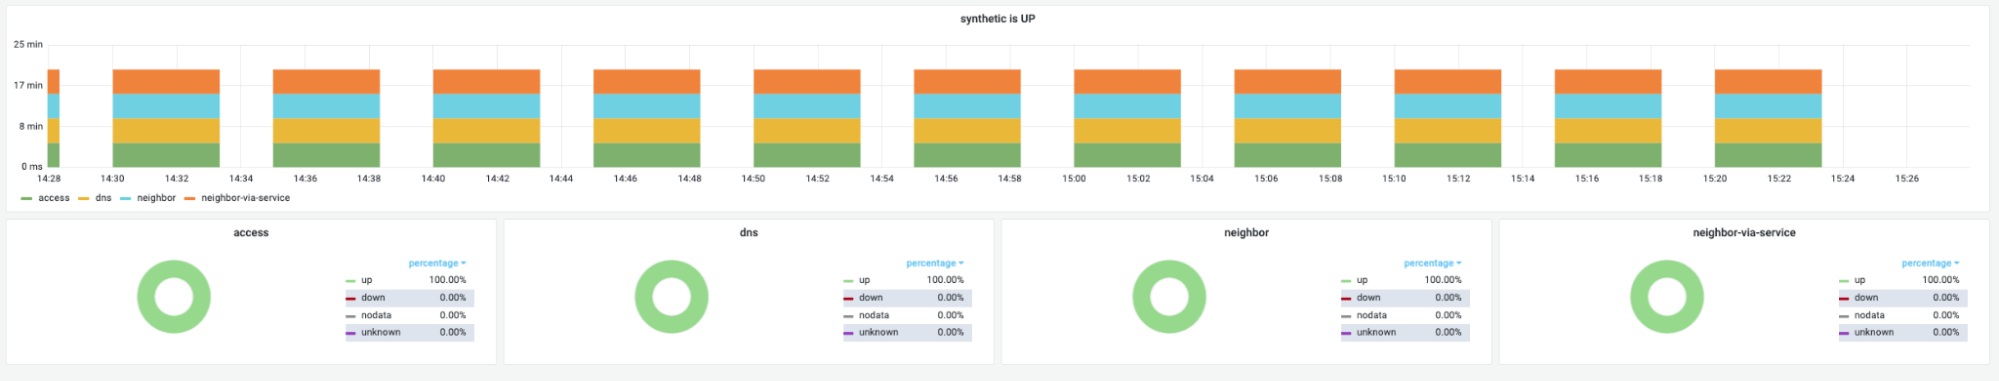
Example of Grafana plots based on upmeter metrics: