The module lifecycle stage: General Availability
How to enable debugging logs?
Enable the debug parameter of the module.
apiVersion: deckhouse.io/v1alpha1
kind: ModuleConfig
metadata:
  name: log-shipper
spec:
  version: 1
  enabled: true
  settings:
    debug: true
Then in logs, you will find a lot of helpful information about HTTP requests, connects reusing, detailed traces, and so on.
How to get aware of logs pipelines?
To begin with, retrieve the list of pods on the desired node.
d8 k -n d8-log-shipper get pods -o wide | grep $node
Select the appropriate pod and execute commands directly from the container.
d8 k -n d8-log-shipper exec $pod -c vector -- COMMAND_NAME
All subsequent commands are assumed to be executed within the container.
See pipelines as a graph
- Execute the
vector graphcommand to get the output of logs pipelines topology in the DOT format. - Put the output to webgraphviz os similar service to render the graph.
Example of the graph output for a single pipeline in ASCII format:
+------------------------------------------------+
|  d8_cluster_source_flant-integration-d8-logs   |
+------------------------------------------------+
  |
  |
  v
+------------------------------------------------+
|       d8_tf_flant-integration-d8-logs_0        |
+------------------------------------------------+
  |
  |
  v
+------------------------------------------------+
|       d8_tf_flant-integration-d8-logs_1        |
+------------------------------------------------+
  |
  |
  v
+------------------------------------------------+
| d8_cluster_sink_flant-integration-loki-storage |
+------------------------------------------------+
Investigate data processing
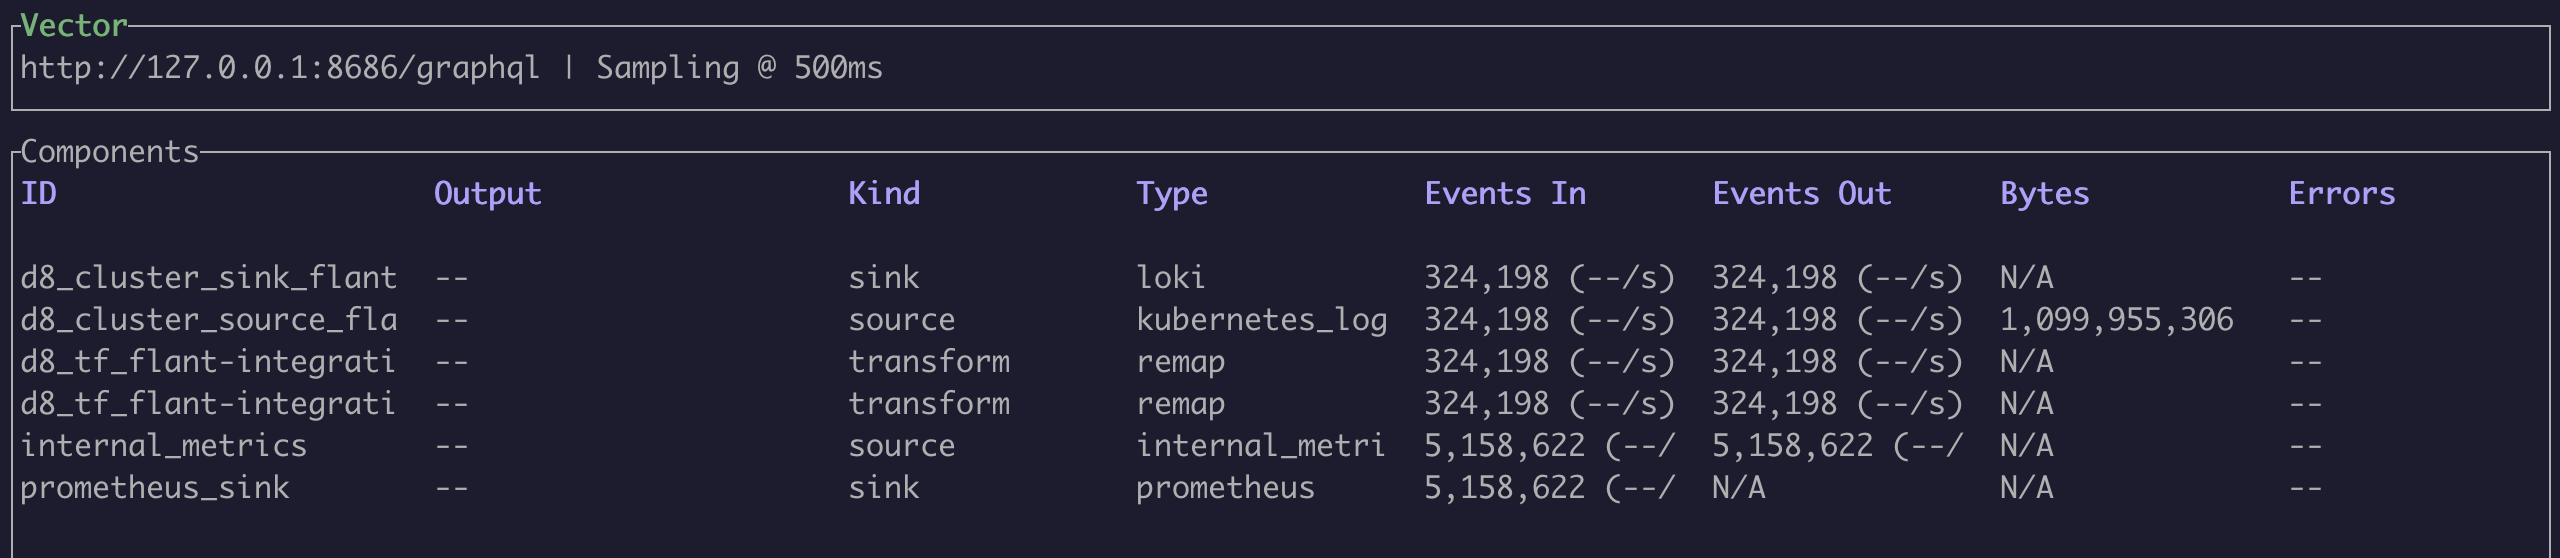
There is the vector top command to help you see how much data is going through all checkpoints of the pipeline.
Example of the output:
Get raw log samples
You may use the vector tap command to get input data for any channel components.
The only argument to be set is the ID of the processing stage. Patterns in a glob format are also supported for selections (e.g., d8_cluster_source_*).
By using the following command, you can see the log’s before applying the transformation rules (d8_cluster_source_* is
the first stage of processing according to the output of the vector graph command):
vector tap 'cluster_logging_config/*'
Transformed logs that are received at the input of the next channel components in the chain:
vector tap 'transform/*'
You can then use the vector vrl interactive console to debug VRL message remap rules.
Example of a program on VRL:
. = {"test1": "lynx", "test2": "fox"}
del(.test2)
.
How to add a new source/sink support for log-shipper?
Vector in the log-shipper module has been built with the limited number of enabled features (to improve building speed and decrease the size of the final binary).
You can see a list of all supported features by executing the vector list command.
If supporting a new source/sink is required, you need to add the corresponding feature to the list of enabled features in the Dockerfile.