Available in: CE, BE, SE, SE+, EE
The module lifecycle stage: General Availability
The module has requirements for installation
The module installs the Prometheus Operator, which automates the deployment and management of Prometheus installations.
Operator:
- Creates the following custom resources:
- Prometheus — describes a Prometheus installation (cluster);
- ServiceMonitor — defines how to collect metrics from services;
- Alertmanager — describes an Alertmanager cluster;
- PrometheusRule — contains a set of Prometheus rules.
- Watches these resources and:
- Generates a StatefulSet with Prometheus and the required configuration files, storing them in a Secret.
- When ServiceMonitor or PrometheusRule change, updates the Prometheus configuration by modifying the corresponding Secret.
Prometheus
Prometheus functions
The Prometheus server performs two primary tasks — it collects metrics and processes rules.
- For each monitoring target, at every
scrape_intervalan HTTP request is sent to that target. The metrics in its own text format are stored in the Prometheus database. - At every
evaluation_interval, rules are processed, resulting in:- alerts being sent;
- new metrics (rule evaluation results) being written to the database.
Prometheus configuration
Prometheus configuration consists of the main config file and rule files (rule files).
The key sections used in config are:
-
scrape_configs: Defines where and how to discover monitoring targets. -
rule_files: Lists the paths to rule files that Prometheus should load. Example:rule_files: - /etc/prometheus/rules/rules-0/* - /etc/prometheus/rules/rules-1/* -
alerting: Defines how to discover and where to send alerts to Alertmanager clusters. Structurally, this section is similar toscrape_configs, but its result is a list of endpoints to which Prometheus sends notifications.
Sources of monitoring targets
General Prometheus workflow:

- Prometheus reads the
scrape_configssection and configures its internal Service Discovery. - Service Discovery interacts with the Kubernetes API (retrieving endpoints and related metadata).
- Based on cluster events, Service Discovery updates the list of monitoring targets.
In scrape_configs, a set of scrape jobs is defined — logical descriptions of where and how to collect metrics. Example:
scrape_configs:
  # General settings.
  - job_name: d8-monitoring/custom/0    # Name of the scrape job, shown in the Service Discovery section.
    scrape_interval: 30s                  # How often to scrape data.
    scrape_timeout: 10s                   # Request timeout.
    metrics_path: /metrics                # HTTP path.
    scheme: http                          # HTTP or HTTPS.
    # Service Discovery settings.
    kubernetes_sd_configs:                # Get targets from Kubernetes.
    - api_server: null                    # API server address is taken from environment variables (present in every Pod).
      role: endpoints                     # Use endpoints as targets.
      namespaces:
        names:                            # Restrict the list of namespaces.
        - foo
        - baz
    # Filtering settings (which endpoints to include/exclude) and relabeling (which labels to add or remove; applies to all scraped metrics).
    relabel_configs:
    # Filter by the value of the prometheus_custom_target label (taken from the Service associated with the endpoint).
    - source_labels: [__meta_kubernetes_service_label_prometheus_custom_target]
      regex: .+                           # Any non-empty label.
      action: keep
    # Filter by port name.
    - source_labels: [__meta_kubernetes_endpointslice_port_name]
      regex: http-metrics                 # Only the port named http-metrics.
      action: keep
    # Add the job label. Use the value of the prometheus_custom_target label on the Service, prefixed with "custom-".
    #
    # The job label:
    #    * defines the group name under which the target will appear;
    #    * is added to metrics for convenient filtering in rules and dashboards.
    - source_labels: [__meta_kubernetes_service_label_prometheus_custom_target]
      regex: (.*)
      target_label: job
      replacement: custom-$1
      action: replace
    # Add the namespace label.
    - source_labels: [__meta_kubernetes_namespace]
      regex: (.*)
      target_label: namespace
      replacement: $1
      action: replace
    # Add the service label.
    - source_labels: [__meta_kubernetes_service_name]
      regex: (.*)
      target_label: service
      replacement: $1
      action: replace
    # Add the instance label (will contain the Pod name).
    - source_labels: [__meta_kubernetes_pod_name]
      regex: (.*)
      target_label: instance
      replacement: $1
      action: replace
Thus, Prometheus automatically tracks the addition and removal of:
- Pods (changes to endpoints lead to the addition or removal of monitoring targets)
- Services (and corresponding endpoints) in the specified namespaces
Configuration changes are required when you need to:
- Add a new
scrape_config(usually a new class of services to monitor). - Change the list of namespaces.
Prometheus Operator
Prometheus Operator functions
Using CRDs (Custom Resource Definitions), Prometheus Operator defines four custom resources:
- Prometheus: Describes a Prometheus installation (cluster);
- ServiceMonitor: Specifies how to collect metrics from a set of services;
- Alertmanager: Describes an Alertmanager cluster;
- PrometheusRule: Contains a set of Prometheus rules.
Prometheus Operator also watches Prometheus resources and, for each one, generates:
- StatefulSet with Prometheus itself
- Secret containing
prometheus.yaml(the main configuration file) andconfigmaps.json(the configuration file forprometheus-config-reloader)
It watches ServiceMonitor and PrometheusRule resources and, based on them, updates the configuration (prometheus.yaml and configmaps.json) in the corresponding Secret.
Contents of the Prometheus Pod
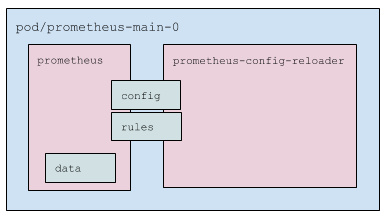
Prometheus pods include:
- Three containers:
prometheus: Prometheus server itself.prometheus-config-reloader: Utility that watches:- Changes made to
prometheus.yamland, if needed, triggers a Prometheus configuration reload (via a special HTTP request; see details below). - PrometheusRules (see details below), downloads them if necessary, and restarts Prometheus.
- Changes made to
kube-rbac-proxy: Proxy that handles RBAC-based authentication and authorization for accessing Prometheus metrics.
- Key volumes:
config: Mounted Secret with the filesprometheus.yamlandconfigmaps.json. Used by theprometheusandprometheus-config-reloadercontainers.rules: AnemptyDirpopulated byprometheus-config-reloaderand read byprometheus. Mounted into both containers; inprometheus, it is read-only.data: Prometheus data. Mounted only into theprometheuscontainer.
ServiceMonitor processing
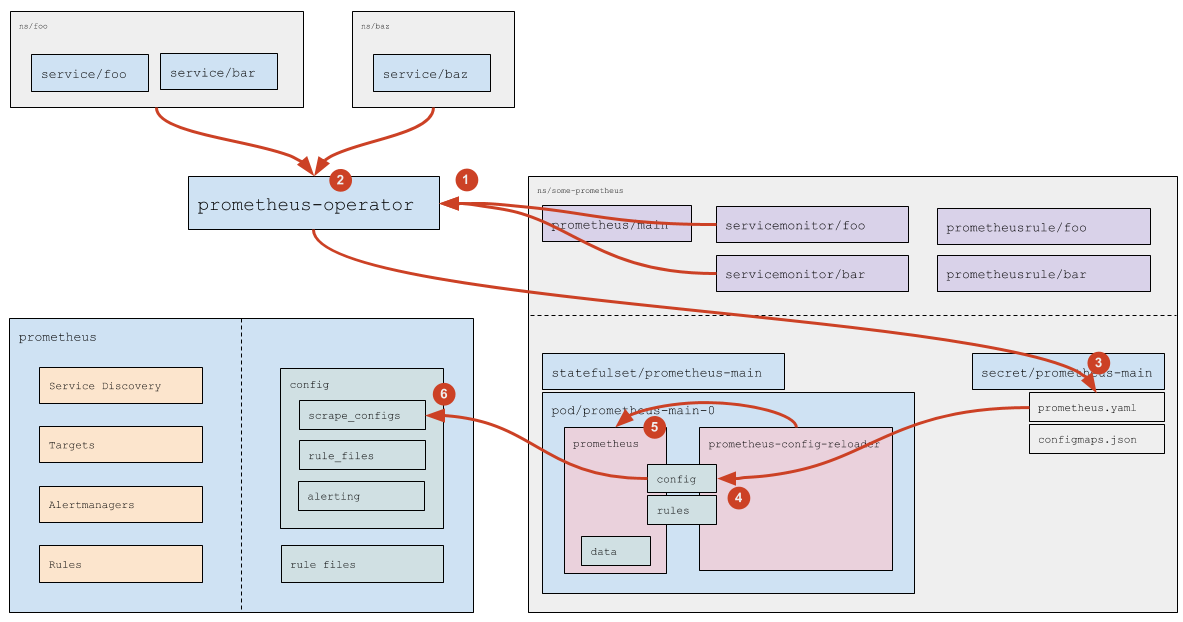
- Prometheus Operator watches ServiceMonitor resources (which ones exactly is defined in the Prometheus resource spec; see details in the official documentation).
- For each ServiceMonitor that does not specify an explicit list of namespaces (
any: trueis used), the operator queries the Kubernetes API to compute the list of namespaces with Service`s that match the labels from the ServiceMonitor. - Based on the discovered ServiceMonitor resources and the computed namespaces, the operator generates the Prometheus configuration fragment (the
scrape_configssection) and stores it in the corresponding Secret. - Kubernetes mounting mechanism updates the files in the Prometheus pod —
prometheus.yamlfrom the Secret is refreshed. - The
prometheus-config-reloadercontainer detects the change toprometheus.yamland sends Prometheus an HTTP request to reload the configuration. - Prometheus rereads the configuration and applies the changes in
scrape_configsaccording to its workflow.
Processing custom resources with rules
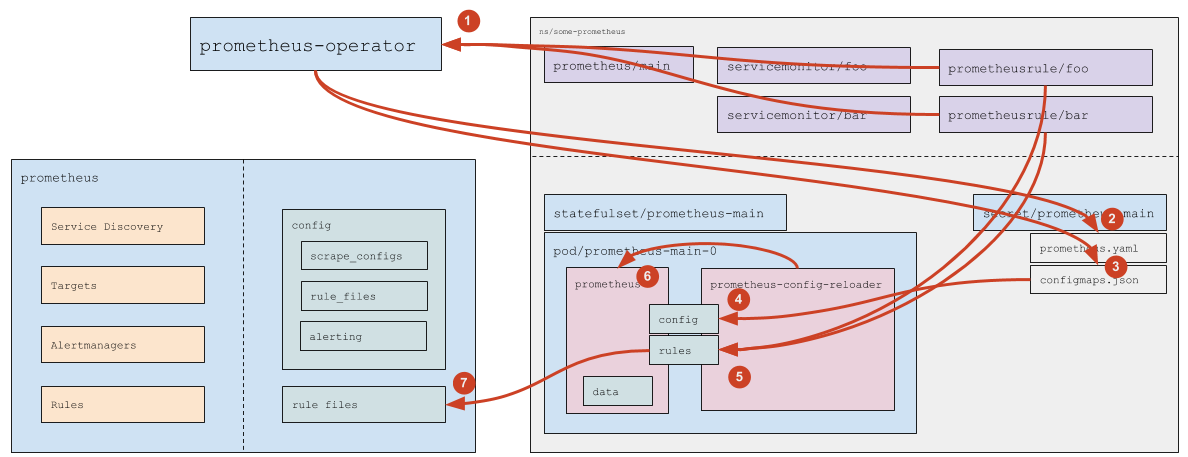
- Prometheus Operator watches PrometheusRule objects that match the
ruleSelectorspecified in the Prometheus resource. - When a new PrometheusRule appears or an existing one is deleted, the operator updates
prometheus.yaml— after that, the same chain as forServiceMonitorprocessing applies. - When a PrometheusRule is added, deleted, or its contents change, the operator updates the ConfigMap
prometheus-main-rulefiles-0. - Kubernetes’ mounting mechanism delivers the updated ConfigMap to the pod.
- The
prometheus-config-reloadercontainer detects the changes and then:- writes the updated ConfigMaps to the
rulesdirectory (emptyDir); - sends Prometheus an HTTP request to reload the configuration.
- writes the updated ConfigMaps to the
- Prometheus rereads the configuration and applies the updated rules.