The module lifecycle stage: Generally available version
The module has requirements for installation
Getting logs from all cluster Pods and sending them to Loki
apiVersion: deckhouse.io/v1alpha2
kind: ClusterLoggingConfig
metadata:
  name: all-logs
spec:
  type: KubernetesPods
  destinationRefs:
  - loki-storage
---
apiVersion: deckhouse.io/v1alpha1
kind: ClusterLogDestination
metadata:
  name: loki-storage
spec:
  type: Loki
  loki:
    endpoint: http://loki.loki:3100
Specify d8-loki in the ClusterLoggingConfig destinationRefs field to send logs to the loki cluster module. More examples in the documentation.
Reading Pod logs from a specified namespace with a specified label and redirecting to Loki and Elasticsearch
Reading logs from namespace=whispers with label app=booking and storing them into Loki and Elasticsearch:
apiVersion: deckhouse.io/v1alpha2
kind: ClusterLoggingConfig
metadata:
  name: whispers-booking-logs
spec:
  type: KubernetesPods
  kubernetesPods:
    namespaceSelector:
      labelSelector:
        matchExpressions:
        - key: "kubernetes.io/metadata.name"
          operator: In
          values: [whispers]
    labelSelector:
      matchLabels:
        app: booking
  destinationRefs:
  - loki-storage
  - es-storage
---
apiVersion: deckhouse.io/v1alpha1
kind: ClusterLogDestination
metadata:
  name: loki-storage
spec:
  type: Loki
  loki:
    endpoint: http://loki.loki:3100
---
apiVersion: deckhouse.io/v1alpha1
kind: ClusterLogDestination
metadata:
  name: es-storage
spec:
  type: Elasticsearch
  elasticsearch:
    endpoint: http://192.168.1.1:9200
    index: logs-%F
    auth:
      strategy: Basic
      user: elastic
      password: c2VjcmV0IC1uCg==
Creating a source in namespace and reading logs of all Pods in that NS with forwarding them to Loki
Namespaced pipeline - reading logs from test-whispers namespace (all Pods):
apiVersion: deckhouse.io/v1alpha1
kind: PodLoggingConfig
metadata:
  name: whispers-logs
  namespace: tests-whispers
spec:
  clusterDestinationRefs:
    - loki-storage
---
apiVersion: deckhouse.io/v1alpha1
kind: ClusterLogDestination
metadata:
  name: loki-storage
spec:
  type: Loki
  loki:
    endpoint: http://loki.loki:3100
Reading only Pods in the specified namespace and having a certain label
Read logs from Pods with label app=booking in namespace test-whispers:
apiVersion: deckhouse.io/v1alpha1
kind: PodLoggingConfig
metadata:
  name: whispers-logs
  namespace: tests-whispers
spec:
  labelSelector:
    matchLabels:
      app: booking
  clusterDestinationRefs:
    - loki-storage
---
apiVersion: deckhouse.io/v1alpha1
kind: ClusterLogDestination
metadata:
  name: loki-storage
spec:
  type: Loki
  loki:
    endpoint: http://loki.loki:3100
Migration from Promtail to Log-Shipper
Path /loki/api/v1/push has to be removed from the previously used Loki URL.
Vector will add this PATH automatically during working with Loki destination.
Working with Grafana Cloud
This documentation expects that you have created API key.
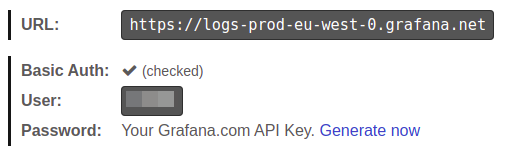
Firstly you should encode your token with base64.
echo -n "<YOUR-GRAFANACLOUD-TOKEN>" | base64 -w0Then you can create ClusterLogDestination
apiVersion: deckhouse.io/v1alpha1
kind: ClusterLogDestination
metadata:
  name: loki-storage
spec:
  loki:
    auth:
      password: PFlPVVItR1JBRkFOQUNMT1VELVRPS0VOPg==
      strategy: Basic
      user: "<YOUR-GRAFANACLOUD-USER>"
    endpoint: <YOUR-GRAFANACLOUD-URL> # For example https://logs-prod-us-central1.grafana.net or https://logs-prod-eu-west-0.grafana.net
  type: Loki
Now you can create PodLogginConfig or ClusterPodLoggingConfig and send logs to Grafana Cloud.
Adding Loki source to Deckhouse Grafana
You can work with Loki from embedded to deckhouse Grafana. Just add GrafanaAdditionalDatasource
apiVersion: deckhouse.io/v1
kind: GrafanaAdditionalDatasource
metadata:
  name: loki
spec:
  access: Proxy
  basicAuth: false
  jsonData:
    maxLines: 5000
    timeInterval: 30s
  type: loki
  url: http://loki.loki:3100
Elasticsearch < 6.X usage
For Elasticsearch < 6.0 doc_type indexing should be set. Config should look like this:
apiVersion: deckhouse.io/v1alpha1
kind: ClusterLogDestination
metadata:
  name: es-storage
spec:
  type: Elasticsearch
  elasticsearch:
    endpoint: http://192.168.1.1:9200
    docType: "myDocType" # Set any string here. It should not start with '_'
    auth:
      strategy: Basic
      user: elastic
      password: c2VjcmV0IC1uCg==
Index template for Elasticsearch
It is possible to route logs to particular indexes based on metadata using index templating:
apiVersion: deckhouse.io/v1alpha1
kind: ClusterLogDestination
metadata:
  name: es-storage
spec:
  type: Elasticsearch
  elasticsearch:
    endpoint: http://192.168.1.1:9200
    index: "k8s-{{ namespace }}-%F"
For the above example for each Kubernetes namespace a dedicated index in Elasticsearch will be created.
This feature works well combining with extraLabels:
apiVersion: deckhouse.io/v1alpha1
kind: ClusterLogDestination
metadata:
  name: es-storage
spec:
  type: Elasticsearch
  elasticsearch:
    endpoint: http://192.168.1.1:9200
    index: "k8s-{{ service }}-{{ namespace }}-%F"
  extraLabels:
    service: "{{ service_name }}"
The following changes are applied:
- If a log message is in JSON format, the
service_namefield of this JSON document is moved to the metadata level. - The new metadata field
serviceis used for the index template.
Splunk integration
It is possible to send logs from Deckhouse to Splunk. To configure Splunk, follow these steps:
- Endpoint must be equal to the Splunk instance name with the
8088port and no path provided, e.g.https://prd-p-xxxxxx.splunkcloud.com:8088. - To add a token to ingest logs, go to
Setting->Data inputs, add a newHTTP Event Collectorand copy a token. - Provide a Splunk index to store logs, e.g.,
logs.
apiVersion: deckhouse.io/v1alpha1
kind: ClusterLogDestination
metadata:
  name: splunk
spec:
  type: Splunk
  splunk:
    endpoint: https://prd-p-xxxxxx.splunkcloud.com:8088
    token: xxxx-xxxx-xxxx
    index: logs
    tls:
      verifyCertificate: false
      verifyHostname: false
Splunk destination doesn’t support pod labels for indexes. Consider exporting necessary labels with the extraLabels option.
extraLabels:
  pod_label_app: '{{ pod_labels.app }}'
Simple Logstash example
To send logs to Logstash, the tcp input should be configured on the Logstash instance side, and its codec should be set to json.
An example of the minimal Logstash configuration:
input {
  tcp {
    port => 12345
    codec => json
  }
}
output {
  stdout { codec => json }
}
An example of the ClusterLogDestination manifest:
apiVersion: deckhouse.io/v1alpha1
kind: ClusterLogDestination
metadata:
  name: logstash
spec:
  type: Logstash
  logstash:
    endpoint: logstash.default:12345
Syslog
The following examples sets severity for the syslog messages and uses the socket destination:
apiVersion: deckhouse.io/v1alpha1
kind: ClusterLogDestination
metadata:
  name: rsyslog
spec:
  type: Socket
  socket:
    mode: TCP
    address: 192.168.0.1:3000
    encoding:
      codec: Syslog
  extraLabels:
    syslog.severity: "alert"
    # The request_id field should be present in the log message.
    syslog.message_id: "{{ request_id }}"
Graylog integration
Make sure that an incoming stream is configured in Graylog to receive messages over the TCP protocol on the specified port. Example manifest for integration with Graylog:
apiVersion: deckhouse.io/v1alpha1
kind: ClusterLogDestination
metadata:
  name: test-socket2-dest
spec:
  type: Socket
  socket:
    address: graylog.svc.cluster.local:9200
    mode: TCP
    encoding:
      codec: GELF
Logs in CEF Format
There is a way to format logs in CEF format using codec: CEF, with overriding cef.name and cef.severity based on values from the message field (application log) in JSON format.
In the example below, app and log_level are keys containing values for overriding:
apiVersion: deckhouse.io/v1alpha1
kind: ClusterLogDestination
metadata:
  name: siem-kafka
spec:
  extraLabels:
    cef.name: '{{ app }}'
    cef.severity: '{{ log_level }}'
  type: Kafka
  kafka:
    bootstrapServers:
      - my-cluster-kafka-brokers.kafka:9092
    encoding:
      codec: CEF
    tls:
      verifyCertificate: false
      verifyHostname: true
    topic: logs
You can also manually set your own values:
extraLabels:
  cef.name: 'TestName'
  cef.severity: '1'
Collect Kubernetes Events
Kubernetes Events can be collected by log-shipper if events-exporter is enabled in the extended-monitoring module configuration.
Enable events-exporter by adjusting extended-monitoring settings:
apiVersion: deckhouse.io/v1alpha1
kind: ModuleConfig
metadata:
  name: extended-monitoring
spec:
  version: 1
  settings:
    events:
      exporterEnabled: true
Apply the following ClusterLoggingConfig to collect logs from the events-exporter Pod:
apiVersion: deckhouse.io/v1alpha2
kind: ClusterLoggingConfig
metadata:
  name: kubernetes-events
spec:
  type: KubernetesPods
  kubernetesPods:
    labelSelector:
      matchLabels:
        app: events-exporter
    namespaceSelector:
      labelSelector:
        matchExpressions:
        - key: "kubernetes.io/metadata.name"
          operator: In
          values: [d8-monitoring]
  destinationRefs:
  - loki-storage
Log filters
Logs can be filtered using the following filters:
labelFilter— applies to the top-level metadata, e.g., container, namespace, or Pod name.logFilter— applies to fields of a message if it is in JSON format.
Collect only logs of the nginx container
apiVersion: deckhouse.io/v1alpha2
kind: ClusterLoggingConfig
metadata:
  name: nginx-logs
spec:
  type: KubernetesPods
  labelFilter:
  - field: container
    operator: In
    values: [nginx]
  destinationRefs:
  - loki-storage
Collect logs without strings GET /status" 200
apiVersion: deckhouse.io/v1alpha2
kind: ClusterLoggingConfig
metadata:
  name: all-logs
spec:
  type: KubernetesPods
  destinationRefs:
  - loki-storage
  labelFilter:
  - field: message
    operator: NotRegex
    values:
    - .*GET /status" 200$
Audit of kubelet actions
apiVersion: deckhouse.io/v1alpha2
kind: ClusterLoggingConfig
metadata:
  name: kubelet-audit-logs
spec:
  type: File
  file:
    include:
    - /var/log/kube-audit/audit.log
  logFilter:
  - field: userAgent
    operator: Regex
    values: ["kubelet.*"]
  destinationRefs:
  - loki-storage
Deckhouse system logs
apiVersion: deckhouse.io/v1alpha2
kind: ClusterLoggingConfig
metadata:
  name: system-logs
spec:
  type: File
  file:
    include:
    - /var/log/syslog
  labelFilter:
  - field: message
    operator: Regex
    values:
    - .*d8-kubelet-forker.*
    - .*containerd.*
    - .*bashible.*
    - .*kernel.*
  destinationRefs:
  - loki-storage
If you need logs from only one or from a small group of a Pods, try to use the kubernetesPods settings to reduce the number of reading filed. Do not use highly grained filters to read logs from a single pod.
Tuning read fairness across many actively growing files
apiVersion: deckhouse.io/v1alpha2
kind: ClusterLoggingConfig
metadata:
  name: many-growing-files
spec:
  type: File
  file:
    include:
    - /var/log/myapp/*.log
    maxReadBytes: 65536
  destinationRefs:
  - loki-storage
maxReadBytes limits how many bytes are read from a single file in one pass before Vector switches to the next matched file. Lower it if several files grow quickly at the same time and reads should be distributed more evenly across them. Higher values speed up catching up on a large backlog but increase memory usage. If not set, Vector’s built-in default (2048 bytes) applies.
The same option is available for the kubernetesPods source (spec.kubernetesPods.maxReadBytes in a ClusterLoggingConfig) and for PodLoggingConfig (spec.maxReadBytes). For pod logs oldestFirst defaults to true: newer files are not read until older ones are caught up, and maxReadBytes only sets the size of a single read portion. To distribute reads across pods, also set oldestFirst: false:
apiVersion: deckhouse.io/v1alpha1
kind: PodLoggingConfig
metadata:
  name: many-growing-pods
spec:
  labelSelector:
    matchLabels:
      app: chatty-app
  maxReadBytes: 65536
  oldestFirst: false
  clusterDestinationRefs:
  - loki-storage
Prioritizing older log files
apiVersion: deckhouse.io/v1alpha2
kind: ClusterLoggingConfig
metadata:
  name: drain-old-files-first
spec:
  type: File
  file:
    include:
    - /var/log/myapp/*.log
    oldestFirst: true
  destinationRefs:
  - loki-storage
oldestFirst makes Vector prioritize draining the oldest matched files before reading from more recent ones, instead of balancing read capacity fairly across all of them. This is useful for timestamped log files where older files should be fully processed (and can then be rotated away) before newer ones. For the file source it defaults to false when not set.
The same option is available for the kubernetesPods source (spec.kubernetesPods.oldestFirst in a ClusterLoggingConfig) and for PodLoggingConfig (spec.oldestFirst) — there it defaults to true when not set, matching Vector’s own kubernetes_logs default. Set it to false to go back to fair reading across all watched pods:
apiVersion: deckhouse.io/v1alpha1
kind: PodLoggingConfig
metadata:
  name: many-growing-pods
spec:
  labelSelector:
    matchLabels:
      app: chatty-app
  oldestFirst: false
  clusterDestinationRefs:
  - loki-storage
Log transformations
In a ClusterLogDestination resource, you can chain transformations in order. The following actions are supported: ParseMessage, ReplaceKeys, ReplaceValue, AddLabels, DropLabels, and DropEvent.
Transforming logs into a structured object
You can use the ParseMessage transformation
to convert a string in the message field into a structured object.
For sourceFormat: String, provide a regular expression with named capture groups and a setLabels map. Output keys are filled from {{ group_name }} templates.
If multiple ParseMessage transformations are used, the one that parses the string must be applied last.
You cannot set parseMessage.targetLabel to .parsed_data.
apiVersion: deckhouse.io/v1alpha1
kind: ClusterLogDestination
metadata:
  name: string-to-json
spec:
  # ...
  transformations:
    - action: ParseMessage
      parseMessage:
        sourceFormat: String
        string:
          regex: "^(?P<msg>.*)$"
          setLabels:
            msg: "{{ msg }}"
Example original log entry:
/docker-entrypoint.sh: Configuration complete; ready for start upTransformed result:
{... "message": {
  "msg": "/docker-entrypoint.sh: Configuration complete; ready for start up"
  }
}
Transforming logs in Klog format into a structured object
You can use the ParseMessage transformation
to parse logs in Klog format and convert them into a structured object.
apiVersion: deckhouse.io/v1alpha1
kind: ClusterLogDestination
metadata:
  name: klog-to-json
spec:
  # ...
  transformations:
    - action: ParseMessage
      parseMessage:
        sourceFormat: Klog
Example original log entry:
I0505 17:59:40.692994 28133 klog.go:70] hello from klogTransformed result:
{... "message": {
  "file":"klog.go",
  "id":28133,
  "level":"info",
  "line":70,
  "message":"hello from klog",
  "timestamp":"2025-05-05T17:59:40.692994Z"
  }
}
Transforming logs in Syslog format into a structured object
You can use the ParseMessage transformation
to parse logs in Syslog format and convert them into a structured object.
apiVersion: deckhouse.io/v1alpha1
kind: ClusterLogDestination
metadata:
  name: syslog-to-json
spec:
  # ...
  transformations:
    - action: ParseMessage
      parseMessage:
        sourceFormat: SysLog
Example original log entry:
<13>1 2020-03-13T20:45:38.119Z dynamicwireless.name non 2426 ID931 [exampleSDID@32473 iut="3" eventSource= "Application" eventID="1011"] Try to override the THX port, maybe it will reboot the neural interface!Transformed result:
{... "message": {
  "appname": "non",
  "exampleSDID@32473": {
    "eventID": "1011",
    "eventSource": "Application",
    "iut": "3"
  },
  "facility": "user",
  "hostname": "dynamicwireless.name",
  "message": "Try to override the THX port, maybe it will reboot the neural interface!",
  "msgid": "ID931",
  "procid": 2426,
  "severity": "notice",
  "timestamp": "2020-03-13T20:45:38.119Z",
  "version": 1
  }
}
Transforming logs in CLF format into a structured object
You can use the ParseMessage transformation
to parse logs in CLF format and convert them into a structured object.
apiVersion: deckhouse.io/v1alpha1
kind: ClusterLogDestination
metadata:
  name: clf-to-json
spec:
  # ...
  transformations:
    - action: ParseMessage
      parseMessage:
        sourceFormat: CLF
Example original log entry:
127.0.0.1 bob frank [10/Oct/2000:13:55:36 -0700] \"GET /apache_pb.gif HTTP/1.0\" 200 2326Transformed result:
{... "message": {
  "host": "127.0.0.1",
  "identity": "bob",
  "message": "GET /apache_pb.gif HTTP/1.0",
  "method": "GET",
  "path": "/apache_pb.gif",
  "protocol": "HTTP/1.0",
  "size": 2326,
  "status": 200,
  "timestamp": "2000-10-10T20:55:36Z",
  "user": "frank"
  }
}
Transforming logs in logfmt format into a structured object
You can use the ParseMessage transformation
to parse logs in logfmt format and convert them into a structured object.
apiVersion: deckhouse.io/v1alpha1
kind: ClusterLogDestination
metadata:
  name: logfmt-to-json
spec:
  # ...
  transformations:
    - action: ParseMessage
      parseMessage:
        sourceFormat: Logfmt
Example original log entry:
@timestamp=\"Sun Jan 10 16:47:39 EST 2021\" level=info msg=\"Stopping all fetchers\" tag#production=stopping_fetchers id=ConsumerFetcherManager-1382721708341 module=kafka.consumer.ConsumerFetcherManagerTransformed result:
{... "message": {
  "@timestamp": "Sun Jan 10 16:47:39 EST 2021",
  "id": "ConsumerFetcherManager-1382721708341",
  "level": "info",
  "module": "kafka.consumer.ConsumerFetcherManager",
  "msg": "Stopping all fetchers",
  "tag#production": "stopping_fetchers"
  }
}
Parsing JSON and reducing the nesting depth
You can use the ParseMessage transformation to parse log entries in JSON format.
Using the depth parameter, you can control the nesting depth.
apiVersion: deckhouse.io/v1alpha1
kind: ClusterLogDestination
metadata:
  name: parse-json
spec:
  # ...
  transformations:
    - action: ParseMessage
      parseMessage:
        sourceFormat: JSON
        json:
          depth: 1
Example original log entry:
{"level" : { "severity": "info" },"msg" : "fetching.module.release"}Transformed result:
{... "message": {
  "level" : "{ \"severity\": \"info\" }",
  "msg" : "fetching.module.release"
  }
}
Example of parsing mixed-format entries into a structured object
When multiple ParseMessage transformations are specified, they are applied to each incoming entry from top to bottom. The first transformation is tried first; if parsing fails, the next transformation is tried. When parsing succeeds, the default message field becomes a structured object, so subsequent transformations are no longer applied to that entry. Therefore, transformations for specific formats, such as JSON, should come first, and the universal string transformation should come last. Otherwise, the string transformation may successfully process an entry intended for JSON or another format.
apiVersion: deckhouse.io/v1alpha1
kind: ClusterLogDestination
metadata:
  name: parse-json
spec:
  # ...
  transformations:
  - action: ParseMessage
    parseMessage:
      sourceFormat: JSON
  - action: ParseMessage
    parseMessage:
      sourceFormat: Klog
  - action: ParseMessage
    parseMessage:
      sourceFormat: String
      string:
        regex: "^(?P<text>.*)$"
        setLabels:
          text: "{{ text }}"
Example original log entry:
/docker-entrypoint.sh: Configuration complete; ready for start up
{"level" : { "severity": "info" },"msg" : "fetching.module.release"}
I0505 17:59:40.692994   28133 klog.go:70] hello from klog
Transformed result:
{... "message": {
  "text": "/docker-entrypoint.sh: Configuration complete; ready for start up"
  }
}
{... "message": {
  "level" : "{ "severity": "info" }",
  "msg" : "fetching.module.release"
  }
}
{... "message": {
  "file":"klog.go",
  "id":28133,
  "level":"info",
  "line":70,
  "message":"hello from klog",
  "timestamp":"2025-05-05T17:59:40.692994Z"
  }
}
Replacing labels
You can use the ReplaceKeys transformation to replace source with target in the specified label keys.
To apply the ReplaceKeys transformation to the message field or its nested fields, the log entry must first be parsed into a structured object using the ParseMessage transformation.
apiVersion: deckhouse.io/v1alpha1
kind: ClusterLogDestination
metadata:
  name: replace-dot
spec:
  # ...
  transformations:
    - action: ReplaceKeys
      replaceKeys:
        source: "."
        target: "_"
        labels:
          - .pod_labels
Example original log entry:
{"msg" : "fetching.module.release"} # Pod label pod.app=testTransformed result:
{... "message": {
  "msg" : "fetching.module.release"
  },
  "pod_labels": {
    "pod_app": "test"
  }
}
Replacing substrings in string fields
You can use the ReplaceValue transformation to replace matches of a regular expression (source) in scalar string fields. The target string can be a literal or use {{ name }} for named capture groups from source.
Apply ParseMessage first if you need to run replacement on a field inside a structured message.
apiVersion: deckhouse.io/v1alpha1
kind: ClusterLogDestination
metadata:
  name: redact-digits
spec:
  # ...
  transformations:
    - action: ReplaceValue
      replaceValue:
        source: \d+
        target: REDACTED
        labels:
          - .message
Example original log entry:
user id 12345 connected from 10.0.0.1Transformed result:
{... "message": "user id REDACTED connected from REDACTED"
}
Adding labels from literals and templates
You can use the AddLabels transformation to add fields using static values or templates such as {{ .pod_labels.app }}. Transformations run after applying extraLabels. If label names overlap, the value from AddLabels has priority.
The when field is an optional list of conditions combined with logical AND. The left-hand side of a condition is a path to a field on the log event: a leading dot and dot-separated segments (for example, .namespace, .pod_labels.app, .message.level). Each list item can be one of the following types:
- Value comparison:
.namespace == "production". Supported operators are==,!=,=~, and!=~. - Field existence check: Only a path with no operator, for example,
.pod_labels.team(the field must exist). - Field absence check:
!.pod_labels.legacy.
apiVersion: deckhouse.io/v1alpha1
kind: ClusterLogDestination
metadata:
  name: add-env-from-pod
spec:
  # ...
  transformations:
    - action: AddLabels
      addLabels:
        when:
          - '.namespace == "production"'
        setLabels:
          .env: prod
          .source_app: "{{ .pod_labels.app }}"
Transformed result for an event in namespace production with pod label app=api:
{..."namespace": "production", "pod_labels": { "app": "api" } "env": "prod", "source_app": "api", ...
}
Dropping events
The DropEvent transformation drops a log event when all conditions in when are true. The when field uses the same syntax as in AddLabels and is combined with logical AND. A condition on a missing field is false, so the event is kept.
The transformation runs at its position in the list, so it can use fields added by previous transformations. Unlike logFilter and labelFilter in ClusterLoggingConfig, which filter at the source for all destinations, DropEvent applies only to the destination where it is configured.
apiVersion: deckhouse.io/v1alpha2
kind: ClusterLogDestination
metadata:
  name: drop-user-events
spec:
  # ...
  transformations:
    - action: AddLabels
      addLabels:
        when:
          - ".message =~ 'AddUser'"
        setLabels:
          .action: adduser
    - action: AddLabels
      addLabels:
        when:
          - ".message =~ 'DelUser'"
        setLabels:
          .action: deluser
    - action: DropEvent
      dropEvent:
        when:
          - ".action"
Events whose message contains AddUser or DelUser get the action label and are dropped; all other events are sent unchanged.
Removing labels
You can use the DropLabels transformation to remove specific labels from log records. Each item under dropLabels.labels has a label field (the path) and optional keepKeys. If keepKeys is set for an item, label must point to an object; inside it, every nested key not listed in keepKeys is removed (key names without a leading dot). If keepKeys is unset for that item, the path in label is removed entirely.
To apply the DropLabels transformation to the message field or its nested fields, the log entry must first be parsed into a structured object using the ParseMessage transformation.
apiVersion: deckhouse.io/v1alpha1
kind: ClusterLogDestination
metadata:
  name: drop-label
spec:
  # ...
  transformations:
    - action: DropLabels
      dropLabels:
        labels:
          - label: .example
Example of removing a specific label from a structured message
The following example shows how you can remove a label from a structured JSON message.
The ParseMessage transformation is applied first to parse the message,
followed by DropLabels to remove the specified label.
apiVersion: deckhouse.io/v1alpha1
kind: ClusterLogDestination
metadata:
  name: drop-label
spec:
  # ...
  transformations:
    - action: ParseMessage
      parseMessage:
        sourceFormat: JSON
    - action: DropLabels
      dropLabels:
        labels:
          - label: .message.example
Example original log entry:
{"msg" : "fetching.module.release", "example": "test"}Transformed result:
{... "message": {
  "msg" : "fetching.module.release"
  }
}
Sending logs to Elasticsearch with transformations
The following is an example of a ClusterLogDestination resource for sending logs to Elasticsearch.
In this example:
- JSON from the
messagefield is parsed and moved into the event root (targetLabel: "."). - Dots are replaced with underscores in
pod_labelskey names. - The source
messagefield is deleted.
apiVersion: deckhouse.io/v1alpha1
kind: ClusterLogDestination
metadata:
  name: es-storage
spec:
  type: Elasticsearch
  elasticsearch:
    endpoint: http://elasticsearch:9200
    index: logs-%F
  transformations:
    - action: ParseMessage
      parseMessage:
        sourceFormat: JSON
        targetLabel: "."
    - action: ReplaceKeys
      replaceKeys:
        source: "."
        target: "_"
        labels:
          - .pod_labels
    - action: DropLabels
      dropLabels:
        labels:
          - label: .message
Example source log line: a Java app emits structured JSON to stdout, therefore the JSON line is stored in the message field of the event. The msg field inside that line holds the program log text.
{... "namespace": "prod", "pod_labels": {"app.kubernetes.io/name": "orders", "app": "api"}, "message": "{\"@timestamp\":\"2025-03-25T10:15:00.123Z\",\"level\":\"INFO\",\"logger\":\"com.example.OrderService\",\"msg\":\"Order id=42 created; user=1001\"}"}Transformation result:
- JSON fields are moved into the event root.
- Dots in
pod_labelskey names are replaced with underscores. - The
messagefield is removed.
{... "namespace": "prod",
  "pod_labels": {
    "app_kubernetes_io/name": "orders",
    "app": "api"
  },
  "@timestamp": "2025-03-25T10:15:00.123Z",
  "level": "INFO",
  "logger": "com.example.OrderService",
  "msg": "Order id=42 created; user=1001"
}
Collect logs from production namespaces using the namespace label selector option
apiVersion: deckhouse.io/v1alpha2
kind: ClusterLoggingConfig
metadata:
  name: production-logs
spec:
  type: KubernetesPods
  kubernetesPods:
    namespaceSelector:
      labelSelector:
        matchLabels:
          environment: production
  destinationRefs:
  - loki-storage
Exclude Pods or namespaces with a label
There is a preconfigured label to exclude particular namespaces or Pods: log-shipper.deckhouse.io/exclude=true.
It can help to stop collecting logs from a namespace or Pod without changing global configurations.
---
apiVersion: v1
kind: Namespace
metadata:
  name: test-namespace
  labels:
    log-shipper.deckhouse.io/exclude: "true"
---
apiVersion: apps/v1
kind: Deployment
metadata:
  name: test-deployment
spec:
  # ...
  template:
    metadata:
      labels:
        log-shipper.deckhouse.io/exclude: "true"
Enable Buffering
The log buffering configuration is essential for improving the reliability and performance of the log collection system. Buffering can be useful in the following cases:
-
Temporary connectivity disruptions. If there are temporary disruptions or instability in the connection to the log storage system (such as Elasticsearch), a buffer allows logs to be temporarily stored and sent when the connection is restored.
-
Smoothing out load peaks. During sudden spikes in log volume, a buffer helps smooth out peak loads on the log storage system, preventing it from becoming overloaded and potentially losing data.
-
Performance optimization. Buffering helps optimize the performance of the log collection system by accumulating logs and sending them in batches, which reduces the number of network requests and improves overall throughput.
Example of enabling in-memory buffering
apiVersion: deckhouse.io/v1alpha1
kind: ClusterLogDestination
metadata:
  name: loki-storage
spec:
  buffer:
    memory:
      maxEvents: 4096
    type: Memory
  type: Loki
  loki:
    endpoint: http://loki.loki:3100
Example of enabling disk buffering
apiVersion: deckhouse.io/v1alpha1
kind: ClusterLogDestination
metadata:
  name: loki-storage
spec:
  buffer:
    disk:
      maxSize: 1Gi
    type: Disk
  type: Loki
  loki:
    endpoint: http://loki.loki:3100
Example of defining behavior when the buffer is full
apiVersion: deckhouse.io/v1alpha1
kind: ClusterLogDestination
metadata:
  name: loki-storage
spec:
  buffer:
    disk:
      maxSize: 1Gi
    type: Disk
    whenFull: DropNewest
  type: Loki
  loki:
    endpoint: http://loki.loki:3100
More detailed description of the parameters is available in the ClusterLogDestination resource.