This module installs the prometheus operator for creating Prometheus installations and managing them in an automated manner.
The prometheus operator:
- defines the following custom resources:
Prometheus— defines the Prometheus installation (cluster);ServiceMonitor— defines the method for collecting services’ metrics;Alertmanager— defines the Alertmanager cluster;PrometheusRule— defines a list of Prometheus rules;
- follows these resources and:
- generates a Prometheus
StatefulSet, all the necessary config files, and saves them to aSecret; - monitors the
ServiceMonitorandPrometheusRuleresources and updates the Prometheus configuration files based on them by making changes to aSecret.
- generates a Prometheus
Prometheus
What does Prometheus do?
Generally, the Prometheus server does two key things: it collects metrics and evaluates rules:
- For each monitoring target, after each
scrape_interval, it sends an HTTP request to this target. In response, it gets custom-formatted metrics and saves them to a database. - At each
evaluation_interval, it evaluates rules and either:- sends alerts, or
- saves (to its own database) new metrics (the result of executing the rule).
How do I configure Prometheus?
- The Prometheus server has a config and rule files (files containing rules).
- The
configfile includes the following sections:scrape_configs— settings that define the method for discovering monitoring targets (see the next section for more details);-
rule_files— a list of directories where rule files are located:rule_files: - /etc/prometheus/rules/rules-0/* - /etc/prometheus/rules/rules-1/* alerting— settings to locate Alert Managers to which alerts are sent. This section is similar toscrape_configs, except that it defines a list of endpoints to which Prometheus sends alerts.
How does Prometheus get the list of targets?
-
The Prometheus workflow looks as follows:
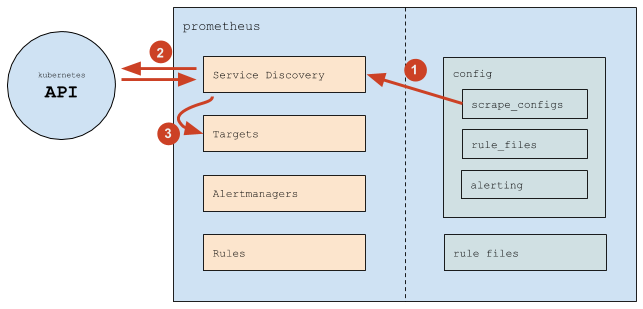
- (1) Prometheus reads the
scrape_configssection and uses it to configure its internal Service Discovery mechanism; - (2) The Service Discovery mechanism interacts with the Kubernetes API (mostly, it gets endpoints);
- (3) Based on Kubernetes information, the Service Discovery mechanism updates Targets (the list of targets);
- (1) Prometheus reads the
-
scrape_configscontains a list of scrape jobs (the internal Prometheus concept), and each job is defined as follows:scrape_configs: # General Settings - job_name: d8-monitoring/custom/0 # the name of a scrape job as displayed in the Service Discovery section scrape_interval: 30s # an interval at which data are collected scrape_timeout: 10s # request timeout metrics_path: /metrics # path to send the requests to scheme: http # http or https # Service discovery settings kubernetes_sd_configs: # means that Kubernetes supplies targets - api_server: null # use environment variables (which are present in every Pod) to get the API server address role: endpoints # endpoints supply targets namespaces: names: # search for endpoints in these namespaces only - foo - baz # Filtering (which endpoints to use) and re-labeling (which labels attach to all the metrics collected or delete from them) settings relabel_configs: # Filtering by the prometheus_custom_target label (obtained from the service associated with the endpoint) - source_labels: [__meta_kubernetes_service_label_prometheus_custom_target] regex: .+ # any NON-empty label would suffice action: keep # Filtering by the port name - source_labels: [__meta_kubernetes_endpointslice_port_name] regex: http-metrics # only works if the port is called http-metrics action: keep # Adding the job label, using the value of the prometheus_custom_target label in the service while adding the " custom-" prefix # # The job label is the Prometheus's service label: # * it defines the name of the group in which target will be displayed on the targets page # * every metric collected from these targets will have it; thus, you can conveniently use it when filtering in rules and dashboards - source_labels: [__meta_kubernetes_service_label_prometheus_custom_target] regex: (.*) target_label: job replacement: custom-$1 action: replace # Add the namespace label - source_labels: [__meta_kubernetes_namespace] regex: (.*) target_label: namespace replacement: $1 action: replace # Add the service label - source_labels: [__meta_kubernetes_service_name] regex: (.*) target_label: service replacement: $1 action: replace # Add the instance label (contains the Pod's name) - source_labels: [__meta_kubernetes_pod_name] regex: (.*) target_label: instance replacement: $1 action: replace - This way, Prometheus tracks:
- the addition of Pods and deletion of them (Kubernetes changes the endpoints when adding/deleting Pods; Prometheus notices this and adds/deletes targets);
- the addition of services (or rather endpoints) and deletion of them in the specified namespaces.
- The change of the configuration is necessary in the following cases:
- if you need to add a new scrape config (usually, it is due to adding a new type of services that need to be monitored);
- if you need to modify the list of namespaces.
Prometheus Operator
What does Prometheus Operator do?
- Prometheus Operator defines four custom resources using the CRD (Custom Resource Definitions) mechanism:
- prometheus — defines the Prometheus installation (cluster);
- servicemonitor — defines the method for monitoring (collecting metrics) a set of services;
- alertmanager — defines the Alertmanager cluster (it isn’t used since metrics are sent directly to madison);
- prometheusrule — defines a list of Prometheus rules;
- Monitors
prometheusresources and generates for each resource:- StatefulSet (with Prometheus);
- Secret containing
prometheus.yaml(the Prometheus config) andconfigmaps.json(theprometheus-config-reloaderconfig);
- Monitors
servicemonitorandprometheusruleresources and updates the config files (prometheus.yamlandconfigmaps.jsonstored in the secret) based on them.
What does the Prometheus Pod contain?
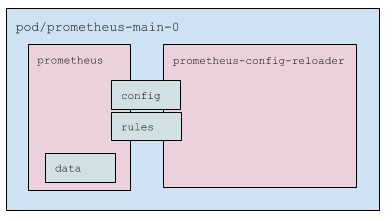
- The Prometheus Pod has two containers inside:
prometheus— the container with the Prometheus itself;prometheus-config-reloader— a wrapping that:
- The Pod uses three volumes:
- config — the secret (it contains
prometheus.yamlandconfigmaps.json). It is mounted to both containers. - rules — an
emptyDirvolume that reads theprometheuscontainer and supplies data to theprometheus-config-reloadercontainer. It is mounted to both containers (in read-only mode in the case of the Prometheus container). - data — a Prometheus data volume. This one mounted to
prometheusonly.
- config — the secret (it contains
How are Service Monitors handled?
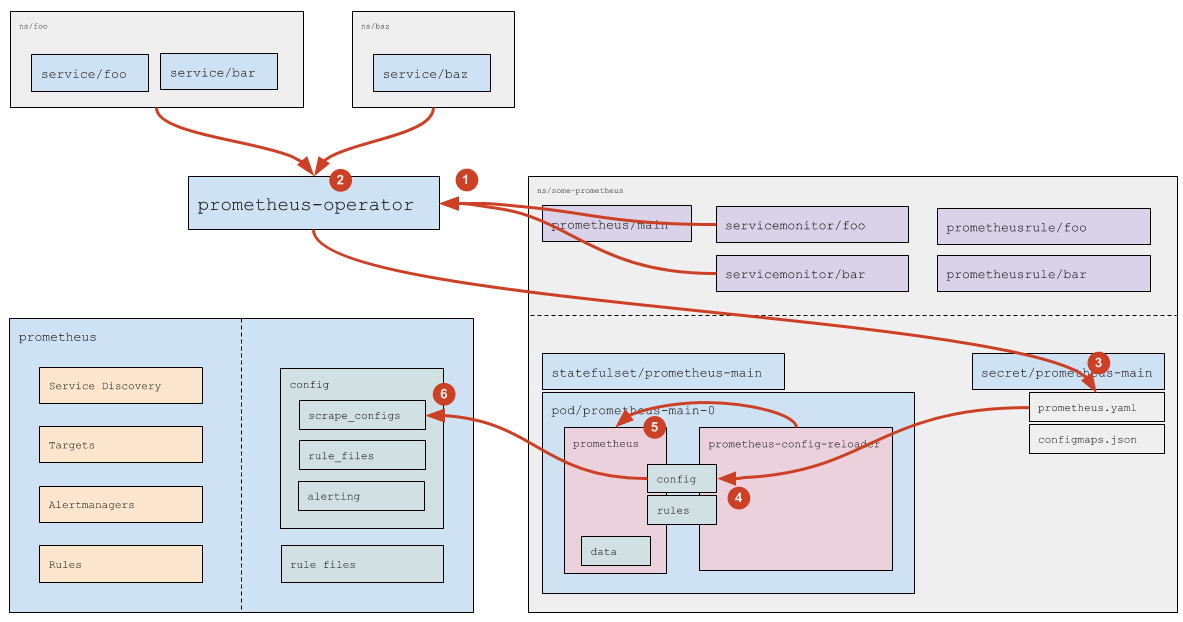
- (1) Prometheus Operator reads Service Monitors (and tracks their addition/removal/modification). The list of Service Monitors to follow is specified in the
prometheus; see the official documentation) for more details. - (2) For each Service Monitor (if it doesn’t have a specific list of namespaces, i.e.,
any: trueis set), Prometheus Operator determines (using the Kubernetes API) a list of namespaces where Services matching the Service Monitor’s labels are running. - (3) Based on the
servicemonitorresources read (see the official documentation)) and a list of namespaces determined, Prometheus Operator generates thescrape_configsconfig section and saves it to the corresponding Secret. - (4) The Secret’s data then passed to the Pod using standard Kubernetes mechanisms (the
prometheus.yamlfile gets updated). - (5)
prometheus-config-reloadernotices the change and sends an HTTP request to Prometheus to reload. - (6) Prometheus rereads the config and notices changes in the scrape_configs section, which it processes according to internal logic (you can find more details above).
How are Custom Resources with rules processed?
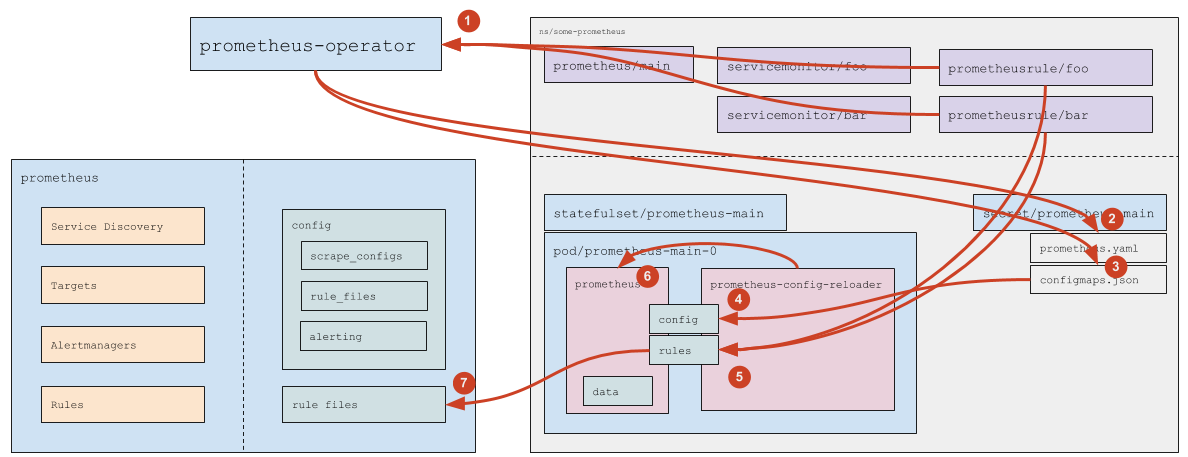
- (1) Prometheus Operator monitors PrometheusRules that match the
ruleSelectordefined in theprometheusresource. - (2) If a new PrometheusRule is created (or the existing one is deleted), Prometheus Operator updates
prometheus.yaml(and then the logic for Service Monitors described above comes into play). - (3) Prometheus Operator updates the
prometheus-main-rulefiles-0ConfigMap in response to the addition/deletion/modification of the PrometheusRule. - (4) The ConfigMap data are passed to the Pod using standard Kubernetes mechanisms.
prometheus-config-reloadernotices that the file is changed and:- (5) pulls the modified ConfigMaps to the rules directory (of an
emptyDirtype); - (6) sends a reboot request to Prometheus over HTTP;
- (5) pulls the modified ConfigMaps to the rules directory (of an
- (7) Prometheus rereads the config and notices the modified rules.