The module lifecycle stage: General Availability
The module has requirements for installation
The observability module lets you collect metrics and track the state of managed services running in the DKP cluster.
The service monitoring is enabled by default if the following requirements are met:
- DKP version 1.76.0 or higher
promppmodule version 3.7.10 or higher (if this module is used)
Supported services
The module currently supports monitoring of the following managed services:
| Service type | Scope | Who has access |
|---|---|---|
| PostgreSQL | Project (namespace) level | Users of the corresponding project |
| Memcached | Project (namespace) level | Users of the corresponding project |
Dashboards
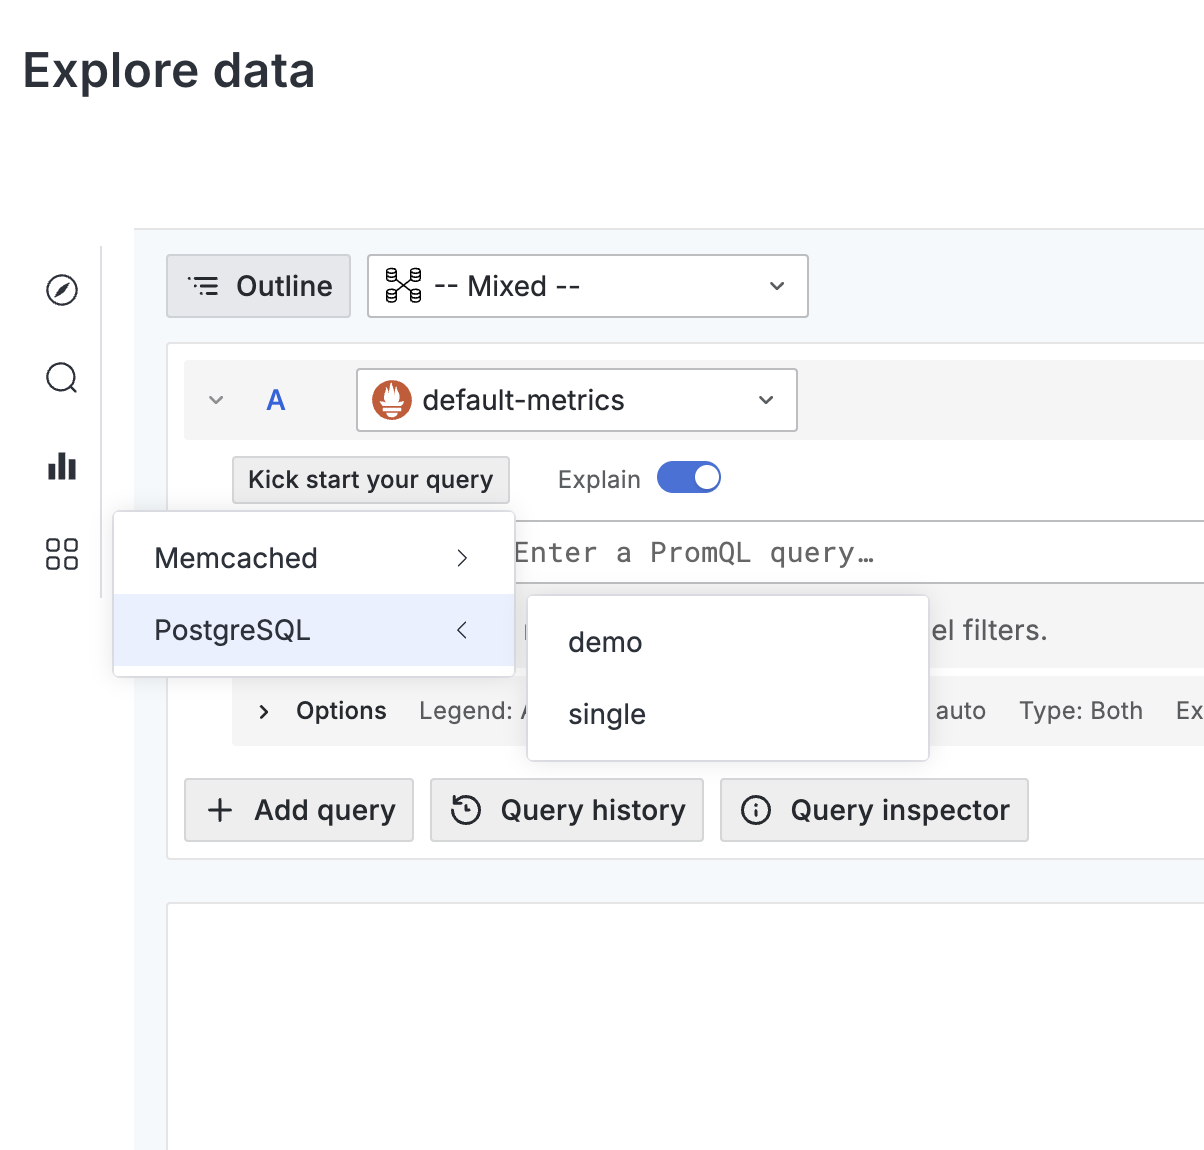
To view a service’s health data, open the corresponding dashboard in the Deckhouse web UI. For that, go to “Monitoring” → “Explore data”, then choose the service type (for example, “PostgreSQL”) in the vertical menu and select the required service instance from the drop-down list.
Alerts
The following alerts are available for the PostgreSQL services.
| Service type | Alert name | Description |
|---|---|---|
| PostgreSQL | PgAutovacuumWorkers |
Autovacuum worker limit reached; table bloat and degraded query performance are possible |
| PostgreSQL | PgCheckError |
The monitoring agent failed to collect metrics from the PostgreSQL instance |
| PostgreSQL | PgMaxConnections |
Connection pool usage exceeds 95%; new connections may be refused |
| PostgreSQL | PgPluginConfig |
The PostgreSQL monitoring plugin is not fully configured |
| PostgreSQL | PgReplicationStatus |
The primary server lost its replication connection to the standby; data on the standby may be stale |
| PostgreSQL | PgTxidWraparound |
Approaching transaction ID wraparound; the database will shut down unless VACUUM is run urgently |
| PostgreSQL | PgWaitingConnections |
More than one connection is waiting; lock contention may affect performance |
| PostgreSQL | PgWalArchiverFails |
WAL archiver failures; WAL segments may accumulate and disk space may be exhausted |
Disabling monitoring
Service monitoring is controlled by the observability.deckhouse.io/servicemonitoring label. You can set it on a namespace (for all instances in the project) or on a specific pod (for a single instance).
Allowed values:
| Value | Metrics collection | Alerts |
|---|---|---|
enabled |
Yes | Yes |
no-alerts |
Yes | No |
disabled |
No | No |
If the label is missing or has an unrecognized value, enabled is applied.
Configuration example:
apiVersion: v1
kind: Namespace
metadata:
  name: project-a
  labels:
    observability.deckhouse.io/servicemonitoring: no-alerts
A pod label can only tighten the restriction set on the namespace, not loosen it. The effective value for an instance is defined based on the strictest rule: enabled < no-alerts < disabled.
The following table shows how the effective value depends on the namespace and pod labels.
| Namespace label | Pod label | Effective value |
|---|---|---|
disabled |
Any value or not set | disabled |
| Any value or not set | disabled |
disabled |
no-alerts |
Any value except disabled |
no-alerts |
Any value except disabled |
no-alerts |
no-alerts |
enabled or not set |
enabled or not set |
enabled |