The module lifecycle stage: Generally available version
The module has requirements for installation
The observability module lets you collect metrics and track the state of managed services running in the DKP cluster.
The service monitoring is enabled by default if the following requirements are met:
- DKP version 1.76.0 or higher
promppmodule version 3.7.10 or higher (if this module is used)
Supported services
The module currently supports monitoring of the following managed services:
| Service type | Scope | Who has access |
|---|---|---|
| PostgreSQL | Project (namespace) level | Users of the corresponding project |
| Memcached | Project (namespace) level | Users of the corresponding project |
Connecting a PostgreSQL instance
To let the module collect metrics from a PostgreSQL instance, run the following as a superuser (or another role that already has full access to pg_stat_* views) on that instance:
CREATE ROLE okagent WITH LOGIN;
CREATE SCHEMA okmeter; -- Keeps the helper function separate from the rest of the schema.
GRANT USAGE ON SCHEMA okmeter TO okagent; -- Grants okagent access to the helper schema.
CREATE OR REPLACE FUNCTION okmeter.pg_stats(text) RETURNS SETOF RECORD AS
$$
DECLARE r record;
BEGIN
    FOR r IN EXECUTE 'SELECT r FROM pg_' || $1 || ' r' LOOP RETURN NEXT r;
    END LOOP;
    RETURN;
END
$$ LANGUAGE plpgsql SECURITY DEFINER; -- Lets okagent read restricted pg_stat_* views without extra privileges.
The module’s monitoring agent (opagent) reaches PostgreSQL through a local Unix domain socket on the same host, expected at /controller/run, and connects without a password — pg_hba.conf needs to allow okagent to connect locally without a password check.
A simpler alternative on PostgreSQL 10 and newer
Starting with PostgreSQL 10, the built-in pg_monitor role gives the same monitoring visibility as the okmeter.pg_stats function above without creating a schema or a function:
CREATE ROLE okagent WITH LOGIN;
GRANT pg_monitor TO okagent;
Use this instead of the schema/function setup if all your instances run PostgreSQL 10 or newer. The okmeter.pg_stats function above additionally works on PostgreSQL versions earlier than 10, where the pg_monitor role doesn’t exist yet.
PostgreSQL 16 and newer
Optional: without a reserved connection, okagent gets rejected like any other client once the instance runs out of connections. Starting with PostgreSQL 16, grant okagent the built-in pg_use_reserved_connections role and reserve at least one connection for it — superuser_reserved_connections alone doesn’t cover non-superuser roles:
GRANT pg_use_reserved_connections TO okagent;
ALTER SYSTEM SET reserved_connections = 1;
reserved_connections can only be set at server start, so the PostgreSQL server needs to be restarted for the change to take effect. Make sure reserved_connections plus superuser_reserved_connections stays below max_connections.
One reserved connection is enough — okagent never holds more than one connection to an instance at a time. Not available on PostgreSQL versions earlier than 16.
Dashboards
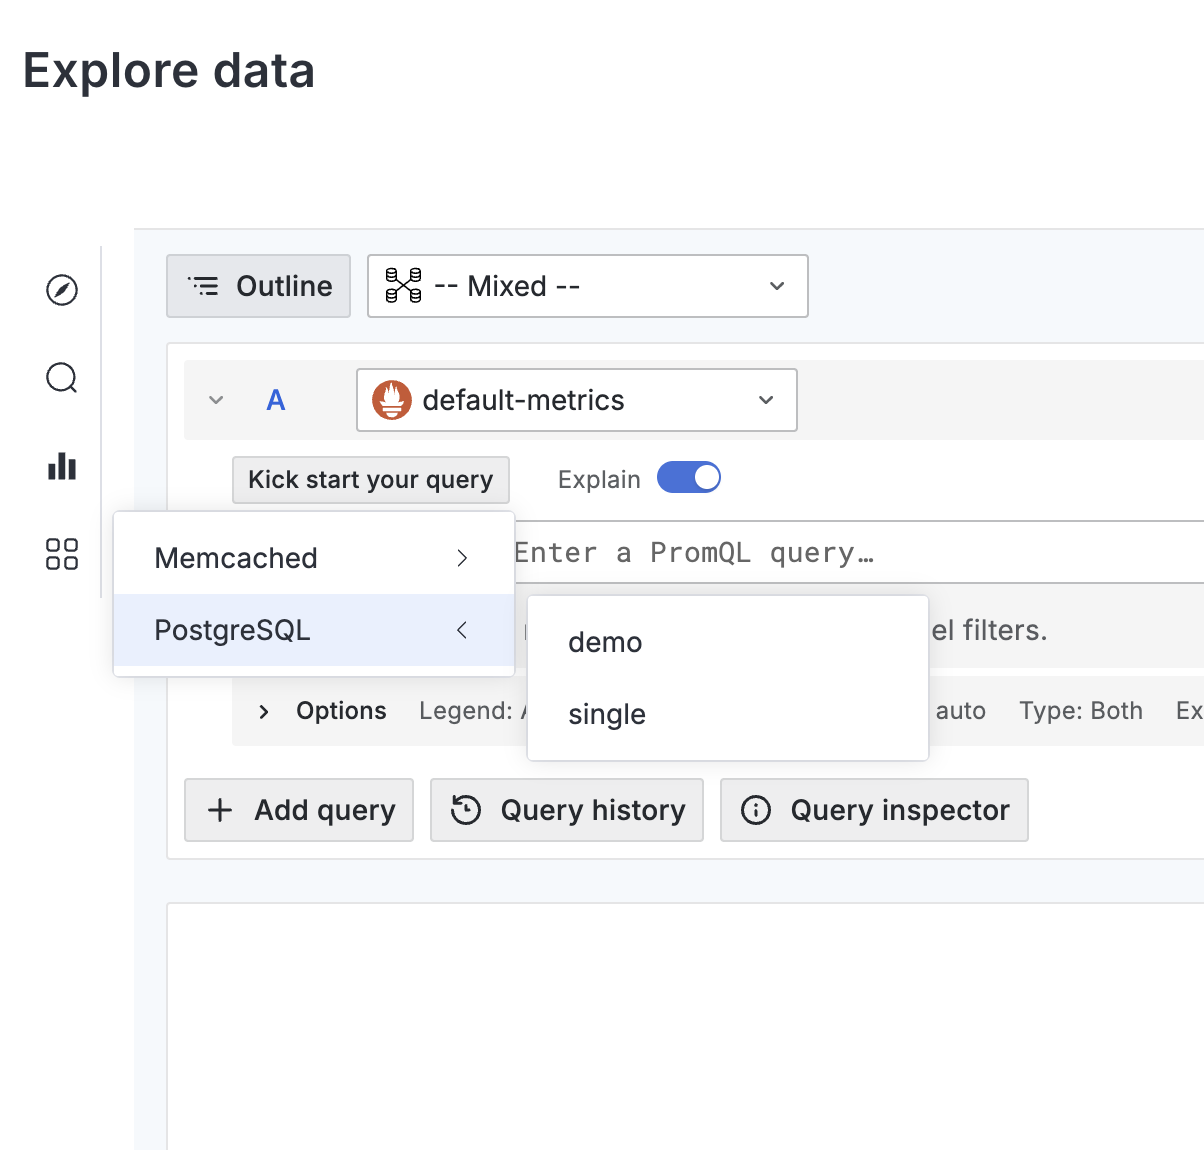
To view a service’s health data, open the corresponding dashboard in the Deckhouse web UI. For that, go to “Monitoring” → “Explore data”, then choose the service type (for example, “PostgreSQL”) in the vertical menu and select the required service instance from the drop-down list.
Alerts
The following alerts are available for the PostgreSQL services.
| Service type | Alert name | Description |
|---|---|---|
| PostgreSQL | PgAutovacuumWorkers |
Autovacuum worker limit reached; table bloat and degraded query performance are possible |
| PostgreSQL | PgCheckError |
The monitoring agent failed to collect metrics from the PostgreSQL instance |
| PostgreSQL | PgMaxConnections |
Connection pool usage exceeds 95%; new connections may be refused |
| PostgreSQL | PgPluginConfig |
The PostgreSQL monitoring plugin is not fully configured |
| PostgreSQL | PgReplicationStatus |
The primary server lost its replication connection to the standby; data on the standby may be stale |
| PostgreSQL | PgTxidWraparound |
Approaching transaction ID wraparound; the database will shut down unless VACUUM is run urgently |
| PostgreSQL | PgWaitingConnections |
More than one connection is waiting; lock contention may affect performance |
| PostgreSQL | PgWalArchiverFails |
WAL archiver failures; WAL segments may accumulate and disk space may be exhausted |
Disabling monitoring
Service monitoring is controlled by the observability.deckhouse.io/servicemonitoring label. You can set it on a namespace (for all instances in the project) or on a specific pod (for a single instance).
Allowed values:
| Value | Metrics collection | Alerts |
|---|---|---|
enabled |
Yes | Yes |
no-alerts |
Yes | No |
disabled |
No | No |
If the label is missing or has an unrecognized value, enabled is applied.
Configuration example:
apiVersion: v1
kind: Namespace
metadata:
  name: project-a
  labels:
    observability.deckhouse.io/servicemonitoring: no-alerts
A pod label can only tighten the restriction set on the namespace, not loosen it. The effective value for an instance is defined based on the strictest rule: enabled < no-alerts < disabled.
The following table shows how the effective value depends on the namespace and pod labels.
| Namespace label | Pod label | Effective value |
|---|---|---|
disabled |
Any value or not set | disabled |
| Any value or not set | disabled |
disabled |
no-alerts |
Any value except disabled |
no-alerts |
Any value except disabled |
no-alerts |
no-alerts |
enabled or not set |
enabled or not set |
enabled |
Where the agent runs
The agent is deployed as a DaemonSet, but only to nodes that host at least one service with monitoring in effect (see Disabling monitoring). The module tracks such nodes with the observability.deckhouse.io/opagent label: it is added when the first monitored service is scheduled onto a node and removed a couple of minutes after the last one leaves it. The label is managed automatically — do not set or remove it by hand, the module will revert the change.
After the first monitored service appears on a node, allow a few minutes for the agent to start and begin collecting metrics. The nodeAffinity setting of the module further restricts where the agent may run and is applied in addition to the label.