Available in: CE, BE, SE, SE+, EE
The module lifecycle stage: General Availability
The module has requirements for installation
How to explicitly enable the module…
You may explicitly enable or disable the module in one of the following ways:
-
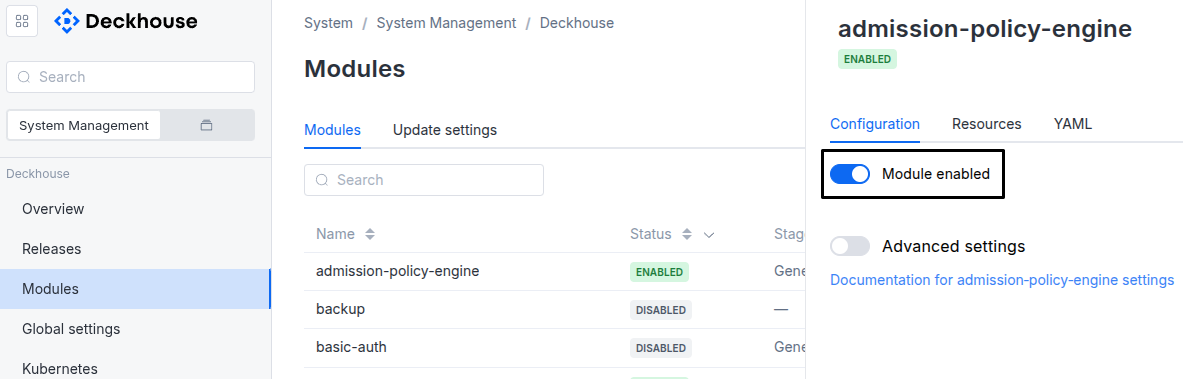
Via Deckhouse web UI. In the “System” → “System Management” → “Deckhouse” → “Modules” section, open the
observabilitymodule and enable (or disable) the “Module enabled” toggle. Save changes.Example:
-
Via Deckhouse CLI (d8).
Use the d8 system module enable command for enabling, or d8 system module disable command for disabling the module (you need Deckhouse CLI (d8), configured to work with the cluster).
Example of enabling the module:
d8 system module enable observability -
Using ModuleConfig
observability.Set
spec.enabledtotrueorfalsein ModuleConfigobservability(create it if necessary);Example of a manifest to enable module
observability:apiVersion: deckhouse.io/v1alpha1 kind: ModuleConfig metadata: name: observability spec: enabled: true
You can configure the module in one of the following ways:
-
Via Deckhouse web UI.
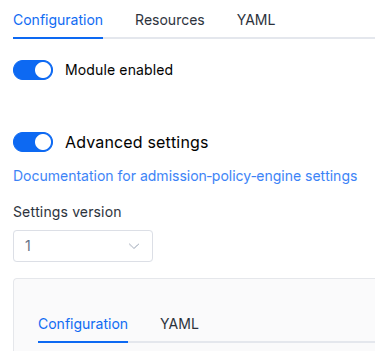
In the “System” → “System Management” → “Deckhouse” → “Modules” section, open the
observabilitymodule and enable the “Advanced Settings” switch. Fill in the required fields in the “Configuration” tab or specify the module settings in YAML format on the “YAML” tab, excluding the settings section. Save the changes.Example:
You can also edit the ModuleConfig object
observabilityon the “YAML” tab in the module settings window (“System” → “System Management” → “Deckhouse” → “Modules”, open the moduleobservability) by specifying the schema version in thespec.versionparameter and the necessary module parameters in thespec.settingssection. -
Via Deckhouse CLI (d8) (requires Deckhouse CLI (d8) configured to work with the cluster).
Edit the existing ModuleConfig
observability(for more details on configuring Deckhouse, see the documentation) by executing the following command:d8 k edit mc observabilityMake the necessary changes in the
spec.settingssection. If necessary, specify the schema version in thespec.versionparameter. Save the changes.You can also create a file with manifest for ModuleConfig
observabilityusing the example below. Fill in thespec.settingssection with the required module parameters. If necessary, specify the schema version in thespec.versionparameter.Apply the manifest using the following command (indicate the manifest file name):
d8 k apply -f <FILENAME>Example of a manifest for ModuleConfig
observability:apiVersion: deckhouse.io/v1alpha1 kind: ModuleConfig metadata: name: observability spec: version: 1 enabled: true settings: # Module parameters from the "Parameters" section below.
Requirements
To the Deckhouse version: 1.71 and above.
To the versions of other modules:
-
console: 1.41.1 and above. -
operator-prometheus: any version. -
prometheus: any version.
Parameters
Schema version: 1
-
-
objectsettings.deadMansSwitchSettings for the DeadMansSwitch alerting.
Default:
{}-
booleansettings.deadMansSwitch.enabled
Whether to enable DeadMansSwitch alert handling.
When enabled (default), a DeadMansSwitch heartbeat alert is expected from Prometheus and a PrometheusUnavailable alert is generated if the heartbeat is missing. When disabled, neither DeadMansSwitch nor PrometheusUnavailable alerts are created.
Default:
true
-
-
objectsettings.dopSettings for integration with DOP (Deckhouse Observability Platform).
Default:
{}-
array of objectssettings.dop.destinationsList of DOP destinations for metrics delivery. At least one destination is required.
Example:
destinations: - host: dop.flant.com token: your-api-token-here-
stringsettings.dop.destinations.hostDOP platform host address (must be a valid FQDN, e.g., dop.flant.com).
Length:
1..253Pattern:
^[a-zA-Z0-9]([a-zA-Z0-9-]{0,61}[a-zA-Z0-9])?(\.[a-zA-Z0-9]([a-zA-Z0-9-]{0,61}[a-zA-Z0-9])?)*$ -
stringsettings.dop.destinations.tokenAPI token for the DOP platform (UUID format).
Pattern:
^[a-fA-F0-9]{8}-[a-fA-F0-9]{4}-[a-fA-F0-9]{4}-[a-fA-F0-9]{4}-[a-fA-F0-9]{12}$
-
-
booleansettings.dop.hostMetricsWhether to enable nodes metrics collection with okagent.
Default:
true -
objectsettings.dop.nodeAffinity
Node affinity configuration for the okagent.
Allows constraining which nodes the pod can be scheduled on.
Default:
{}-
objectsettings.dop.nodeAffinity.requiredDuringSchedulingIgnoredDuringExecutionIf the affinity requirements specified by this field are not met at scheduling time, the pod will not be scheduled onto the node.
-
array of objectssettings.dop.nodeAffinity.requiredDuringSchedulingIgnoredDuringExecution.nodeSelectorTermsA list of node selector terms. The terms are ORed.
-
array of objectssettings.dop.nodeAffinity.requiredDuringSchedulingIgnoredDuringExecution.nodeSelectorTerms.matchExpressionsA list of node selector requirements by node’s labels. The requirements are ANDed.
-
stringsettings.dop.nodeAffinity.requiredDuringSchedulingIgnoredDuringExecution.nodeSelectorTerms.matchExpressions.keyThe label key that the selector applies to.
-
stringsettings.dop.nodeAffinity.requiredDuringSchedulingIgnoredDuringExecution.nodeSelectorTerms.matchExpressions.operatorRepresents a key’s relationship to a set of values. Valid operators are
In,NotIn,Exists,DoesNotExist,Gt, andLt.Allowed values:
In,NotIn,Exists,DoesNotExist,Gt,Lt -
array of stringssettings.dop.nodeAffinity.requiredDuringSchedulingIgnoredDuringExecution.nodeSelectorTerms.matchExpressions.valuesAn array of string values for the operator to evaluate. If the operator is
InorNotIn, the values array must be non-empty. If the operator isExistsorDoesNotExist, the values array must be empty. If the operator isGtorLt, the values array must have a single element, which will be interpreted as an integer.
-
-
array of objectssettings.dop.nodeAffinity.requiredDuringSchedulingIgnoredDuringExecution.nodeSelectorTerms.matchFieldsA list of node selector requirements by node’s fields. The requirements are ANDed.
-
stringsettings.dop.nodeAffinity.requiredDuringSchedulingIgnoredDuringExecution.nodeSelectorTerms.matchFields.keyThe node field key that the selector applies to.
-
stringsettings.dop.nodeAffinity.requiredDuringSchedulingIgnoredDuringExecution.nodeSelectorTerms.matchFields.operatorRepresents a key’s relationship to a set of values. Valid operators are
In,NotIn,Exists,DoesNotExist,Gt, andLt.Allowed values:
In,NotIn,Exists,DoesNotExist,Gt,Lt -
array of stringssettings.dop.nodeAffinity.requiredDuringSchedulingIgnoredDuringExecution.nodeSelectorTerms.matchFields.valuesAn array of string values for the operator to evaluate.
-
-
-
-
-
-
objectsettings.externalMetricsAccessSettings for external access to metrics.
Default:
{}-
booleansettings.externalMetricsAccess.enabled
Whether to enable metrics external read access.
If enabled, the observability module will expose the metrics via ingress for reading. Metrics can be read using the Prometheus-compatible API. Providing a valid ServiceAccount token via the
Authorization: Bearerheader is mandatory. See the documentation for more details.Default:
false -
array of stringssettings.externalMetricsAccess.whitelistSourceRangesAn array if CIDRs that are allowed to read metrics. If not specified, no restrictions are applied.
Default:
[]Example:
whitelistSourceRanges:
- 1.1.1.1/32
-
-
objectsettings.grafanaGrafana related settings.
Default:
{}-
array of stringssettings.grafana.customPlugins
A list of custom Grafana plugins. Contains plugin names from the official repository.
Here is how you can add custom plugins (in this case, clickhouse-datasource and flowcharting-panel plugins are used):
grafana:
  customPlugins:
  - agenty-flowcharting-panel
  - vertamedia-clickhouse-datasource
You can also install plugins from other sources by passing a link to the plugin zip archive in the format
<url to plugin zip>;<plugin name>:grafana: customPlugins: - http://10.241.32.16:3000/netsage-bumpchart-panel-1.1.1.zip;netsage-bumpchart-panelExample:
customPlugins:
- agenty-flowcharting-panel
- vertamedia-clickhouse-datasource
-
-
objectsettings.https
What certificate type to use with observability module.
This parameter completely overrides the
global.modules.httpssettings.Examples:
customCertificate: secretName: foobar mode: CustomCertificatecertManager: clusterIssuerName: letsencrypt mode: CertManager-
objectsettings.https.certManager
-
stringsettings.https.certManager.clusterIssuerName
What ClusterIssuer to use for the observability module.
Currently,
letsencrypt,letsencrypt-staging,selfsignedare available. Also, you can define your own.Default:
letsencrypt
-
-
objectsettings.https.customCertificate
Default:
{}-
stringsettings.https.customCertificate.secretName
The name of the secret in the
d8-systemnamespace to use with the observability module.This secret must have the kubernetes.io/tls format.
Default:
false
-
-
stringsettings.https.mode
The HTTPS usage mode:
Disabled— the observability module will work over HTTP only;CertManager— the observability module will use HTTPS and get a certificate from the clusterissuer defined in thecertManager.clusterIssuerNameparameter.CustomCertificate— the observability module will use HTTPS using the certificate from thed8-systemnamespace.OnlyInURI— the observability module will work over HTTP (thinking that there is an external HTTPS load balancer in front that terminates HTTPS traffic). All the links in theuser-authnwill be generated using the HTTPS scheme. Load balancer should provide a redirect from HTTP to HTTPS.
Default:
DisabledAllowed values:
Disabled,CertManager,CustomCertificate,OnlyInURI
-
-
stringsettings.ingressClass
The ingress class to use for all ingress resources created by the observability module.
This parameter completely overrides the
global.modules.ingressClasssettings. If not specified, the global ingress class configuration will be used.The value must be a valid Kubernetes resource name (lowercase alphanumeric characters or hyphens, must start and end with alphanumeric character).
Pattern:
^[a-z0-9]([-a-z0-9]*[a-z0-9])?$Examples:
ingressClass: nginxingressClass: nginx-external -
objectsettings.lightweightLogsSettings for lightweight logs collection directly from kubelet.
Default:
{}-
booleansettings.lightweightLogs.enabledWhether to enable lightweight logs collection from kubelet.
Default:
true
-
-
objectsettings.polkAnnotationsSettings for Polk-specific alert annotations handling.
Default:
{}-
booleansettings.polkAnnotations.enabled
Whether to keep Polk-specific alert annotations (with the
plk_prefix) in incoming alerts.When enabled (default),
plk_*annotations are preserved in alerts for all notification receivers. When disabled, allplk_*annotations are removed from alerts when sending notifications to any receiver.Default:
true
-
-