The Deckhouse Kubernetes Platform (DKP) web UI provides access to cluster management, including monitoring, parameter configuration, node and module management, as well as security and network configuration. Most operations available from the command line through the d8 utility (Deckhouse CLI) or kubectl can also be performed through the web UI.
Accessing the web UI
To open the web UI, do as follows:
-
Enter
console.<CLUSTER_NAME_TEMPLATE>in the browser address bar, where<CLUSTER_NAME_TEMPLATE>is a string corresponding to the cluster DNS name template specified in the global parametermodules.publicDomainTemplate. The address format may differ depending on the system configuration. Contact your administrator to find out the URL. -
During the first login, enter the user credentials provided by the security administrator. After successful authentication, the main page of the web UI opens. The page contains the following sections:
Deckhouse
“Overview” subsection
The “Overview” subsection contains key information about the Deckhouse Kubernetes Platform (DKP) cluster and its components.
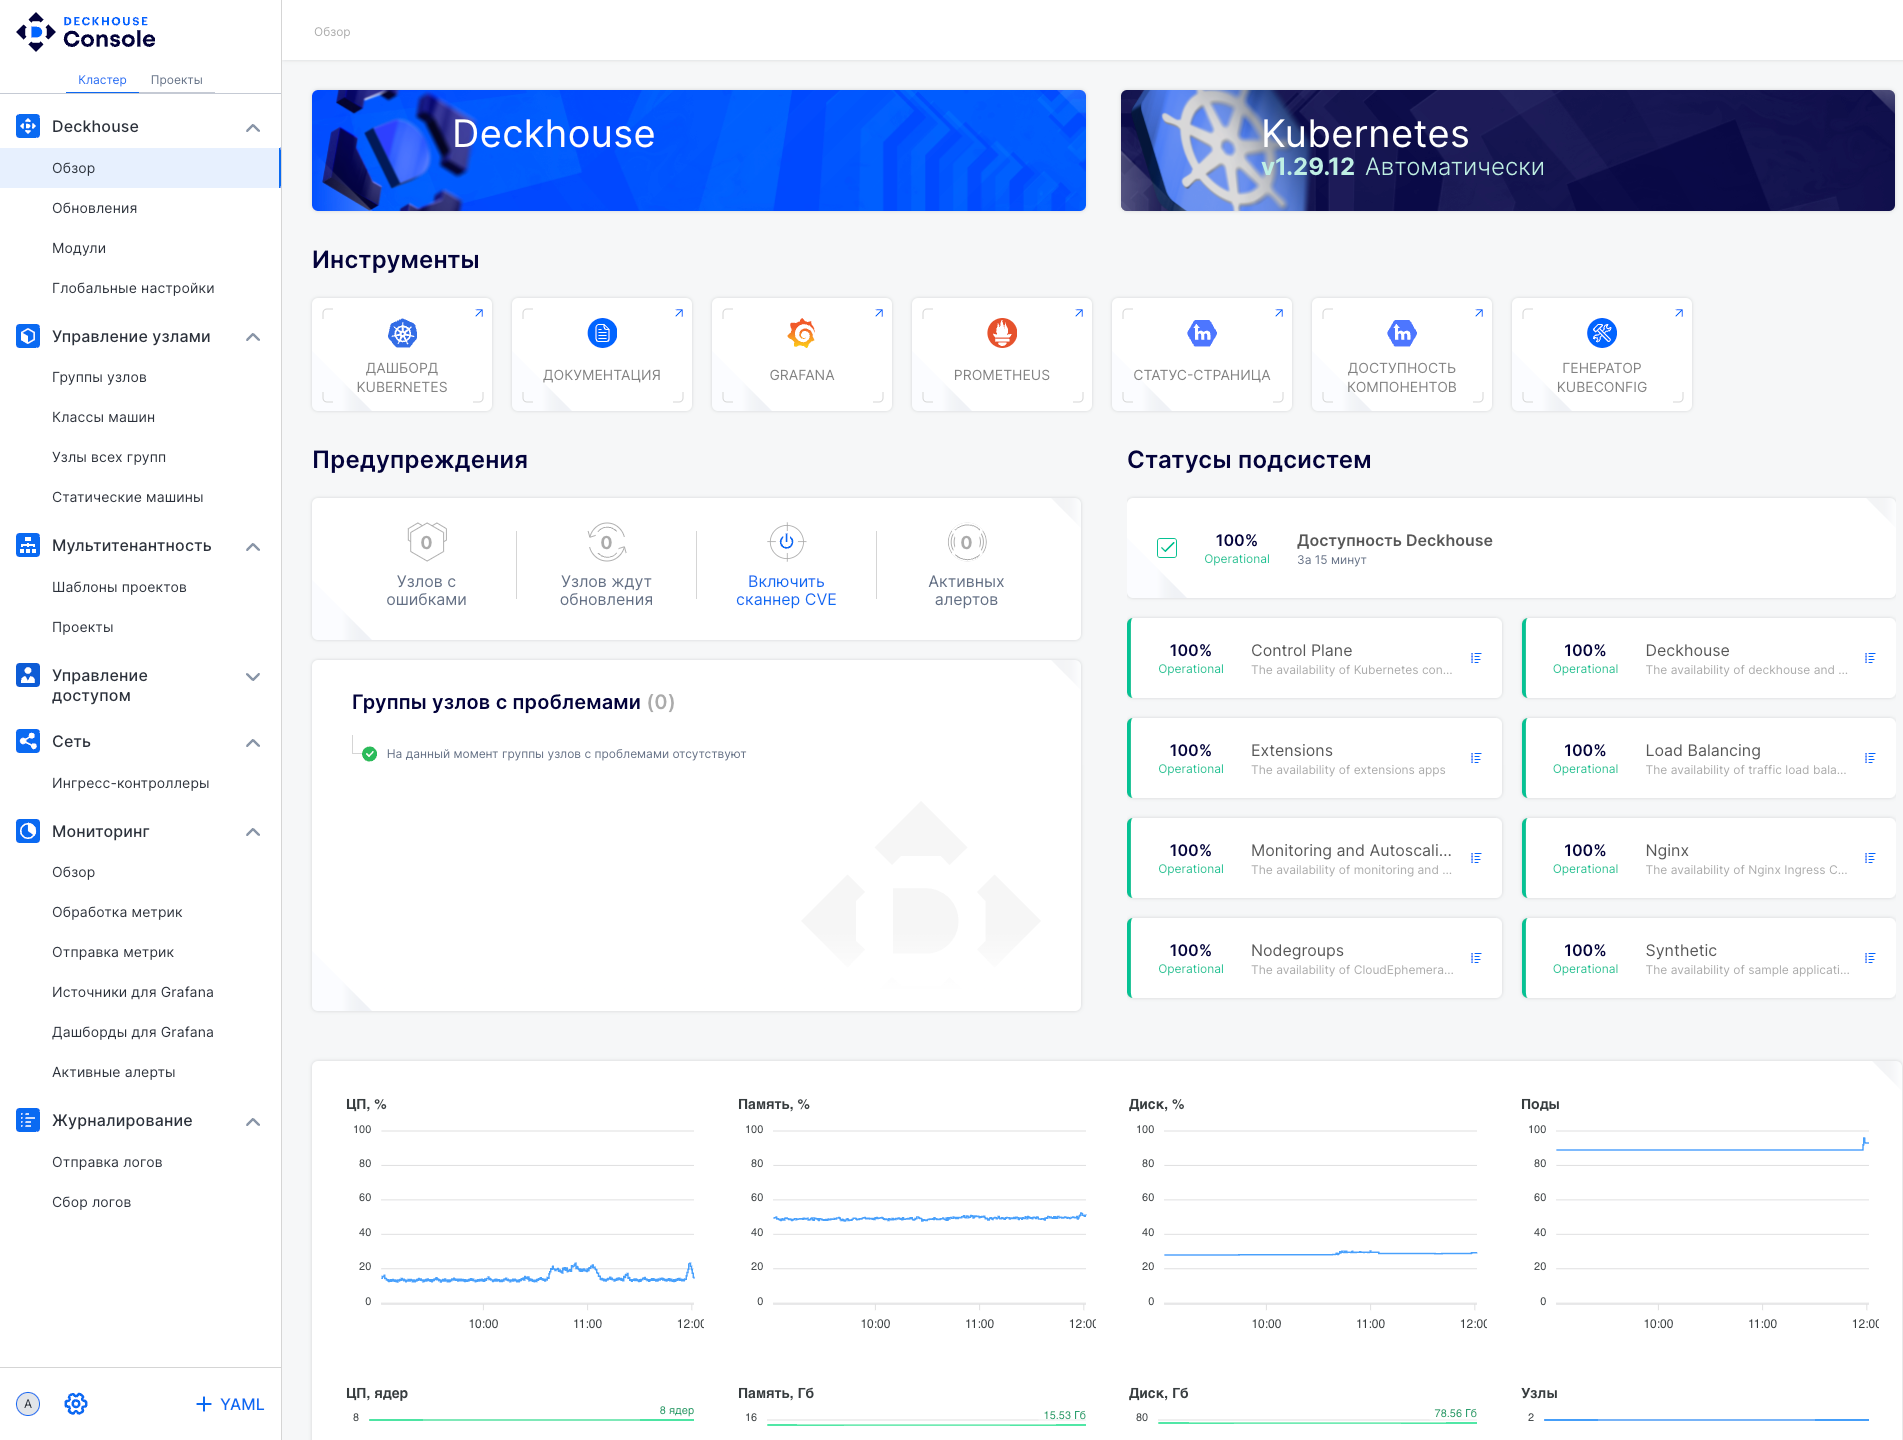
Main elements of the web UI:
- “Deckhouse” and “Kubernetes” panels: Display the current Kubernetes version and general platform information.
- “Tools” panel: Contains buttons for quick access to the following sections:
- “Kubernetes dashboard”
- “Documentation”
- “Grafana” (metrics monitoring)
- “Prometheus” (metrics collection and storage)
- “Status page”
- “Component availability”
- “Kubeconfig generator”
- “Warnings” panel: Displays errors, pending updates, and active alerts.
- “Node groups with issues” panel: Analyzes node health and displays problematic groups.
- “Subsystem statuses” panel: Displays the state of cluster services.
- Resource monitoring: Includes charts and indicators showing load changes.
- Sidebar menu: Navigation through the main sections (the visibility of sections depends on the user access level).
- User menu (bottom left):
- User information
- Settings (changing system parameters and viewing the web UI version)
- YAML editor for configuration management
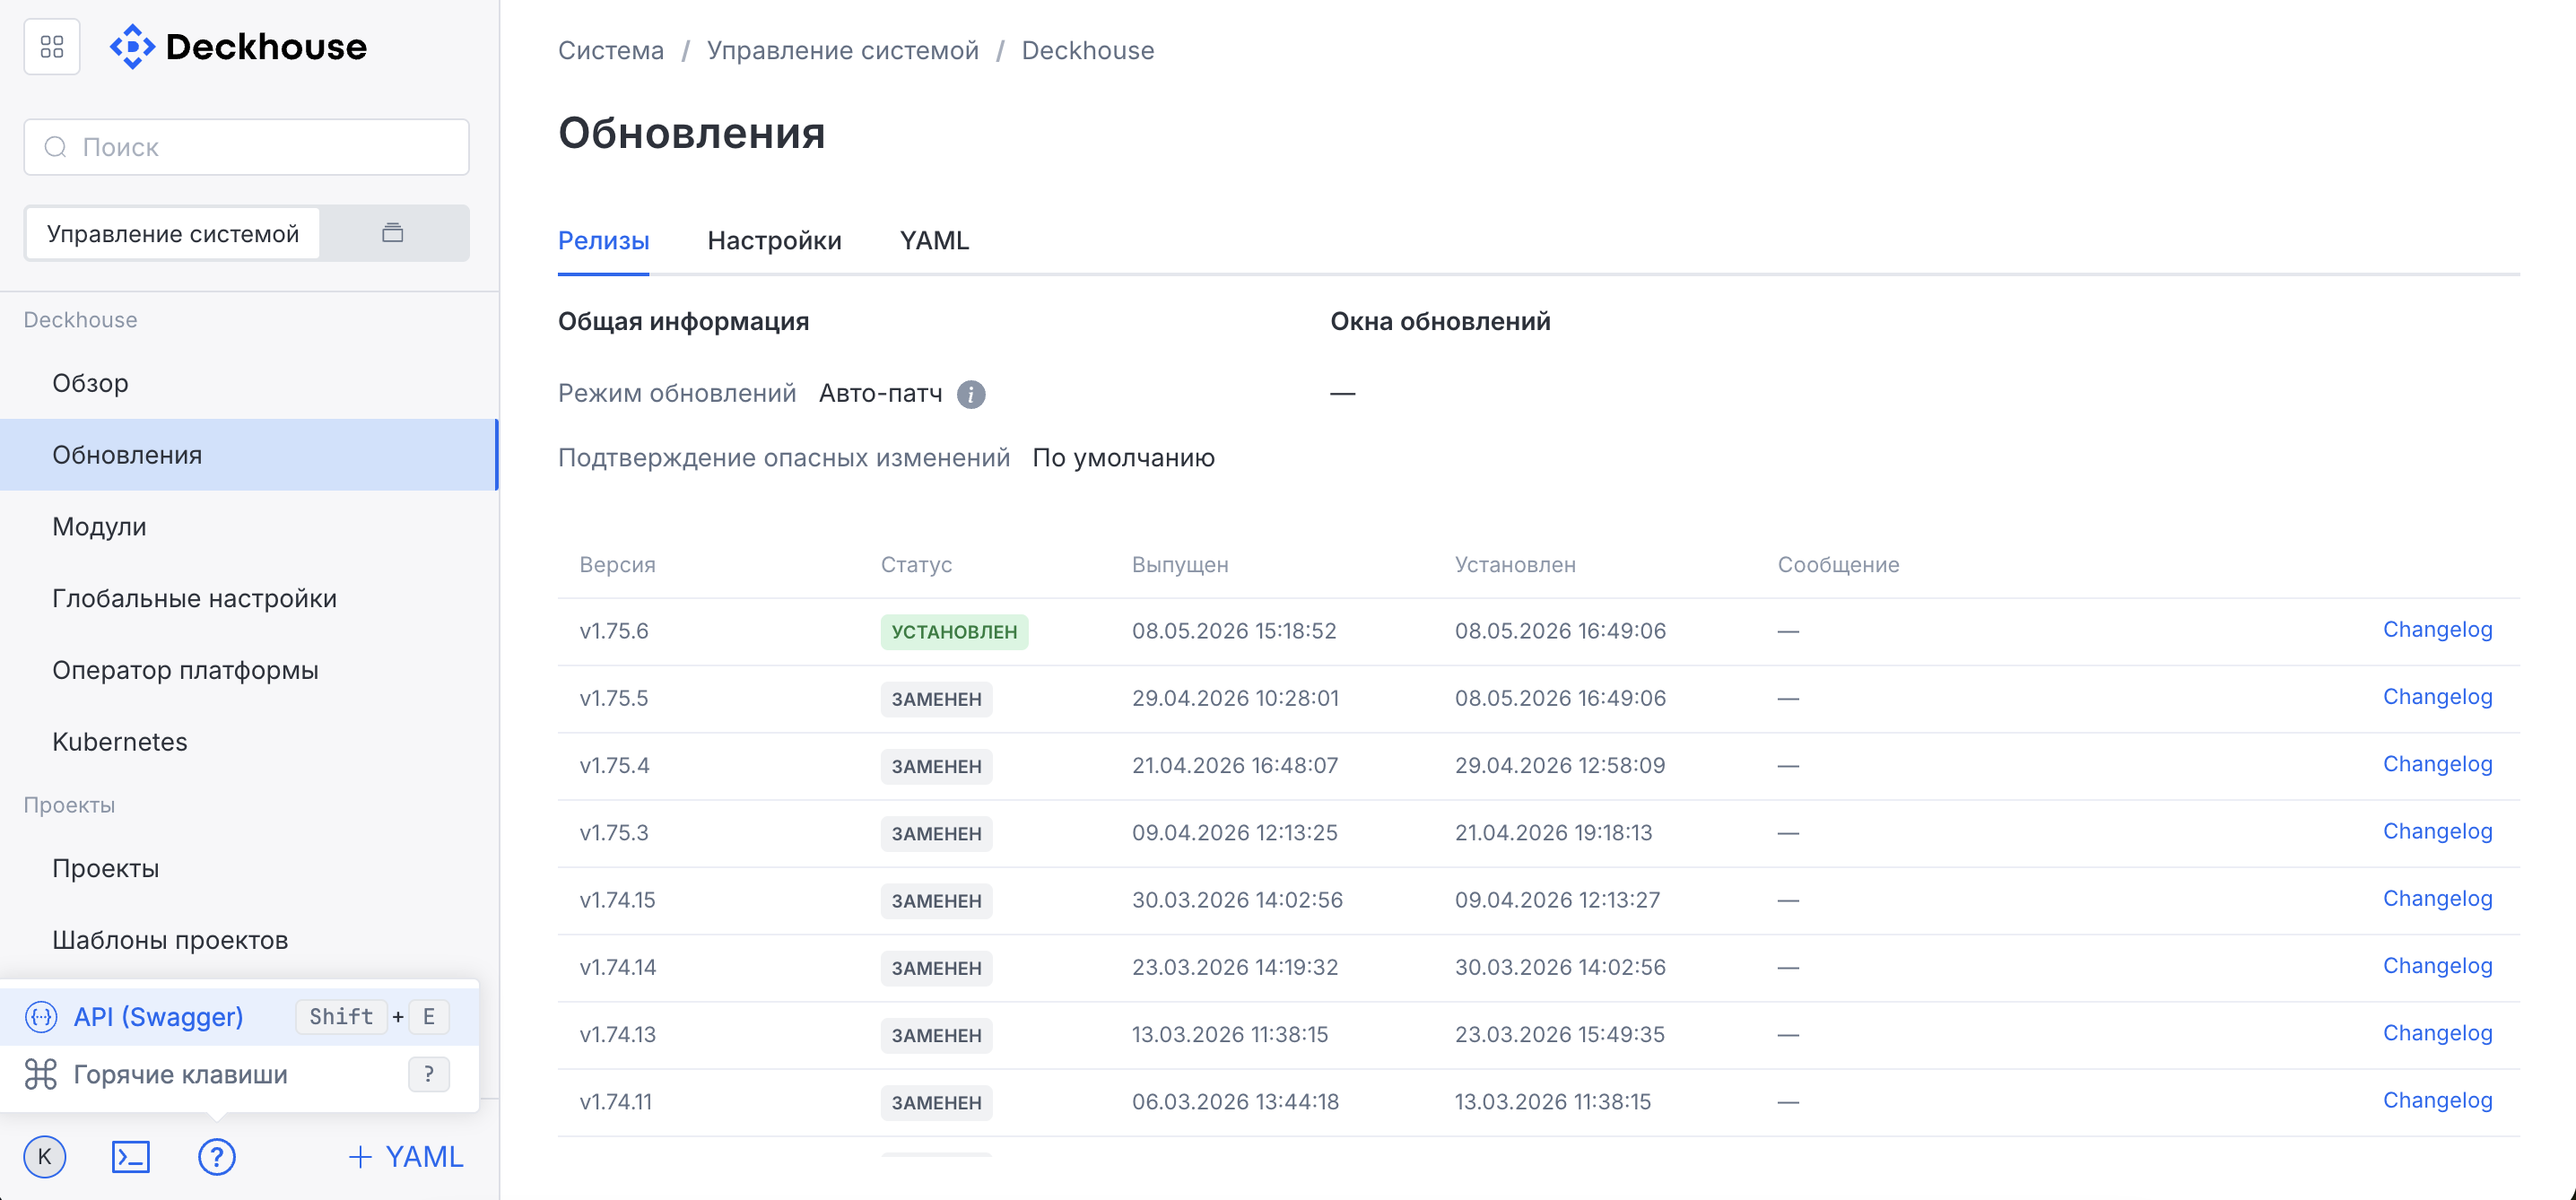
“Updates” subsection
The “Updates” subsection contains information about DKP releases.
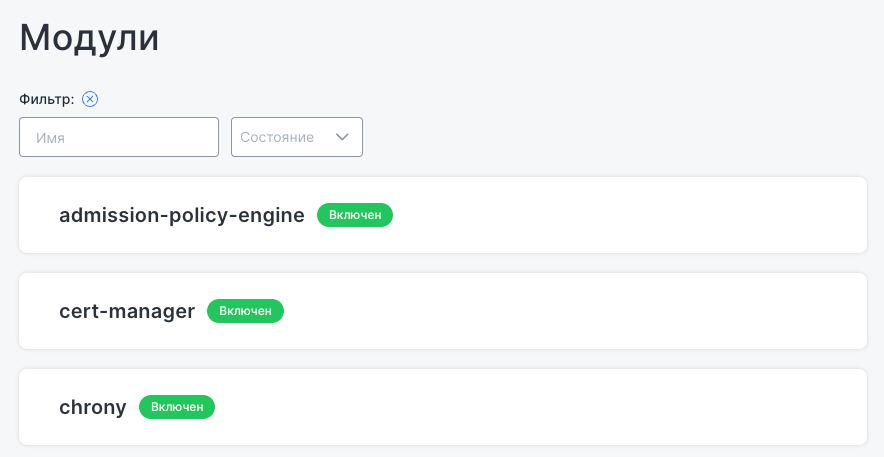
“Modules” subsection
The “Modules” subsection lists enabled and disabled modules. A filter is available to search for a required module.
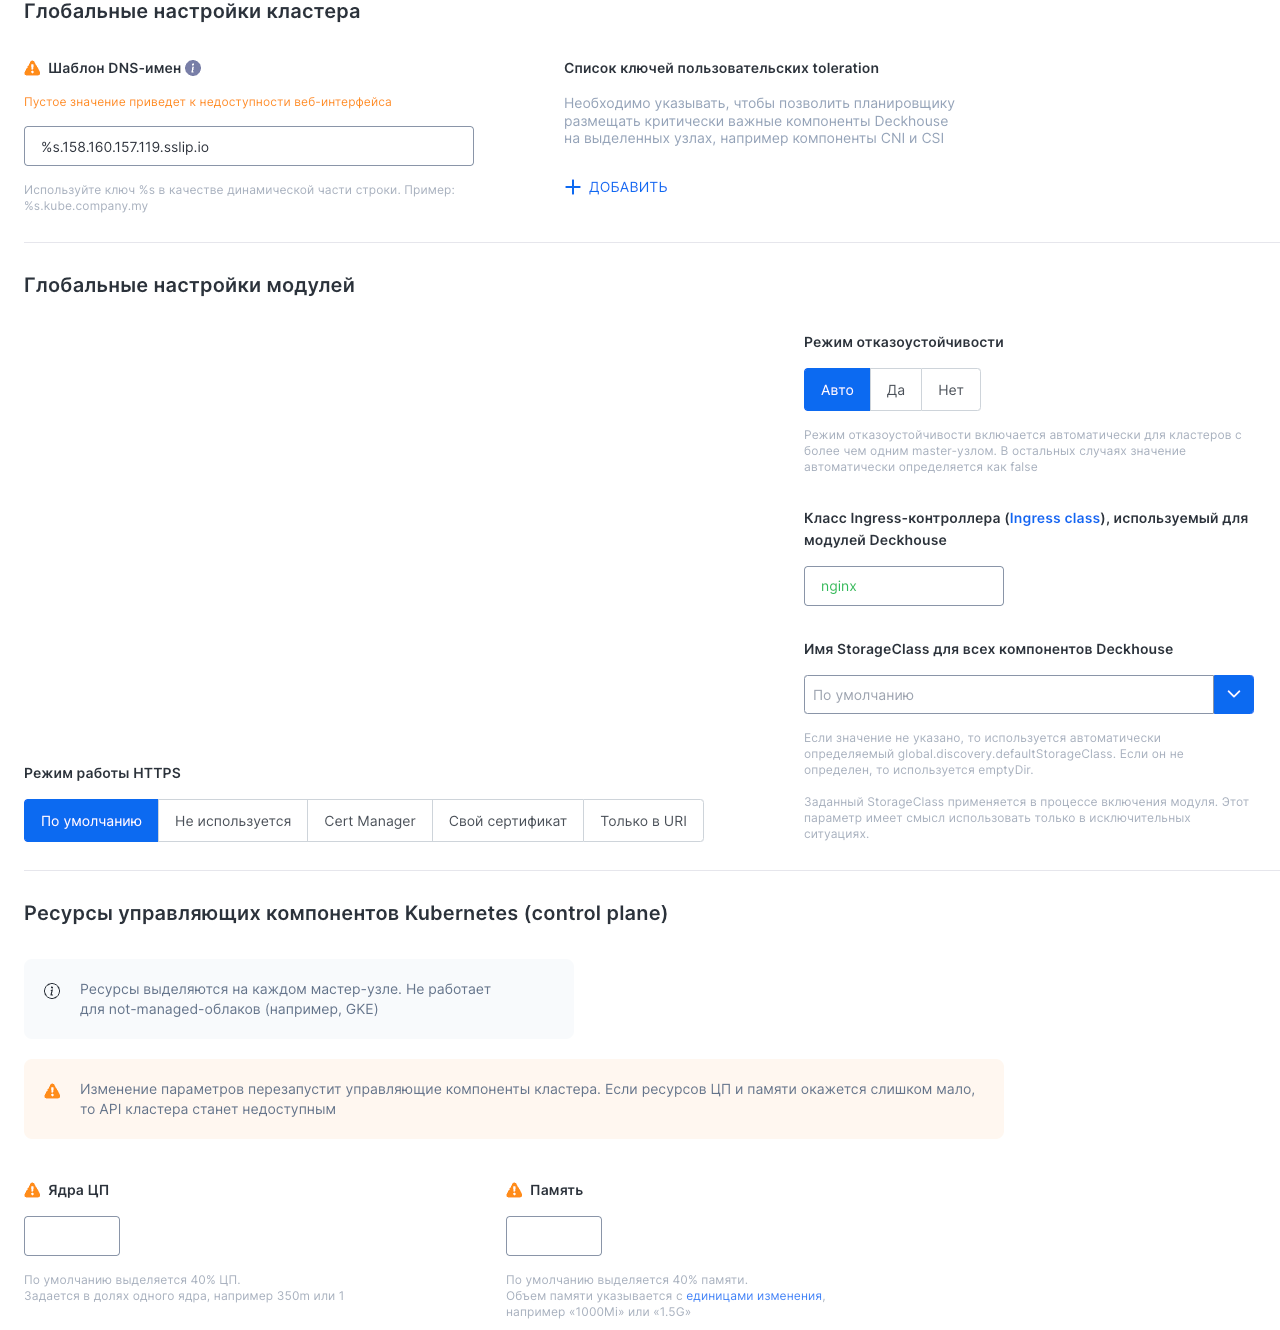
“Global settings” subsection
This subsection provides access to critical DKP cluster settings:
- “Global cluster settings”: Configuration of the DNS name template and the list of tolerations.
- “Global module settings”: Configuration of the high availability mode, and fields for specifying IngressClass and StorageClass.
- “HTTPS operating mode”: Configuration of security certificates.
- “Kubernetes control plane component resources”: Configuration of the number of allocated CPU cores and memory size.
These settings affect cluster stability, security, and fault tolerance, so modify them with caution.
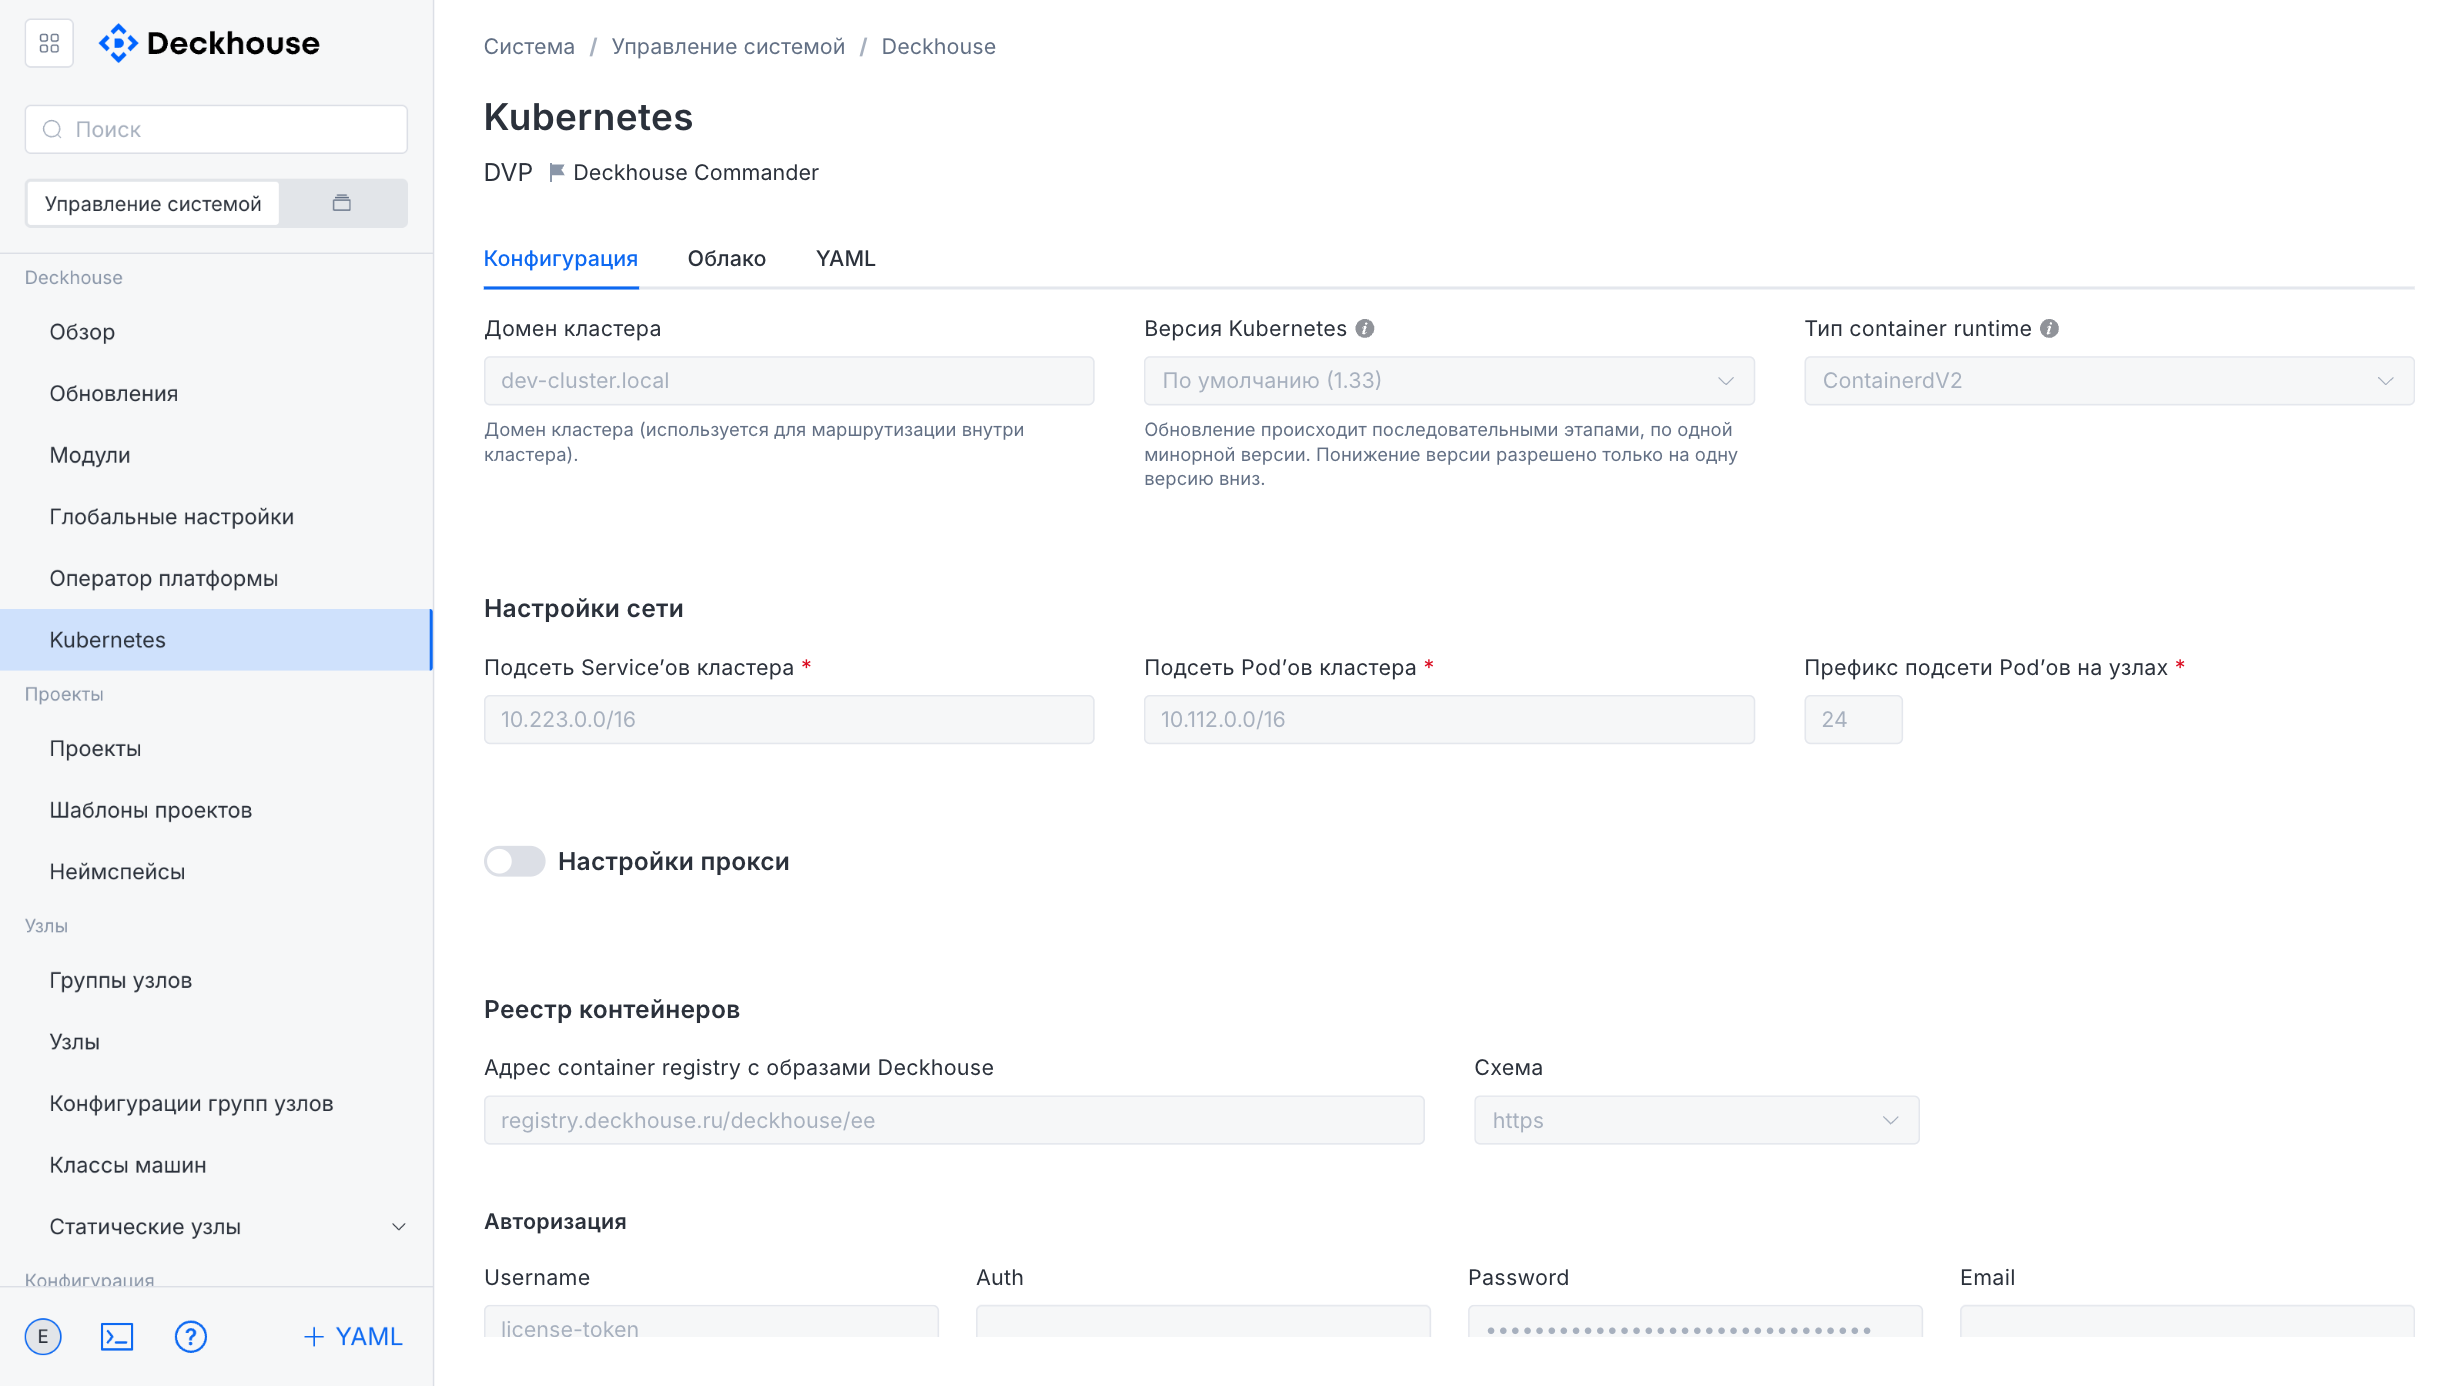
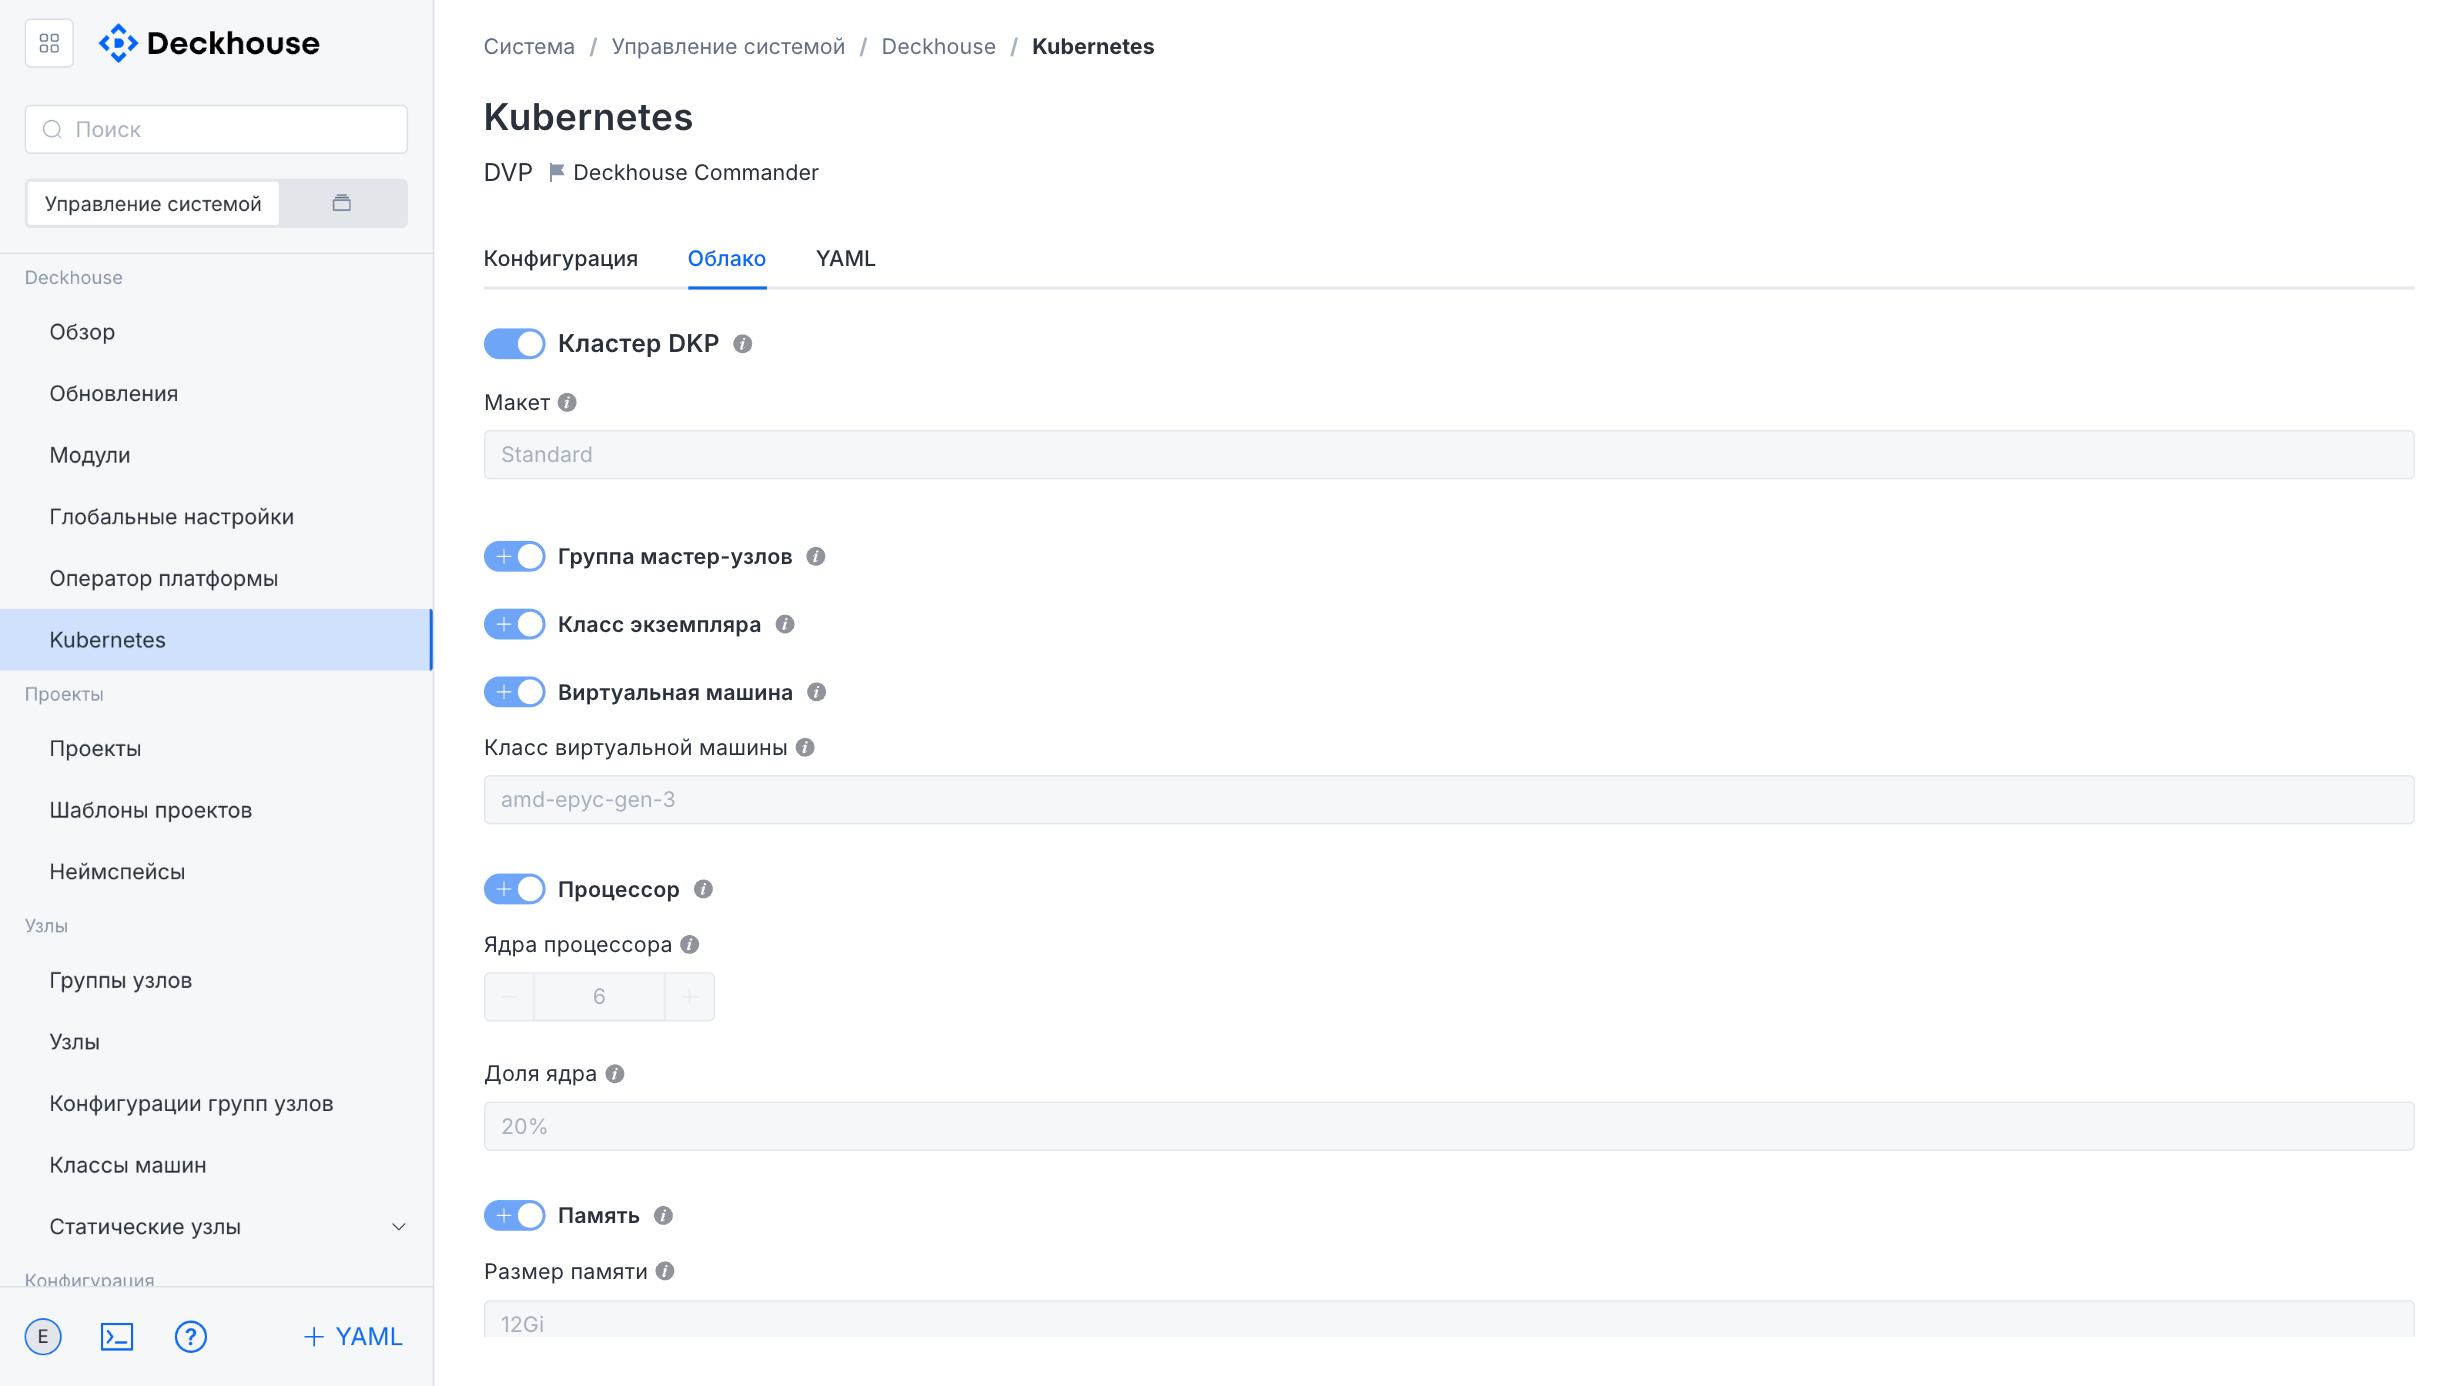
Kubernetes
The tabs in the “Kubernetes” subsection contain basic information about the Kubernetes cluster.
Node management
“Node groups” subsection
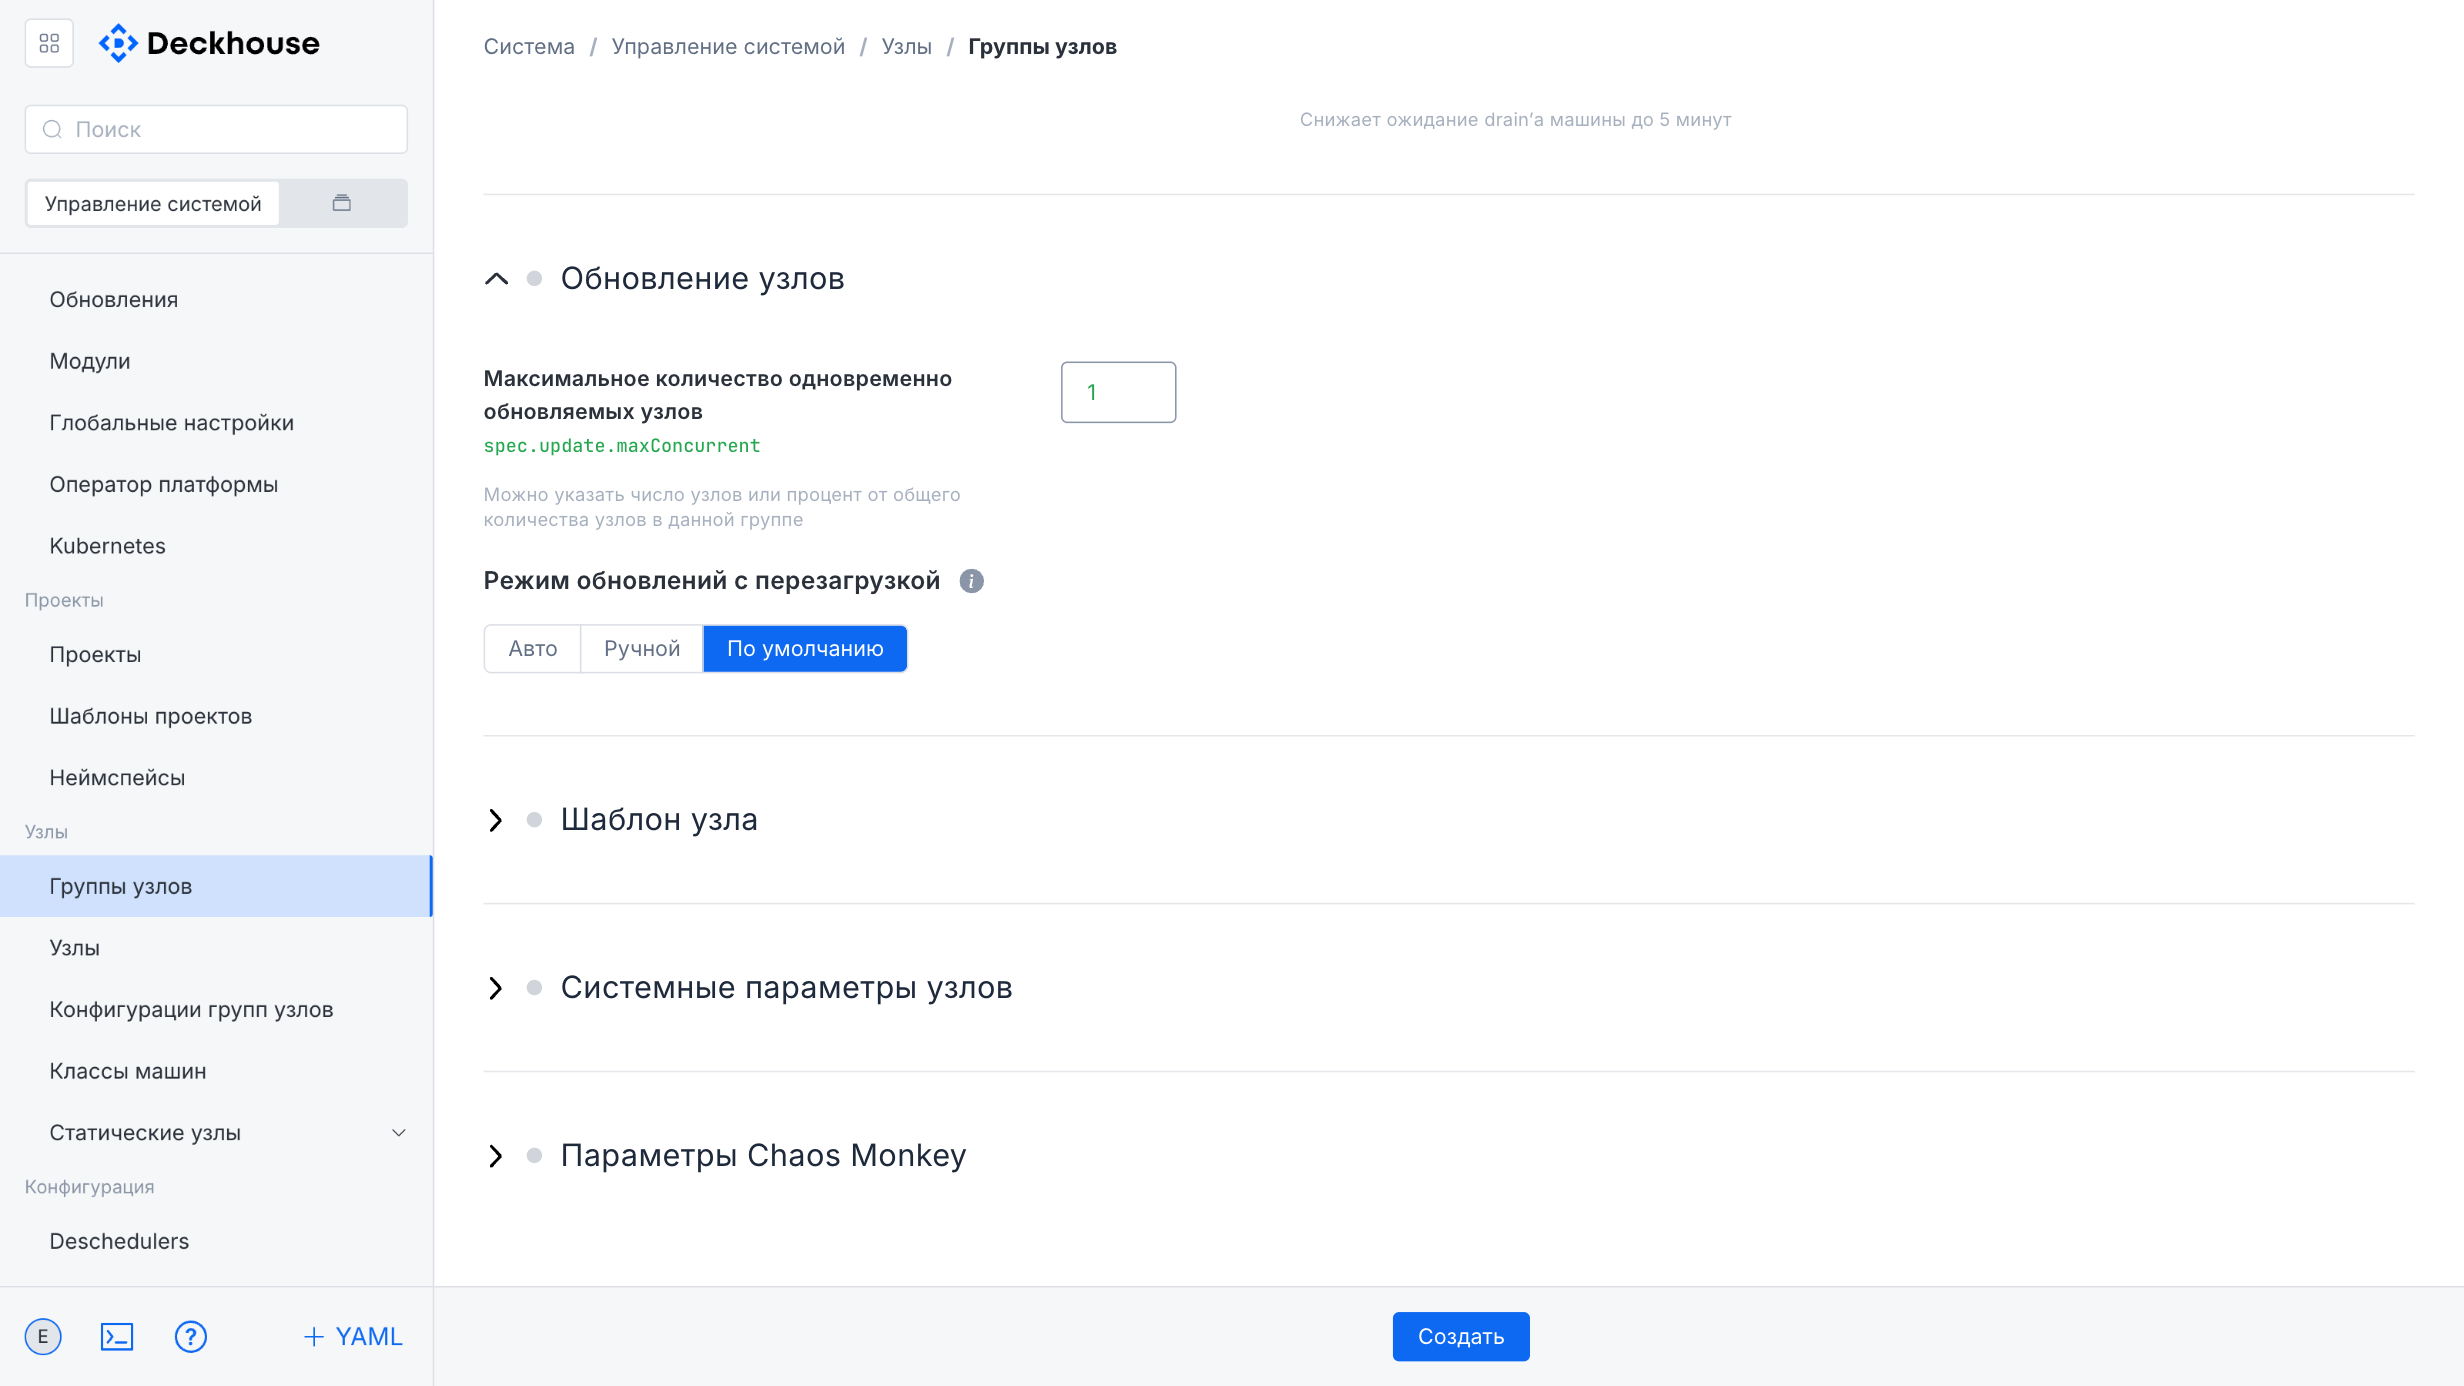
The settings in this subsection let you manage Kubernetes node groups, monitor their state, and add new groups.
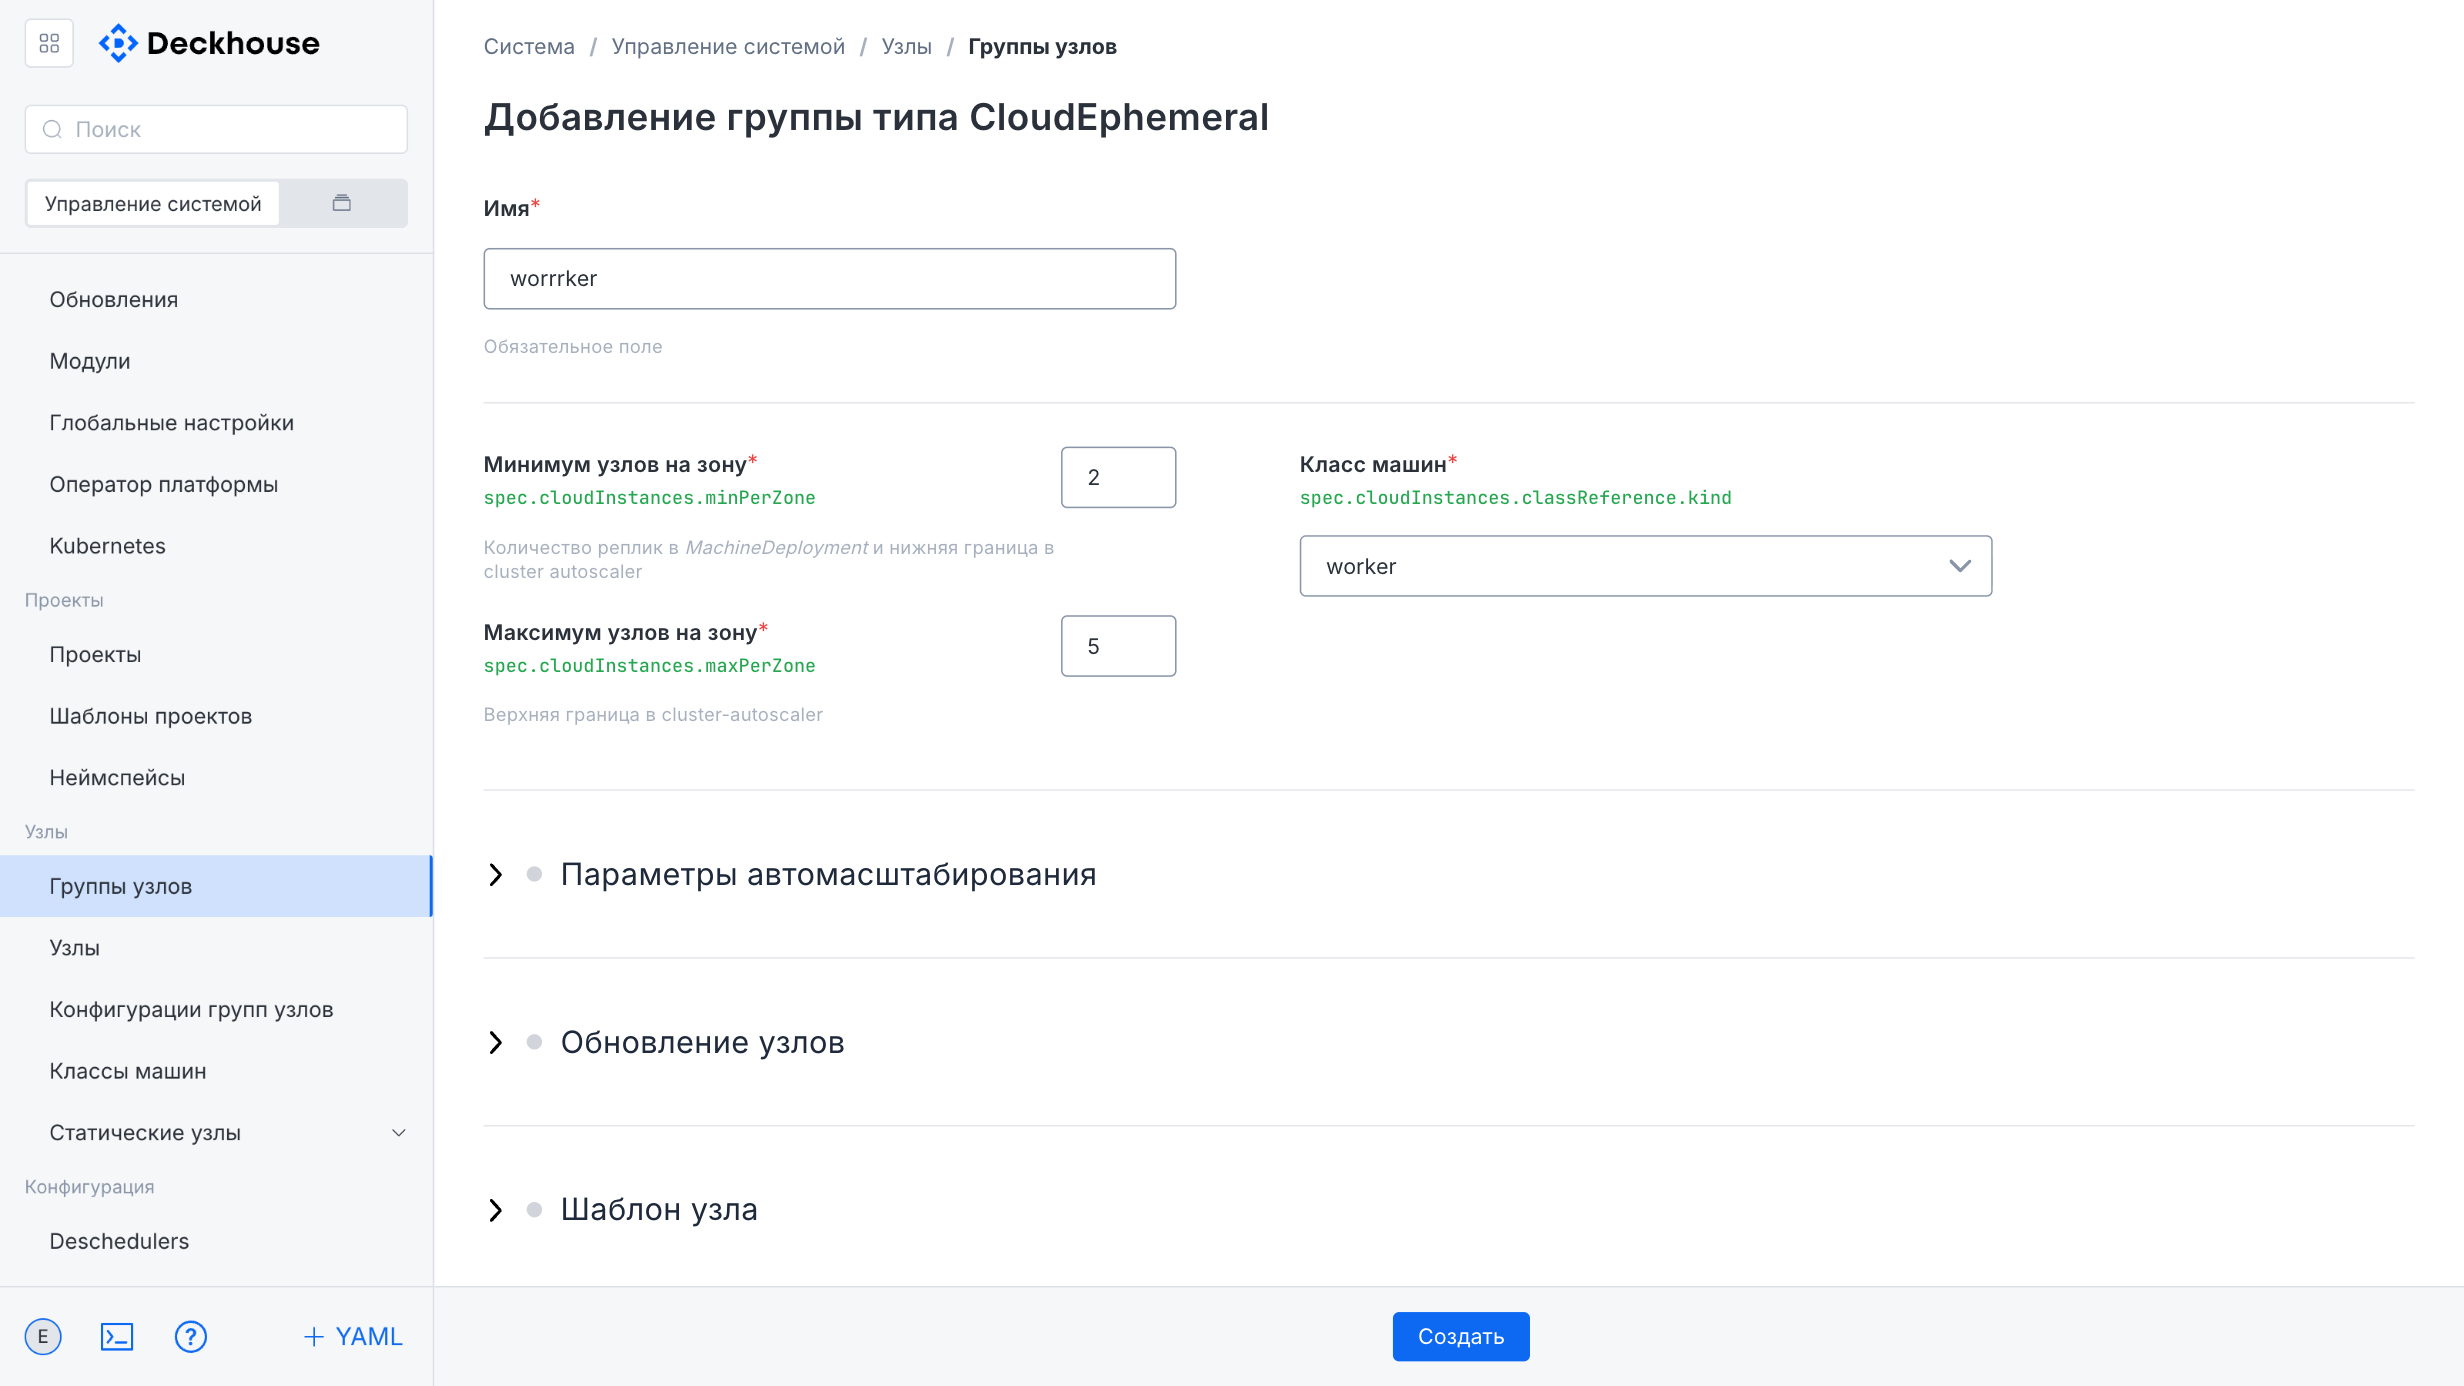
The node group creation form contains the following fields:
- “Name”
- “Node count”
- “Static instance selector” (cannot be changed after creation)
- “Label expressions”
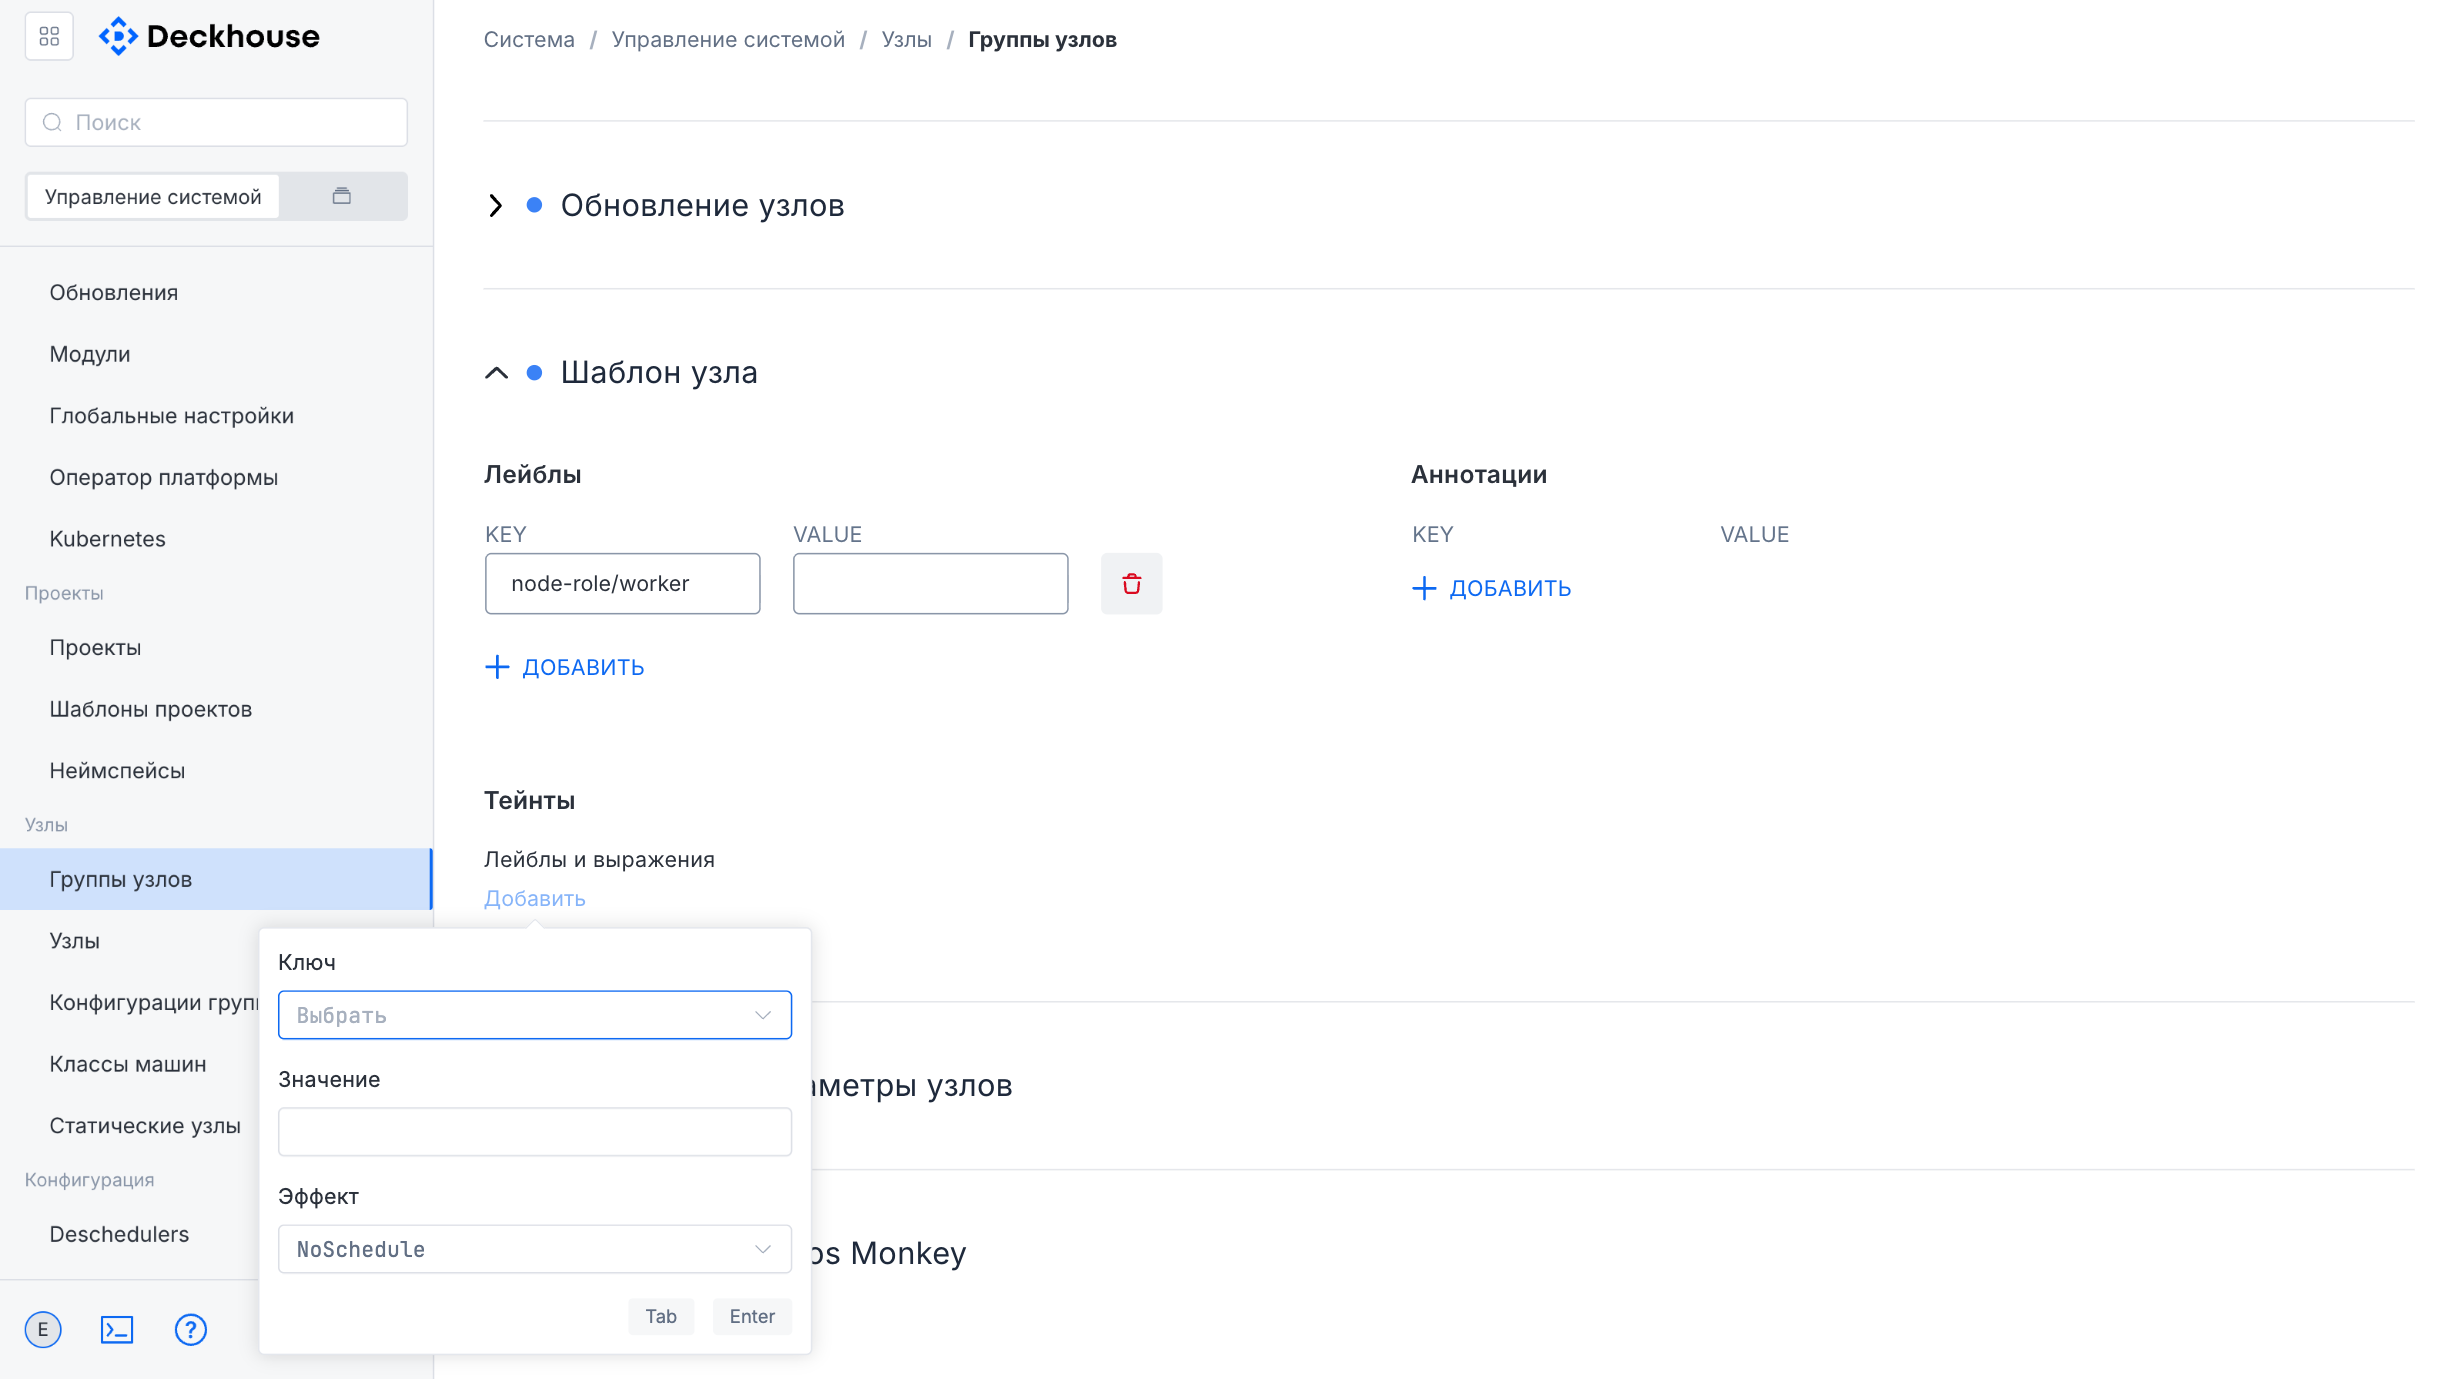
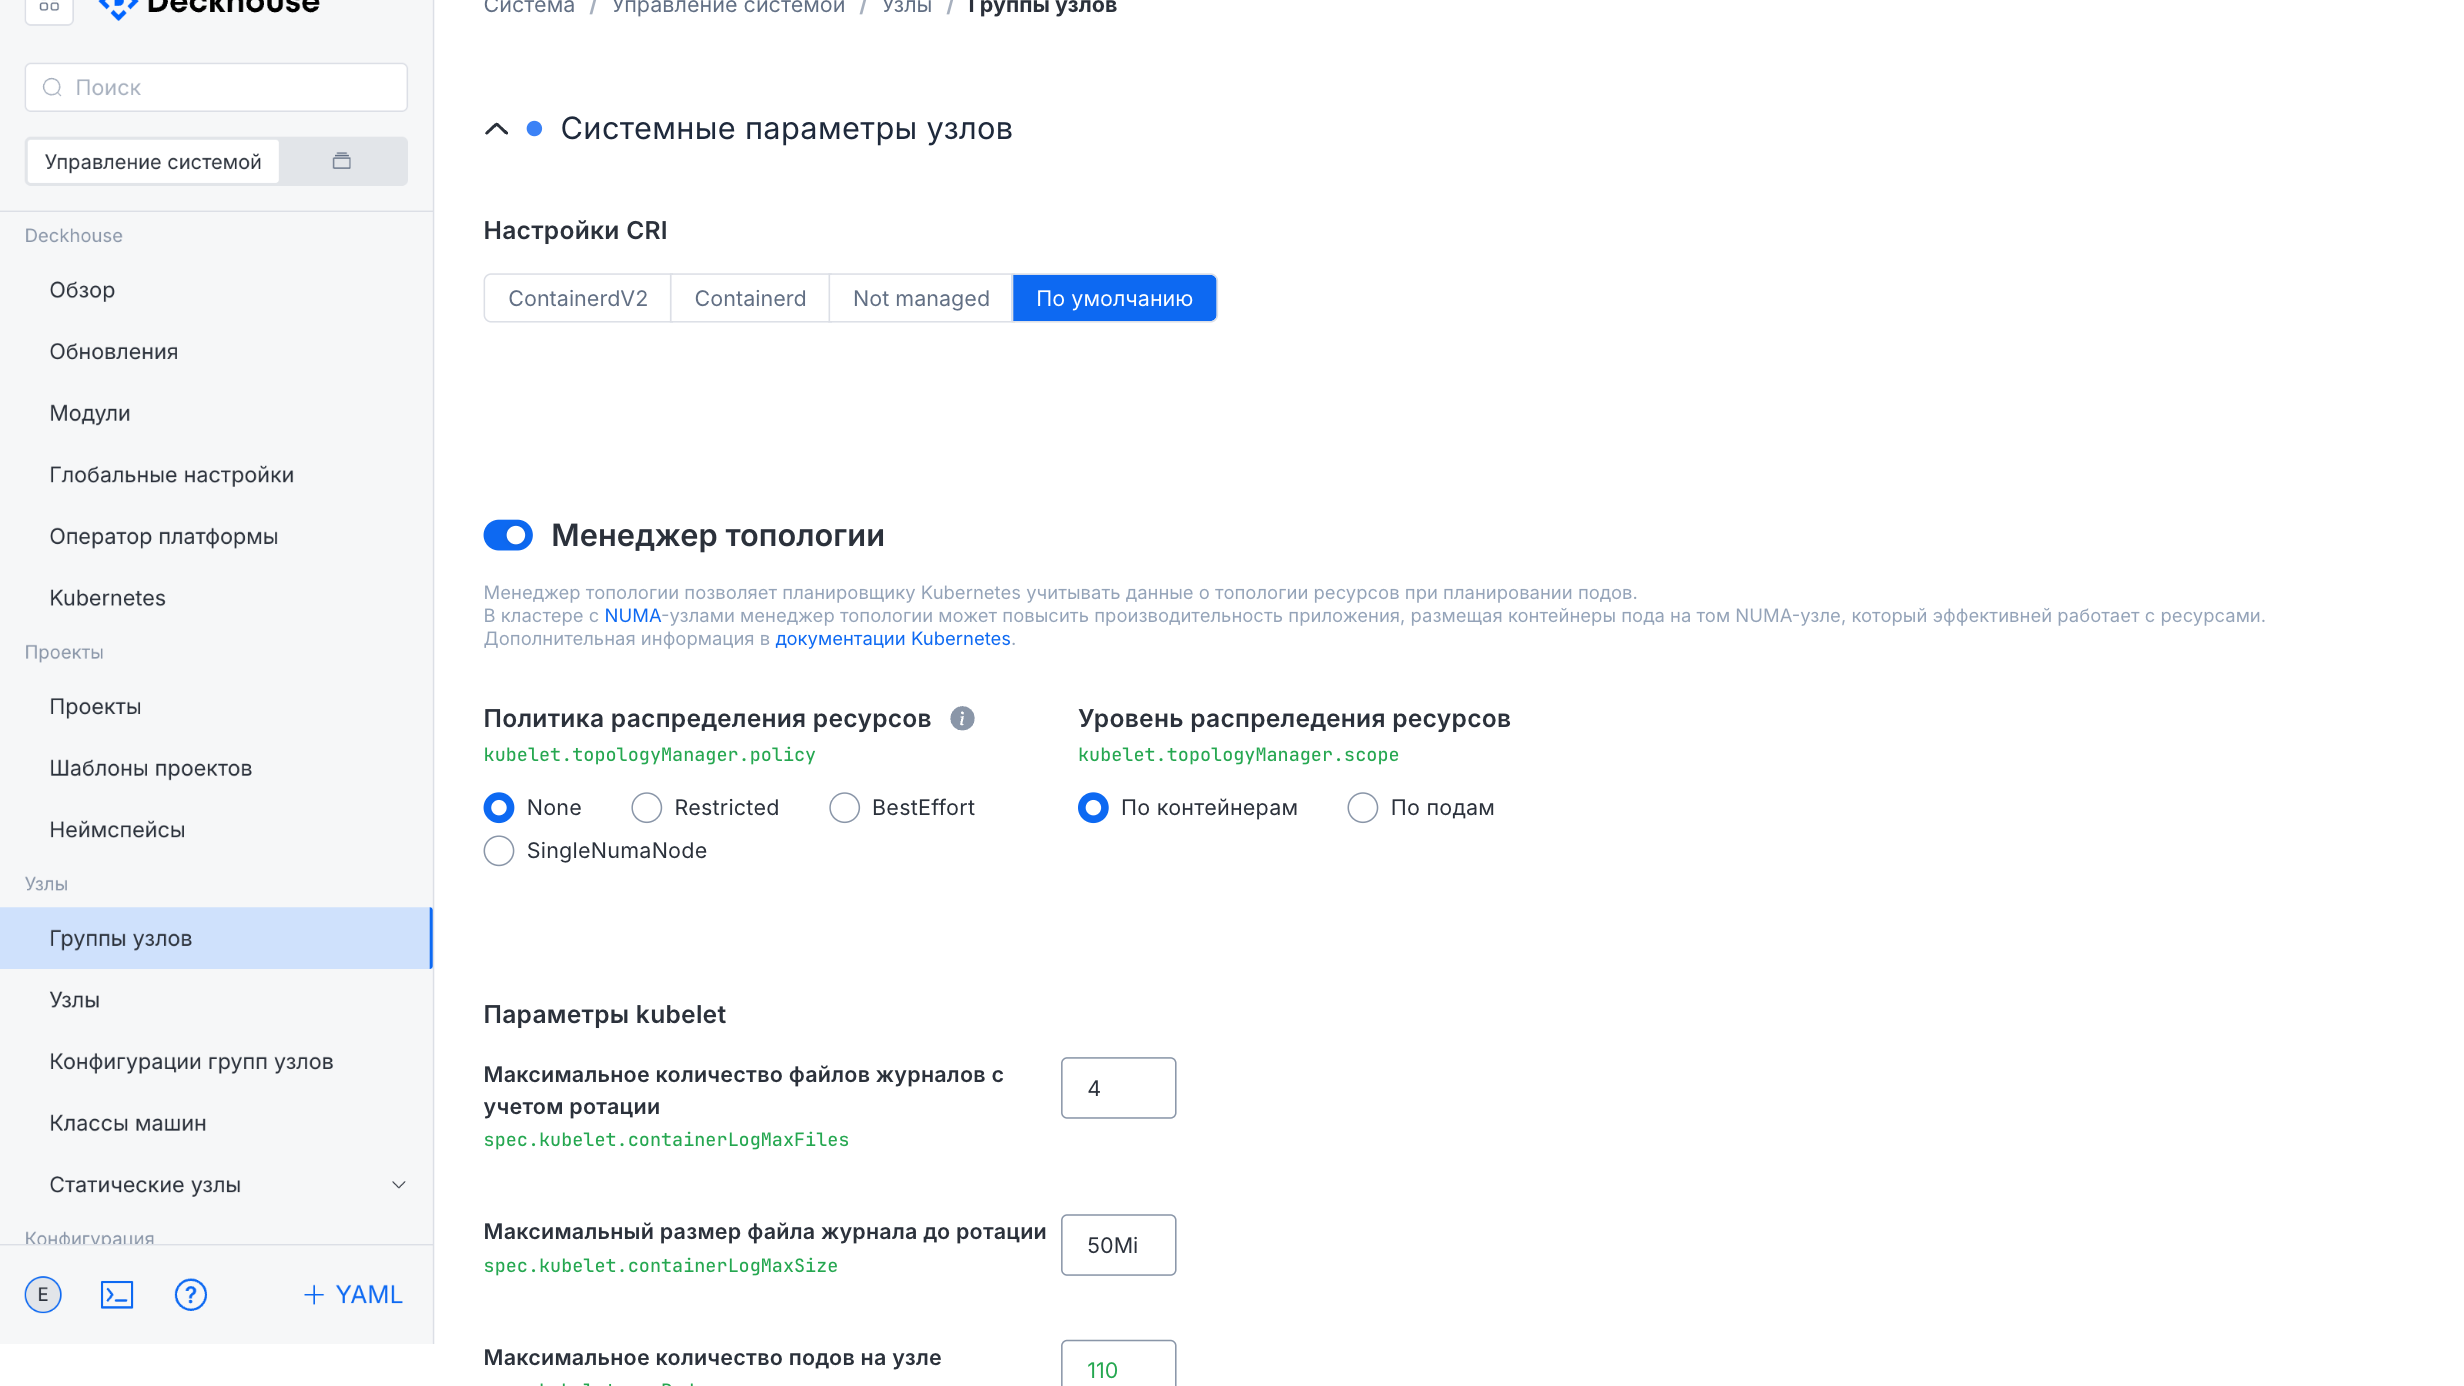
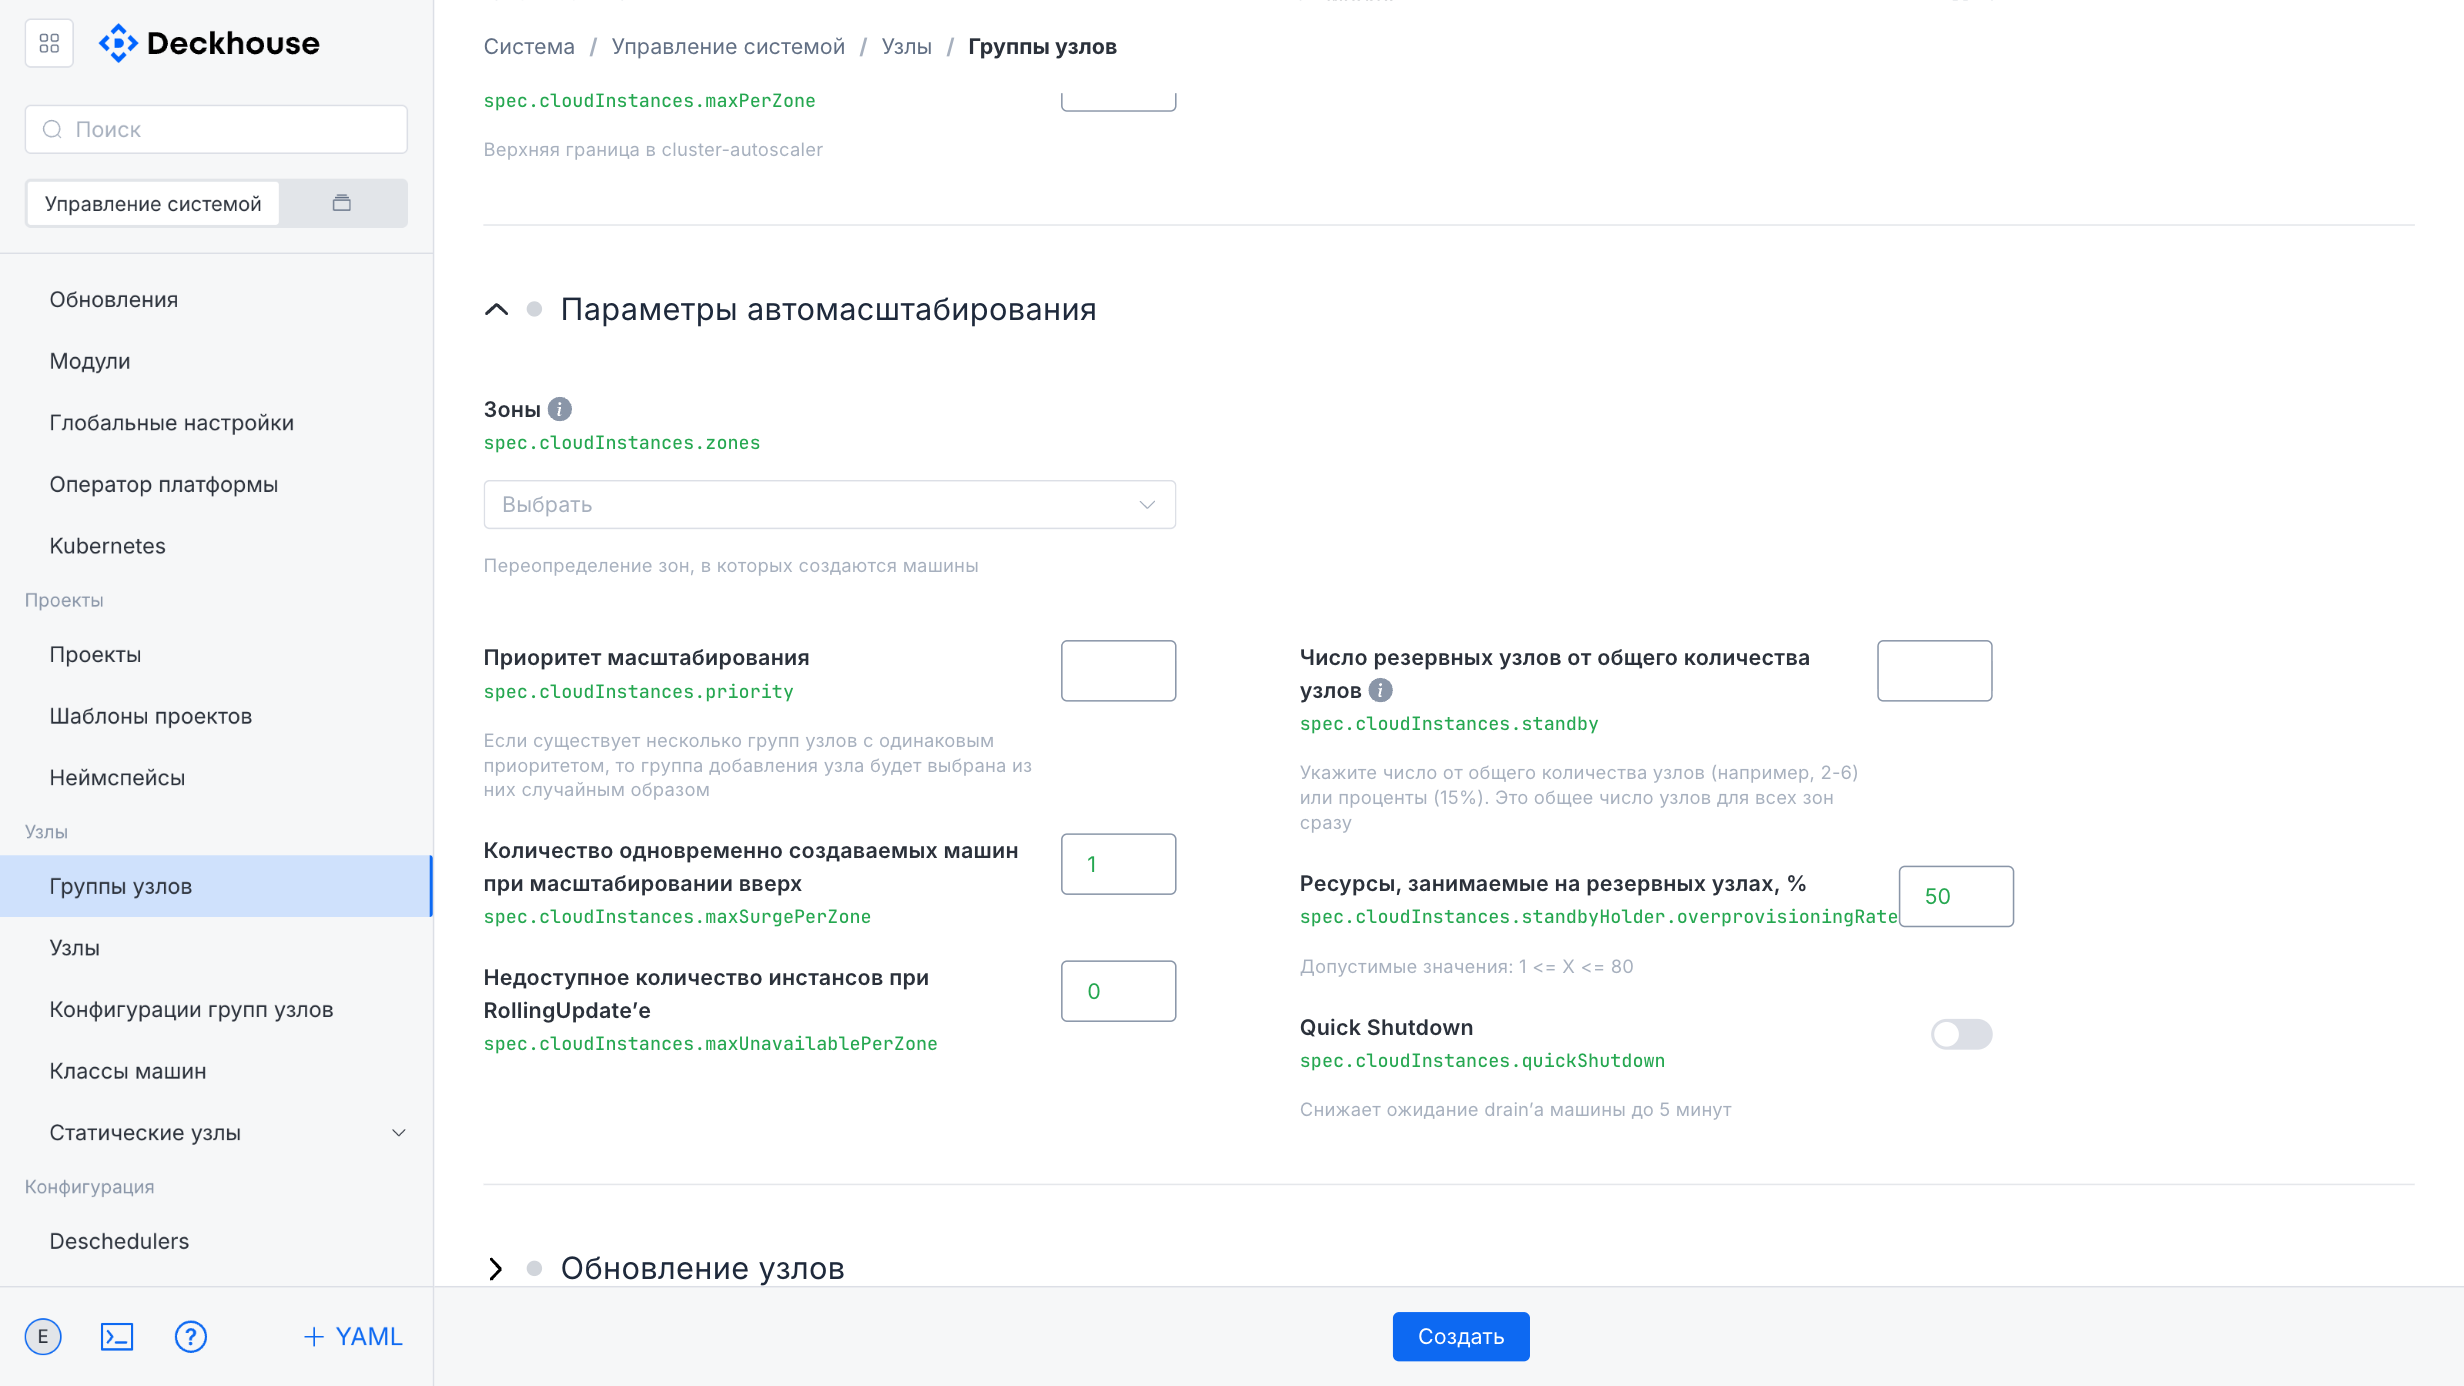
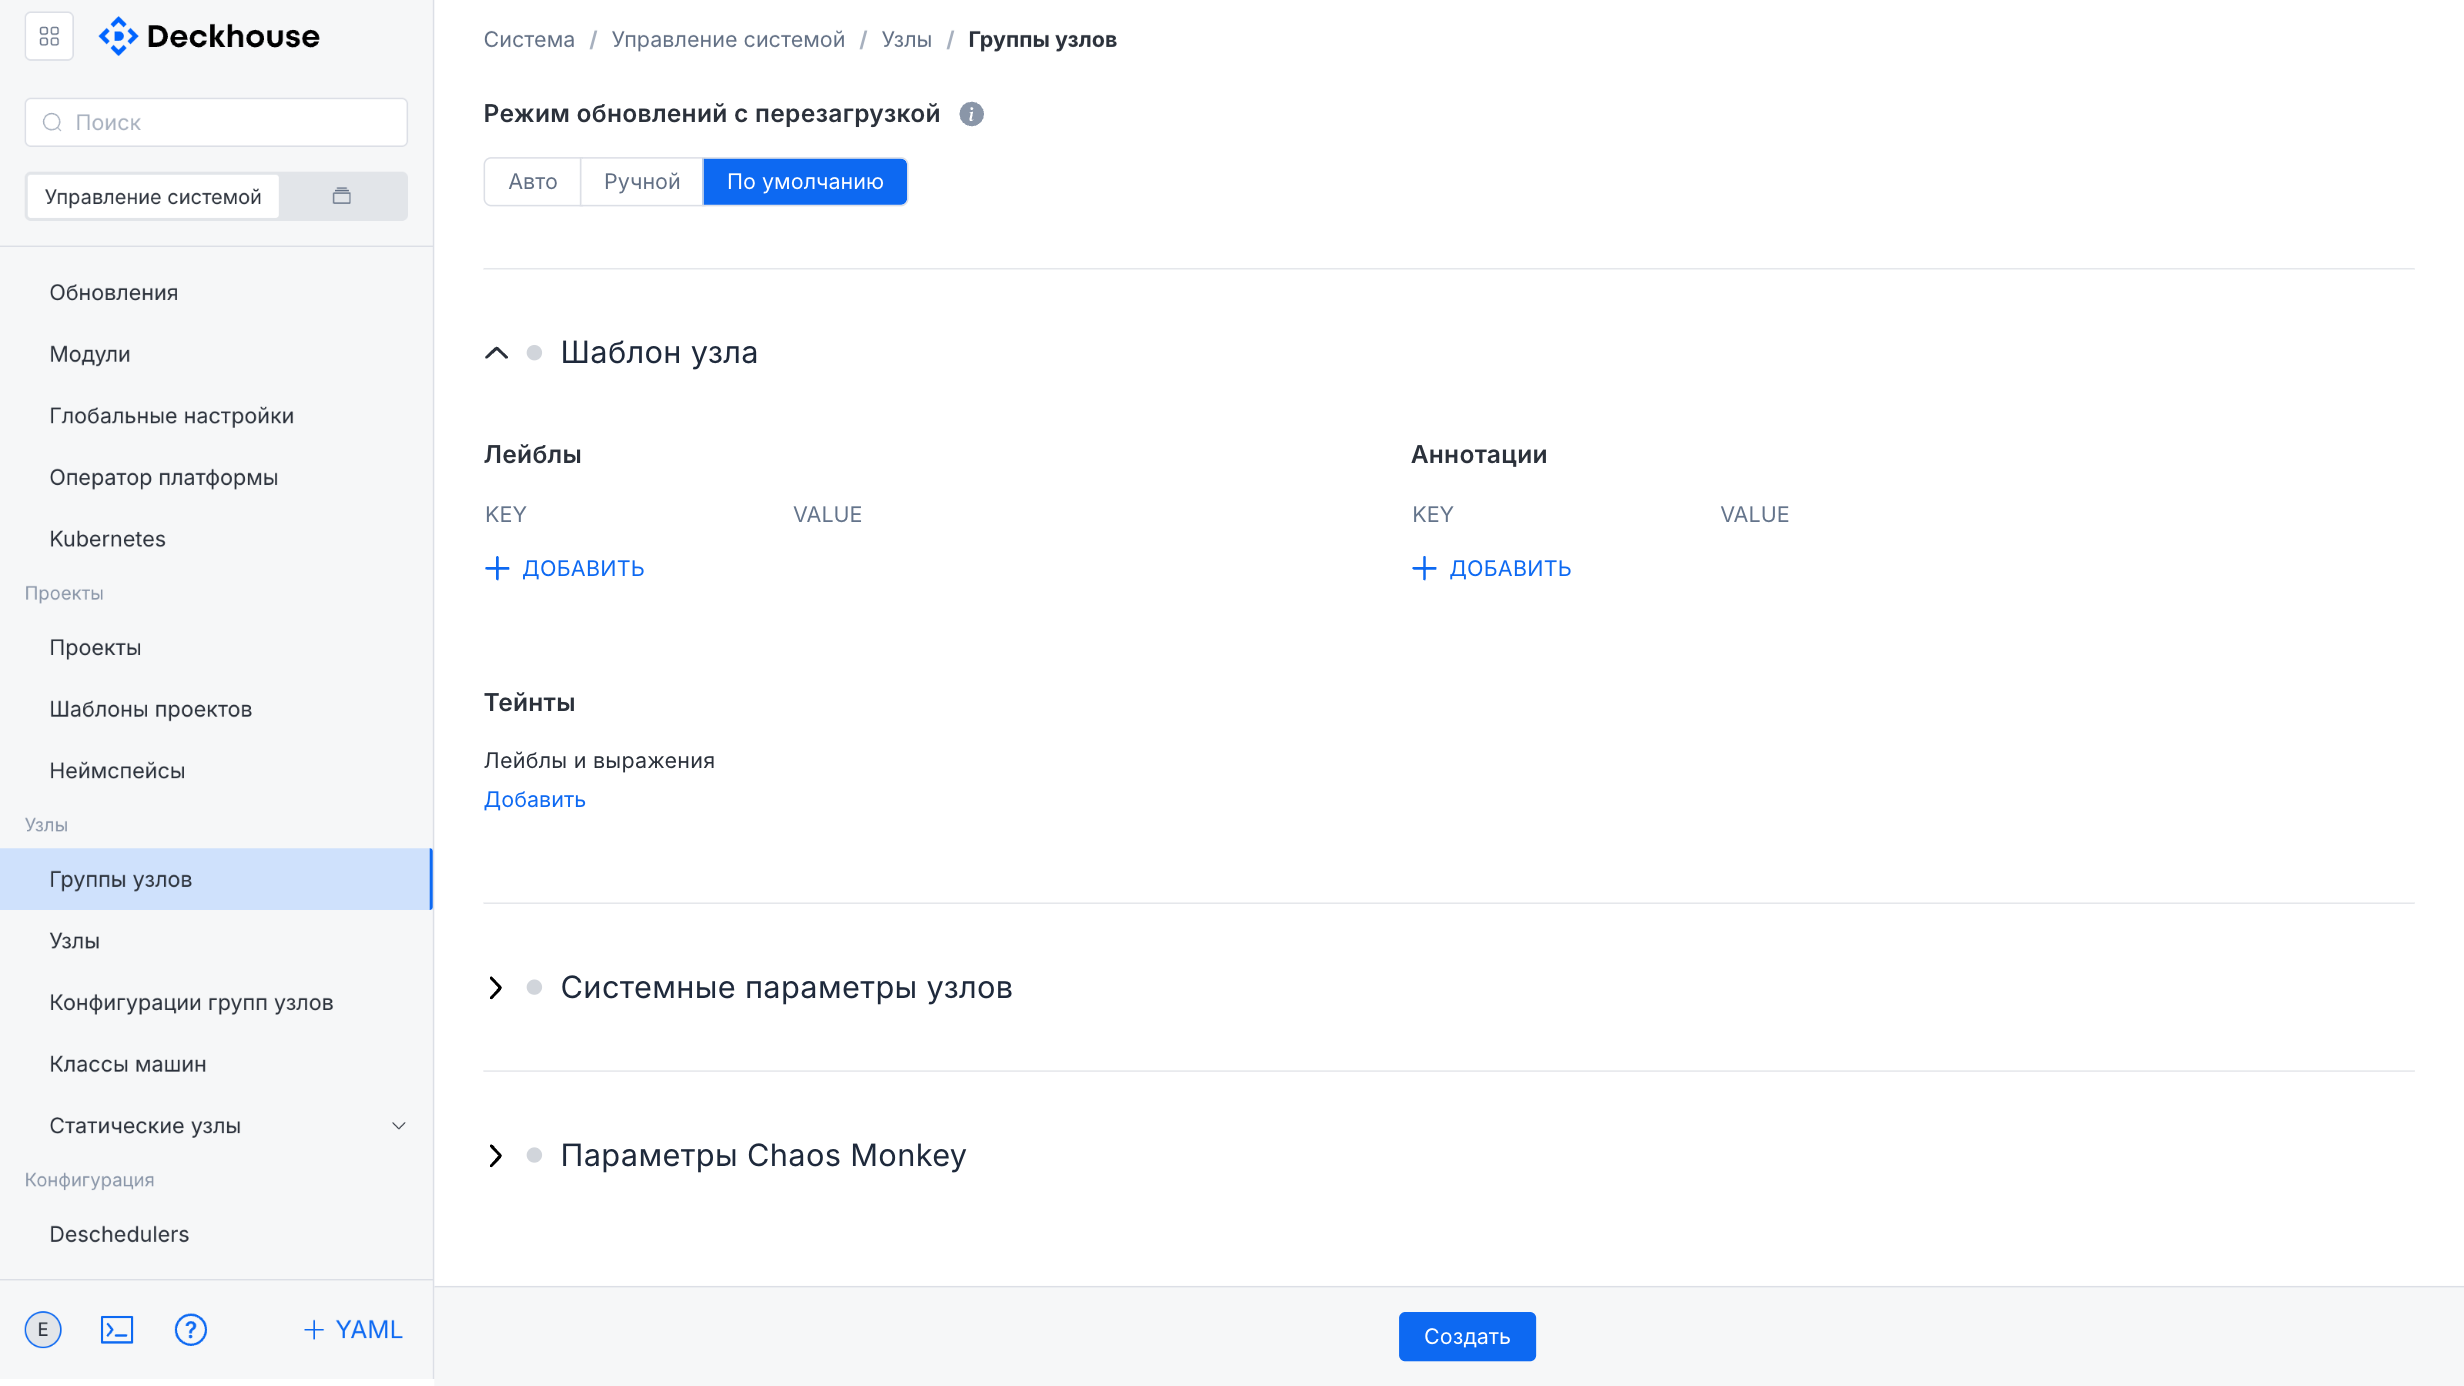
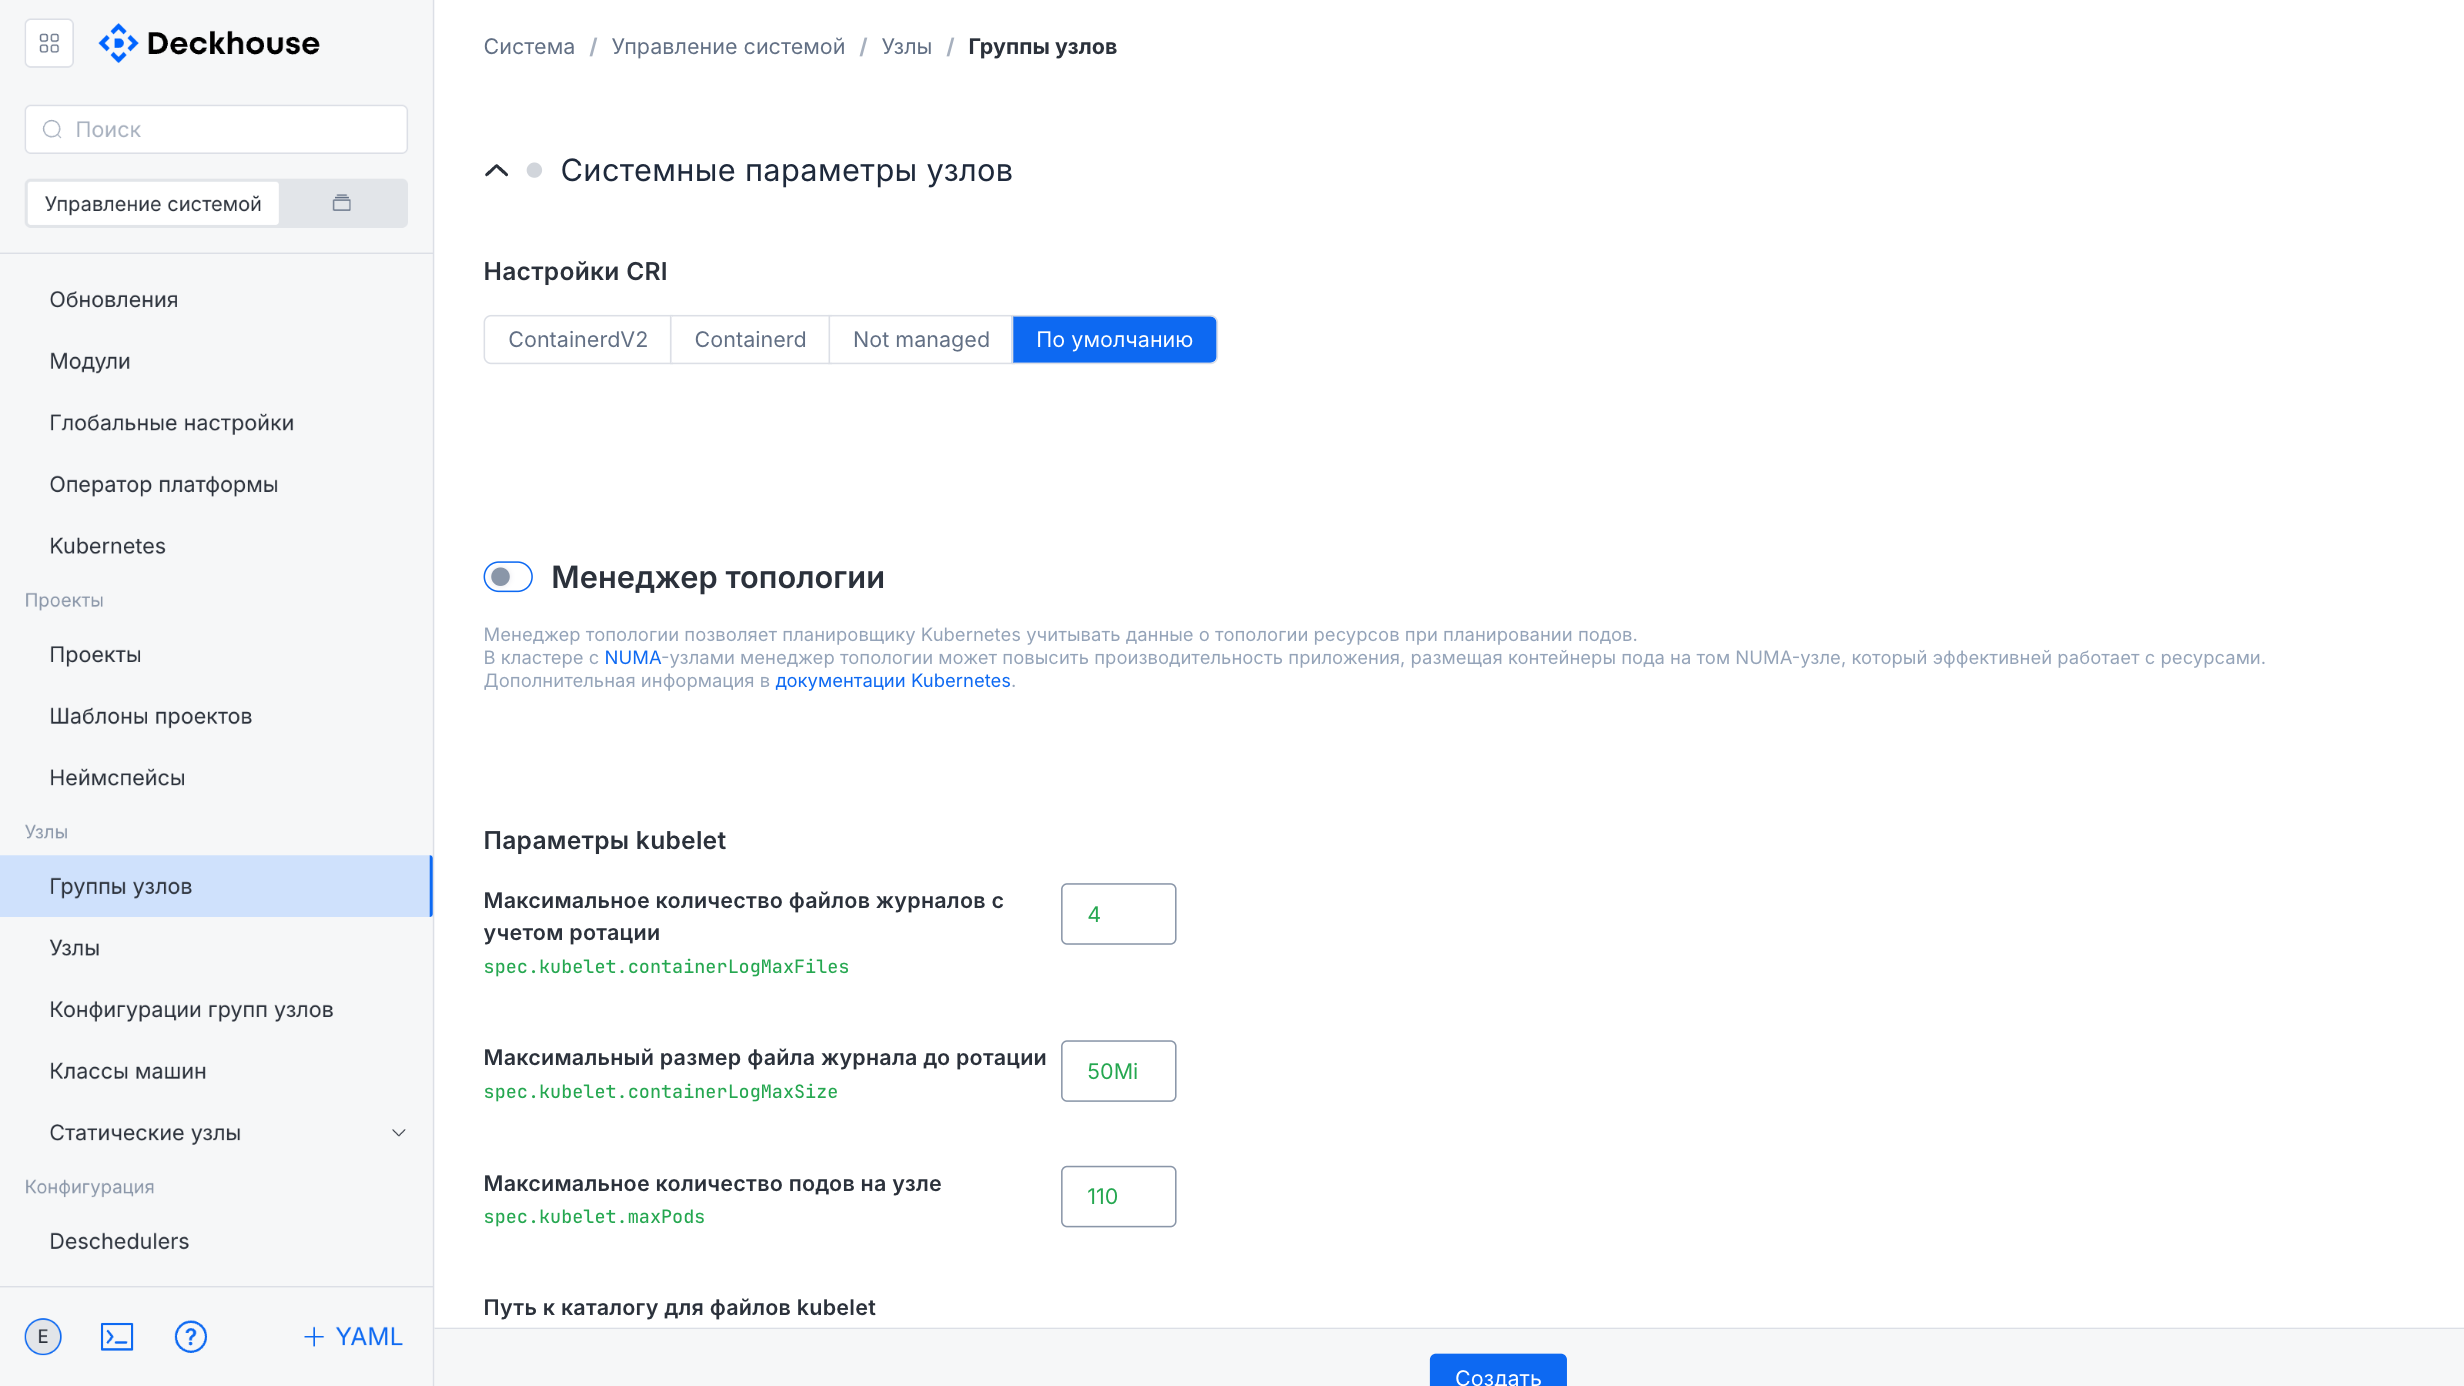
The lower part of the form contains additional settings, including node update parameters, the node template, system parameters, and Chaos Monkey parameters, which can also be expanded for detailed configuration.
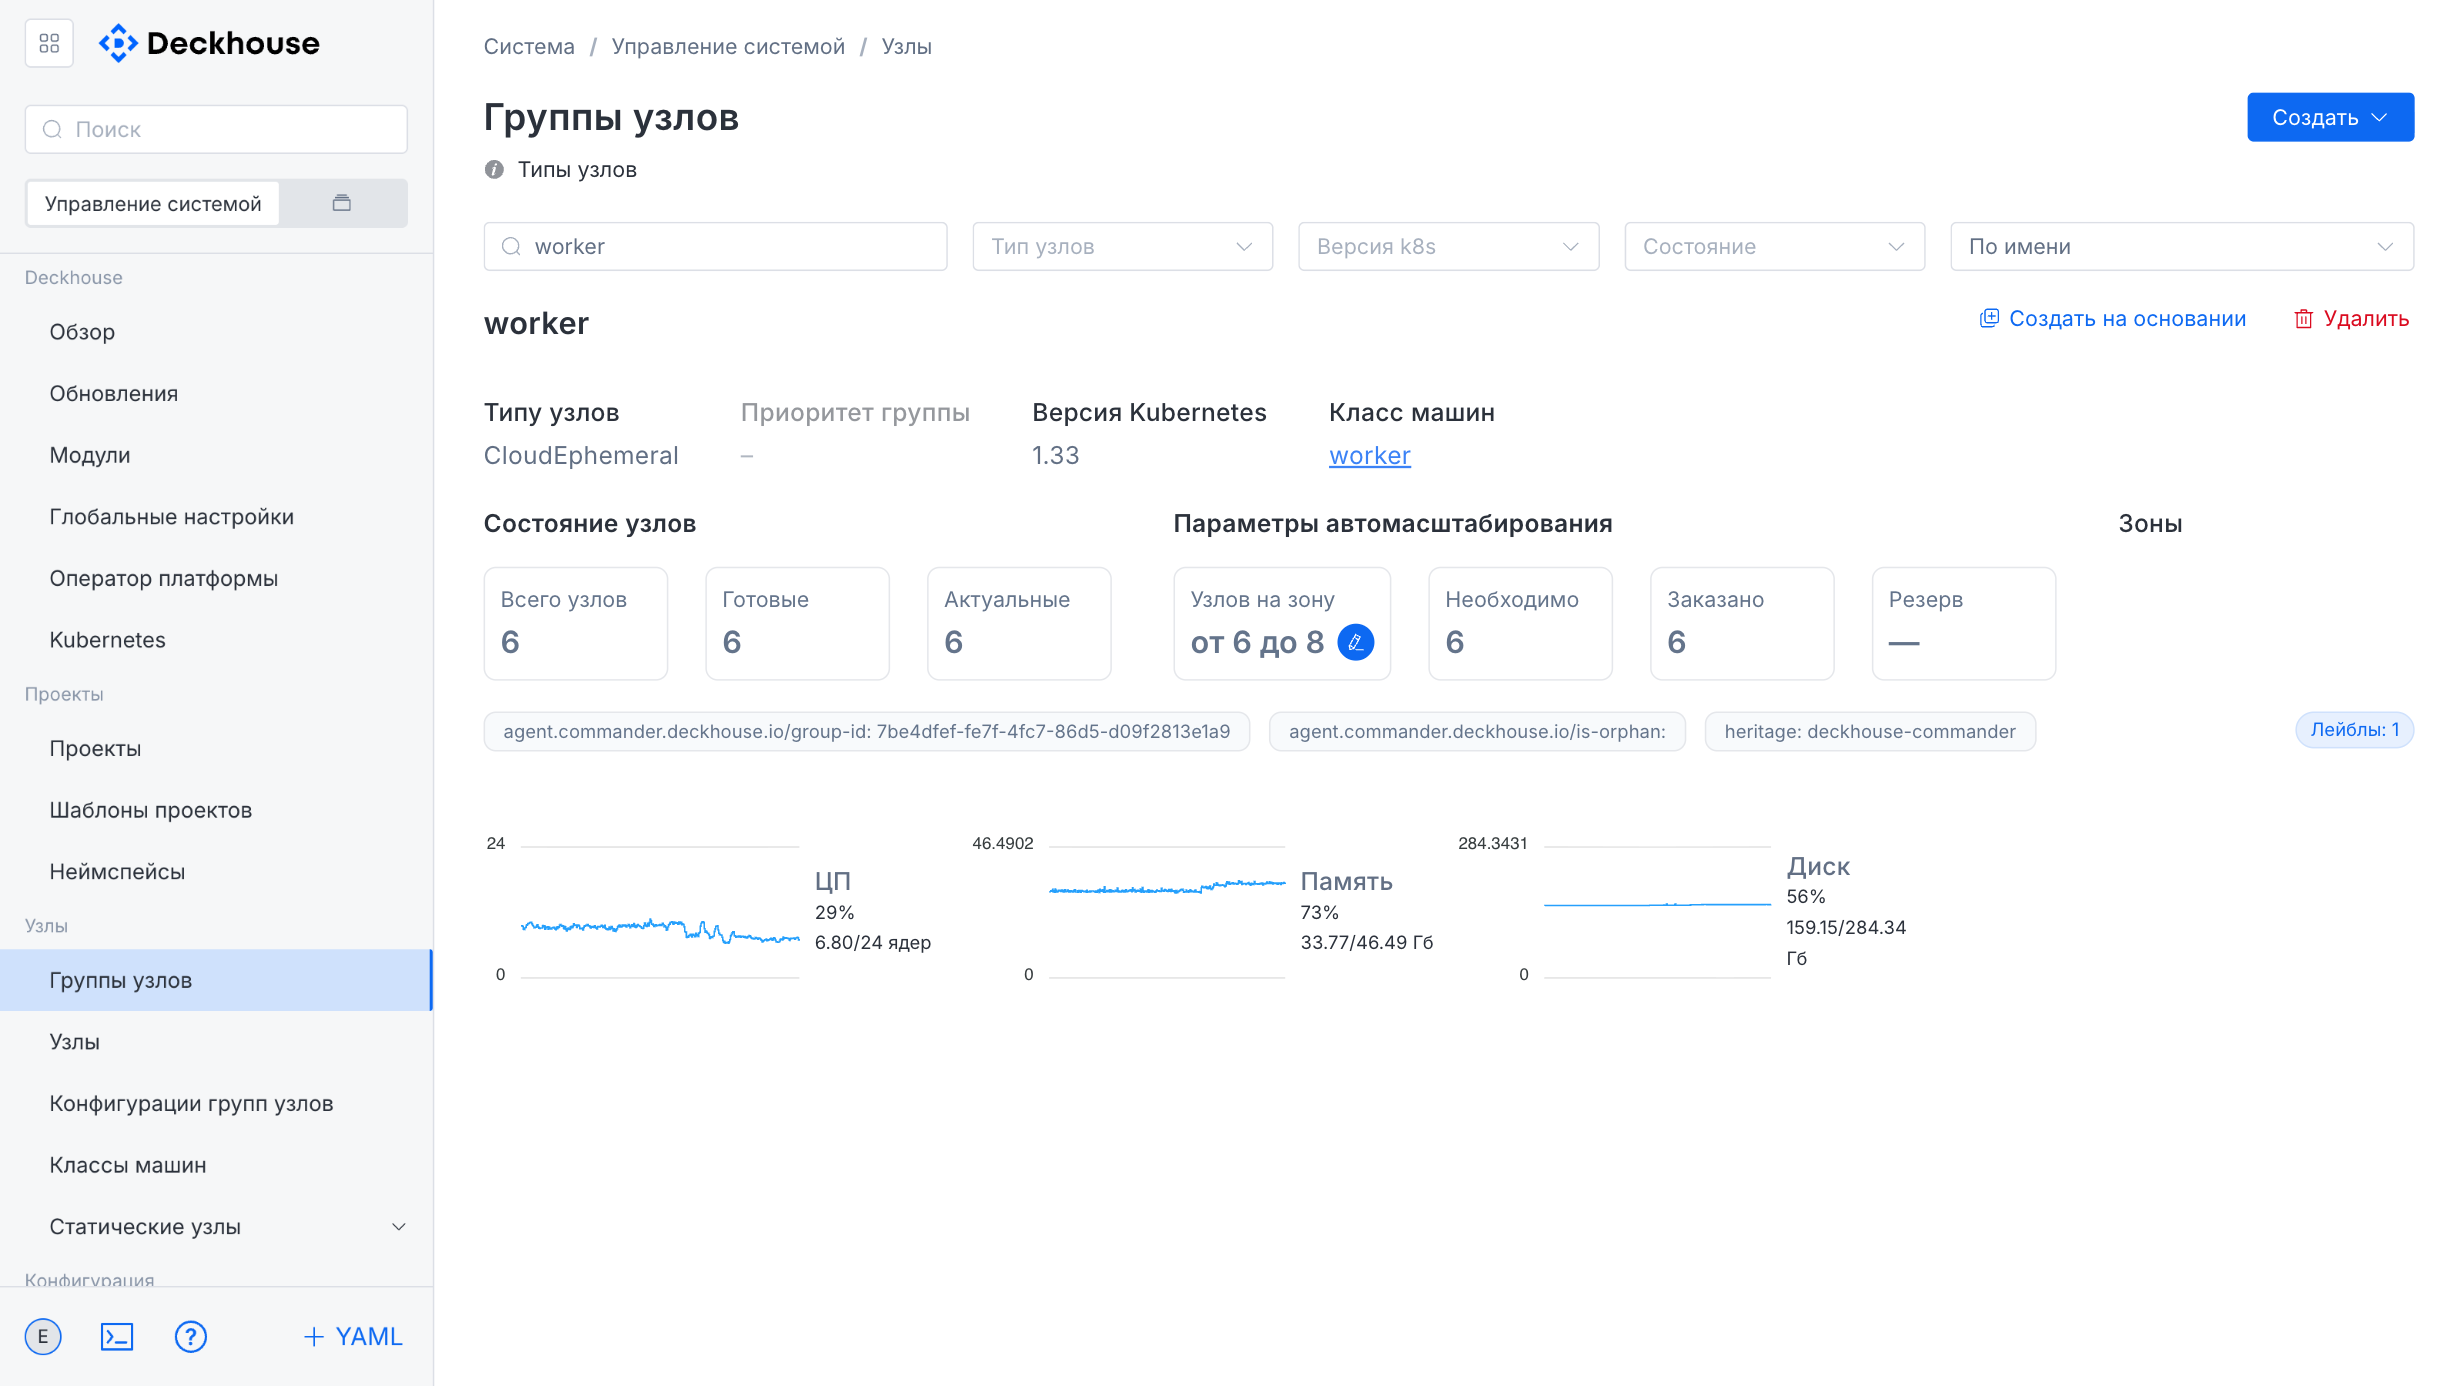
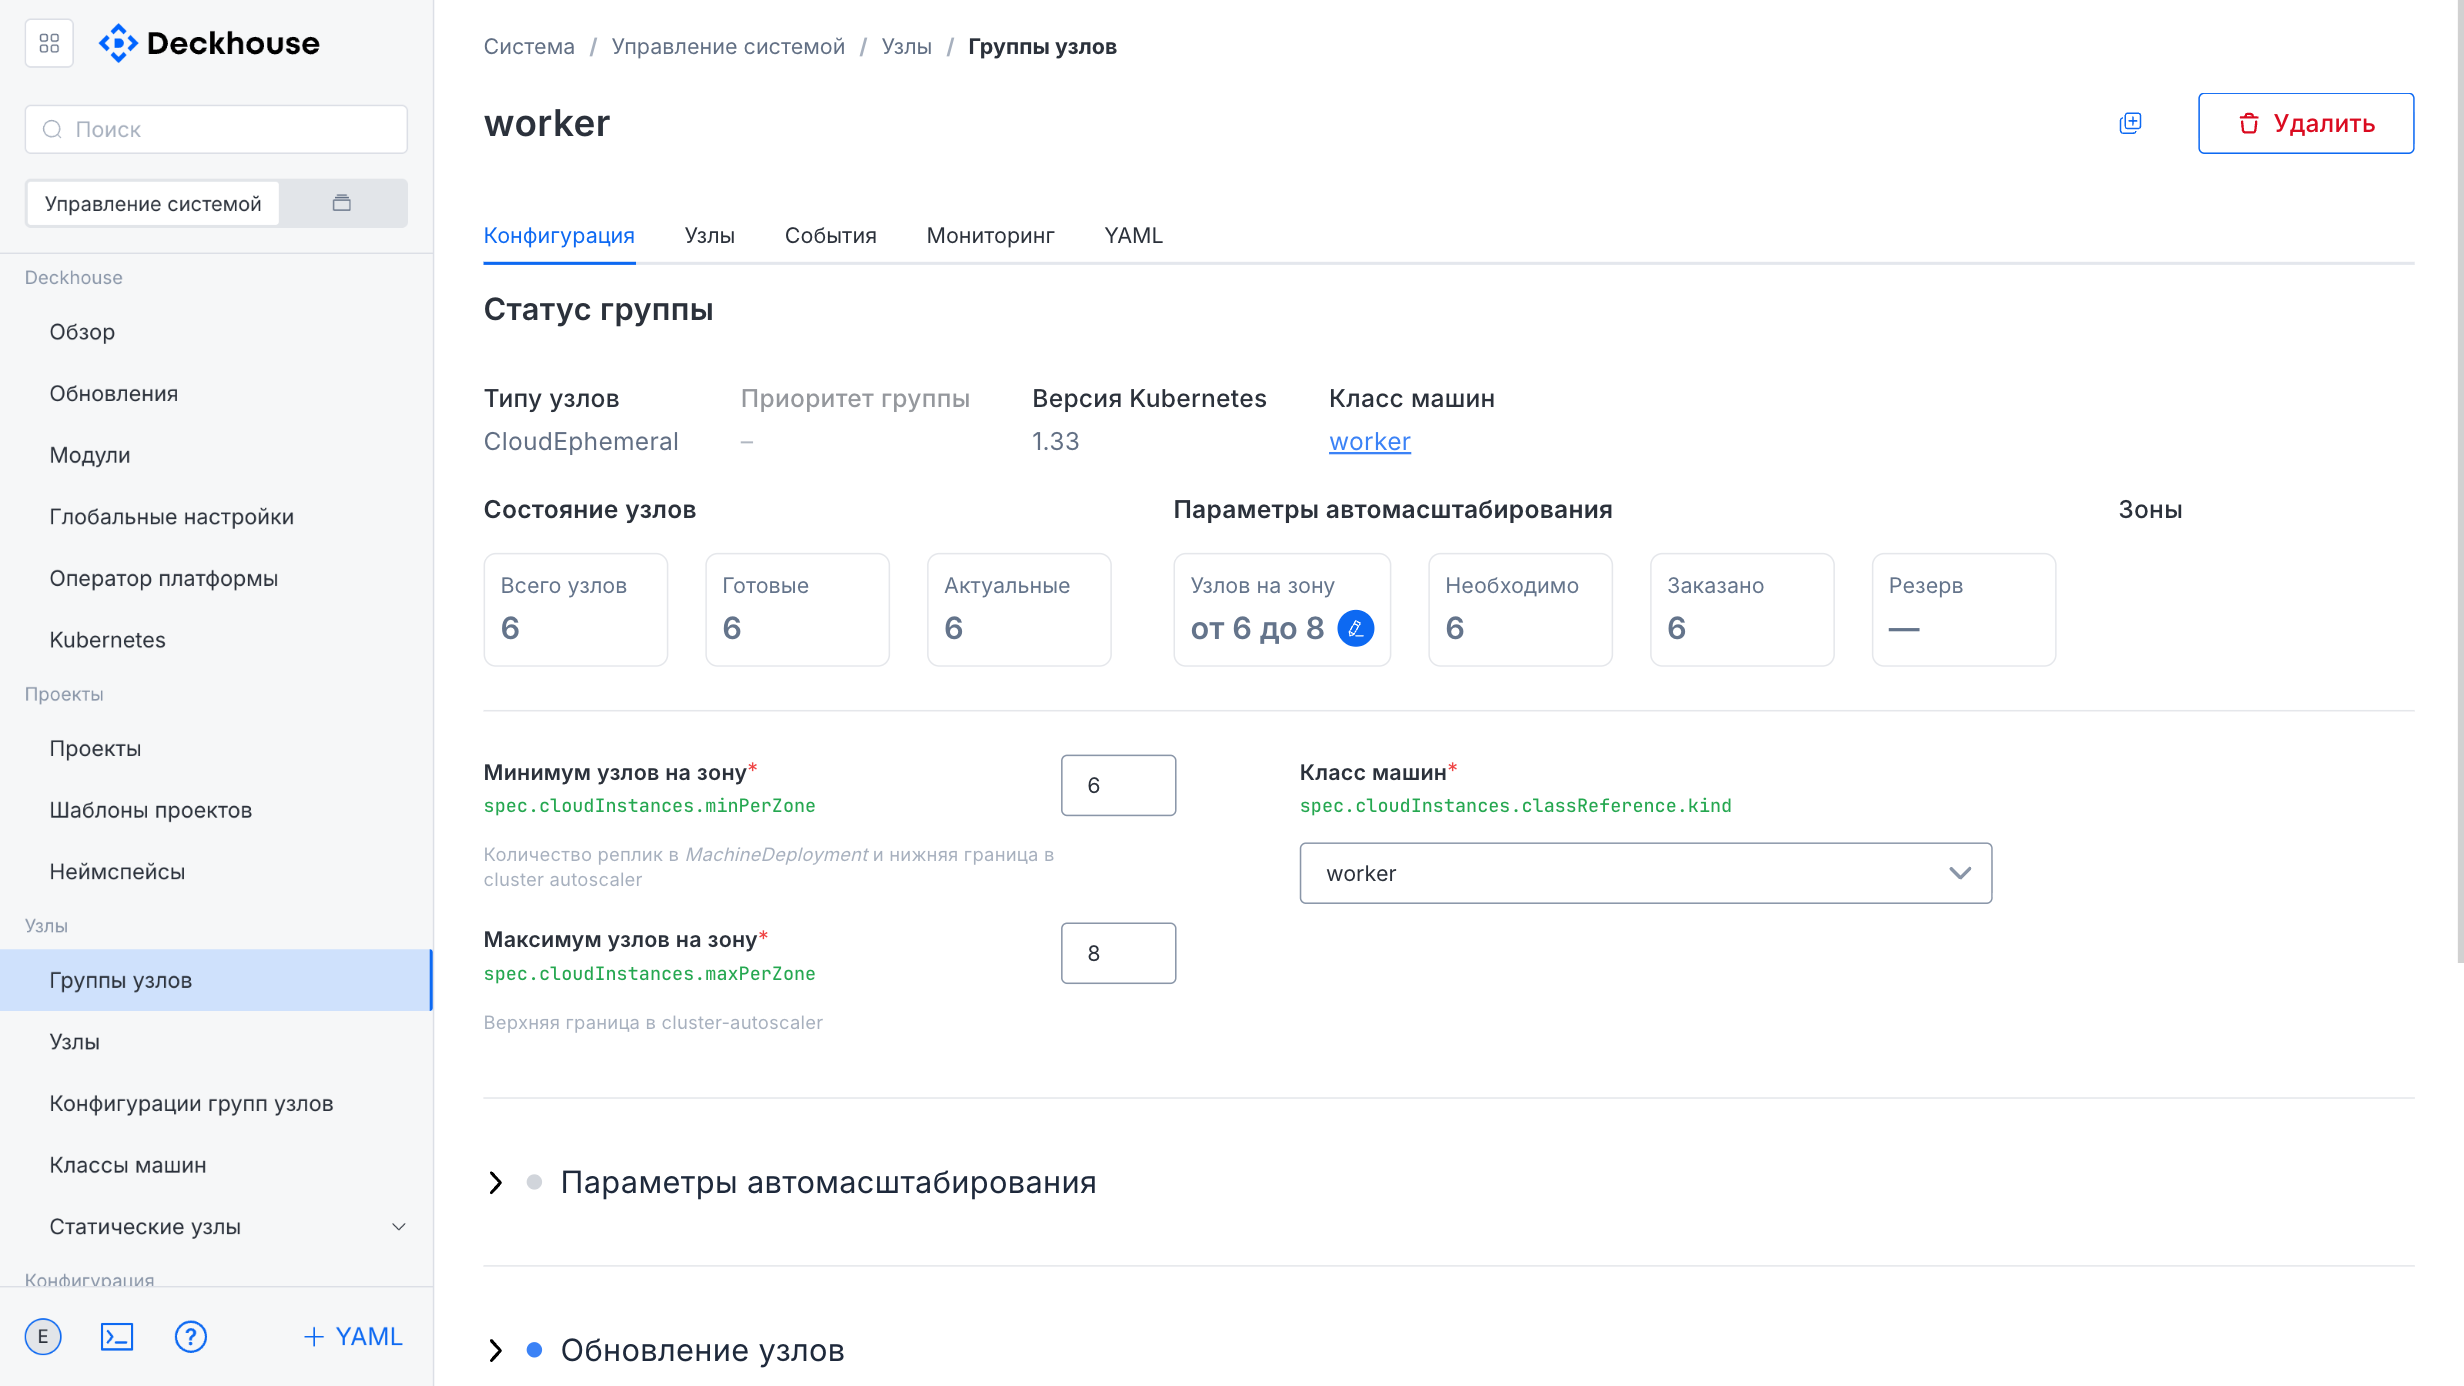
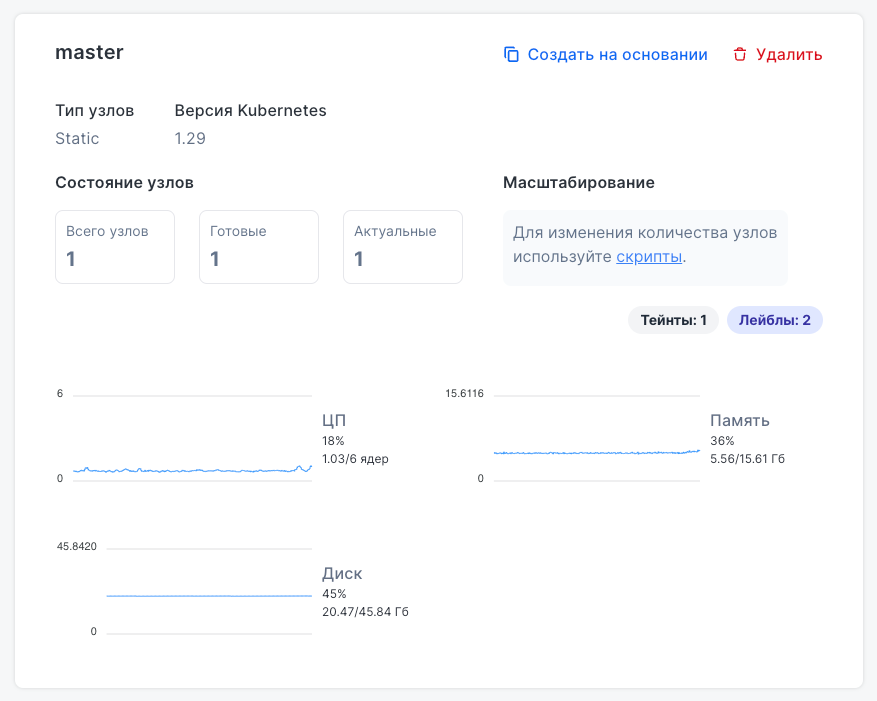
The node group card displays:
- Node type and Kubernetes version
- Total number of nodes, their readiness and update status
- Load metrics (CPU, memory, disk)
- Taints and labels
The “Create” button in the upper-right corner opens the form for creating a new node group.
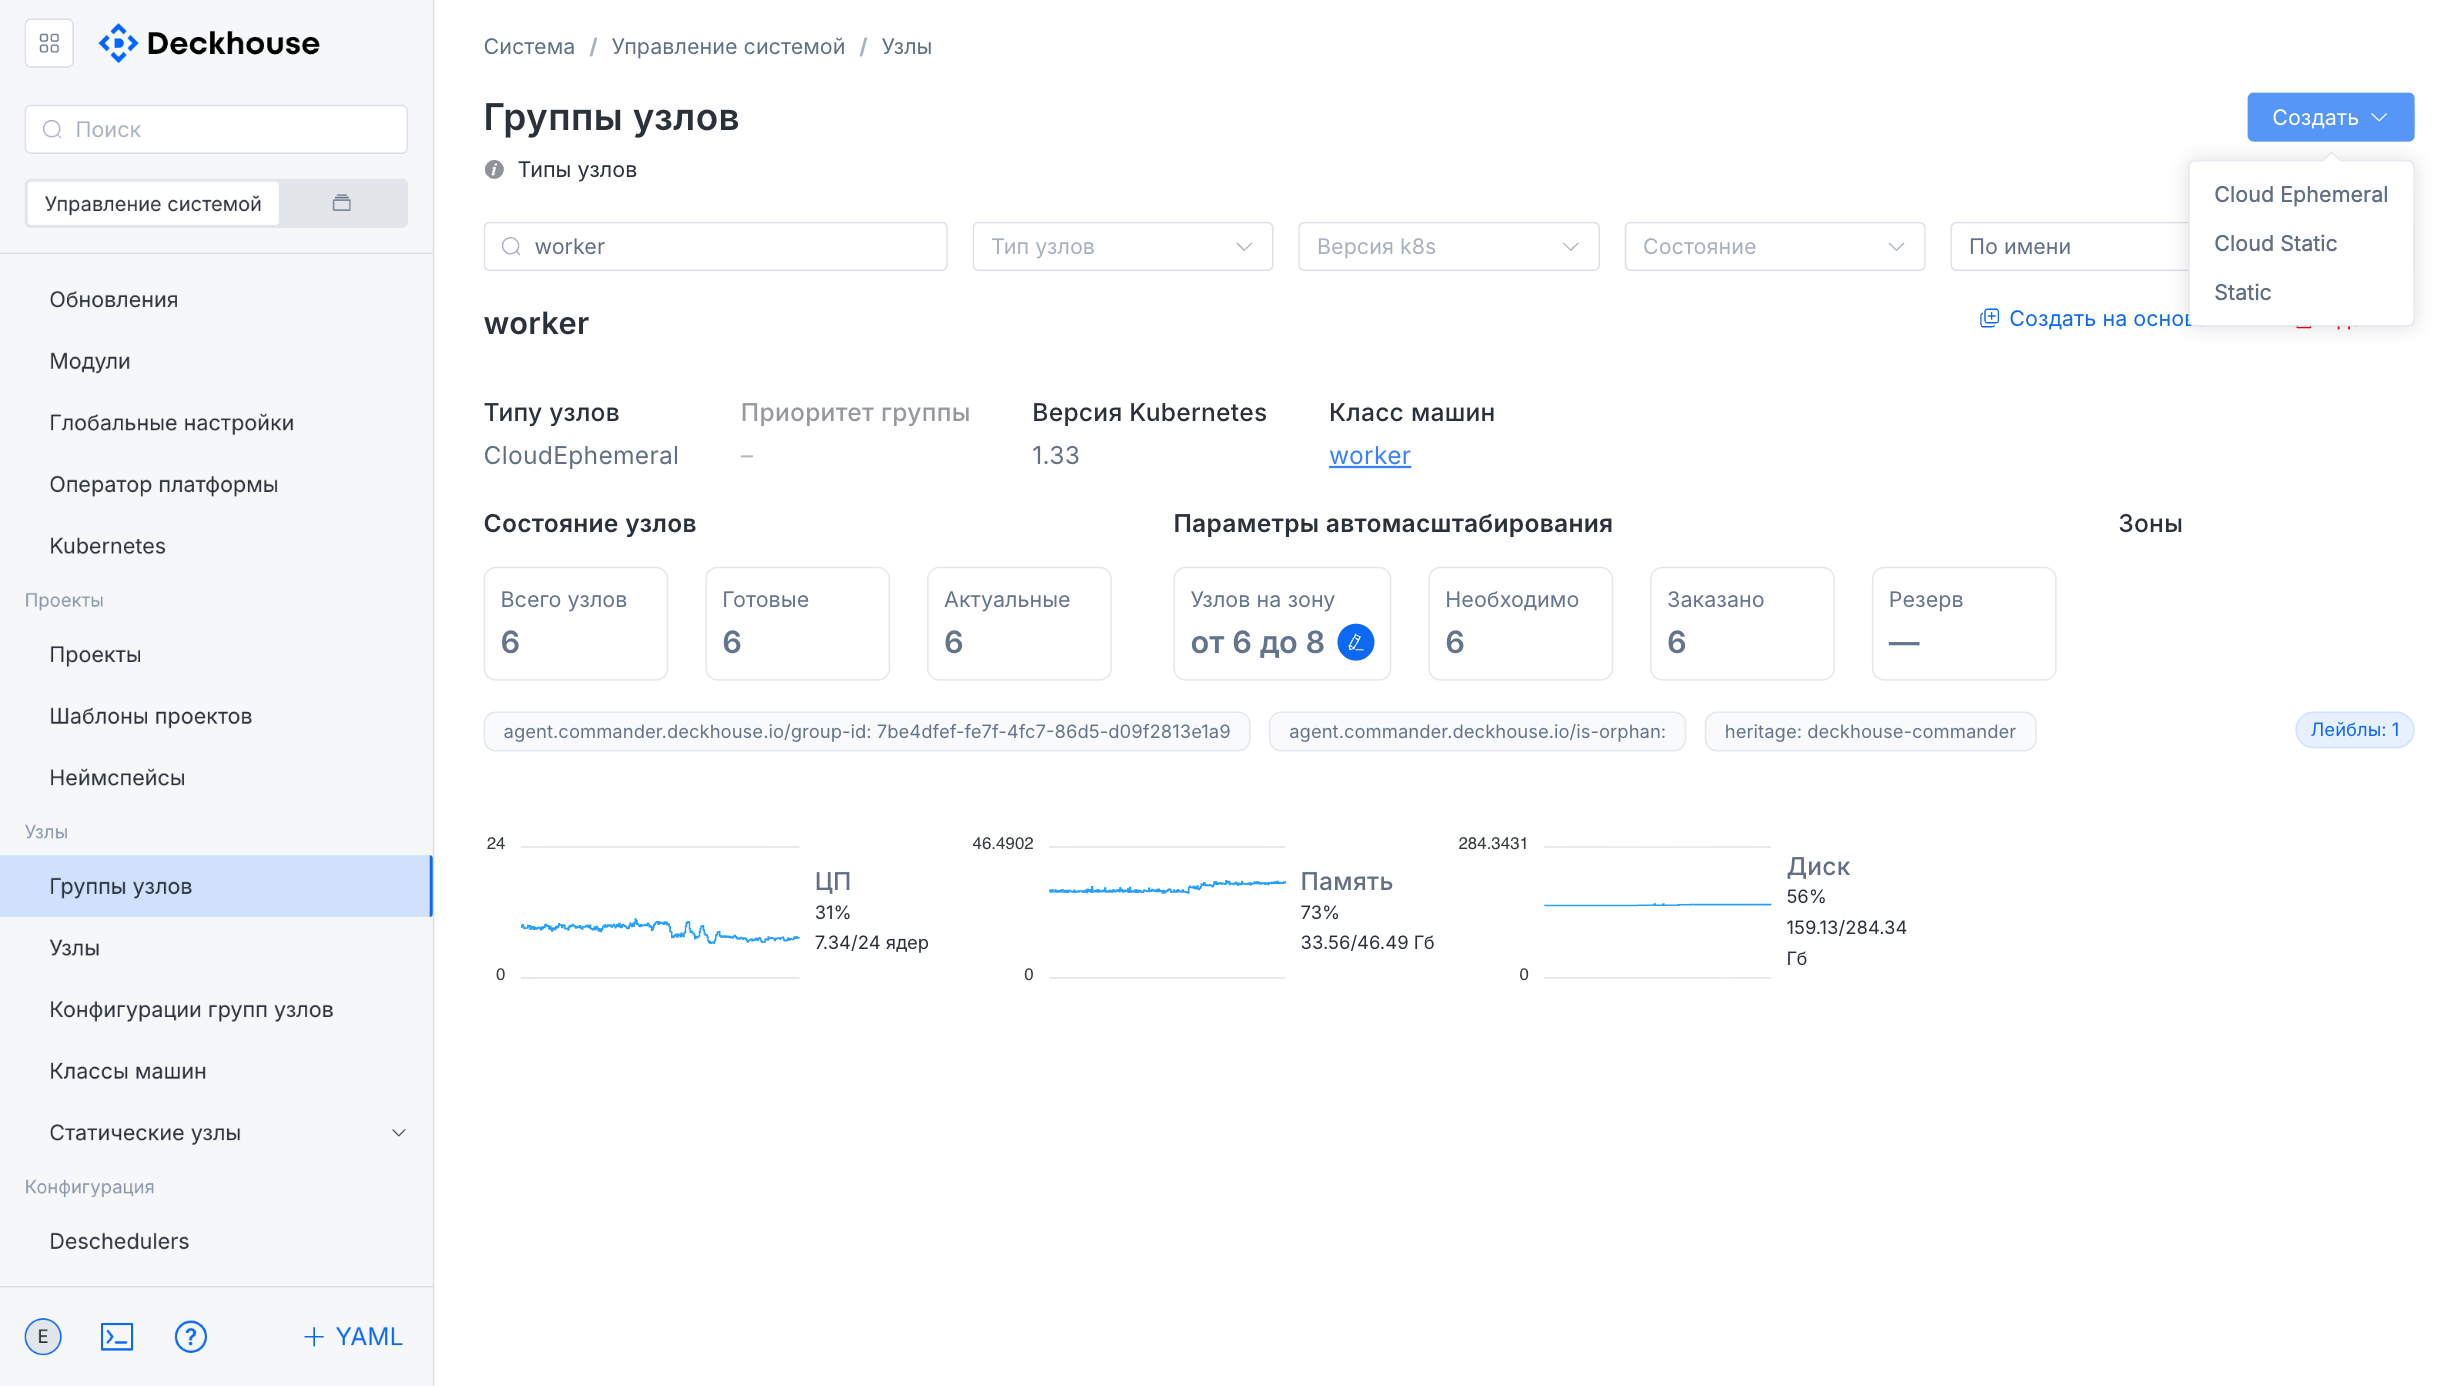
The form lets you specify the required parameters for the new node group.
“Instance classes” subsection
This subsection is intended for managing instance classes used in the cluster. The class list can be sorted.
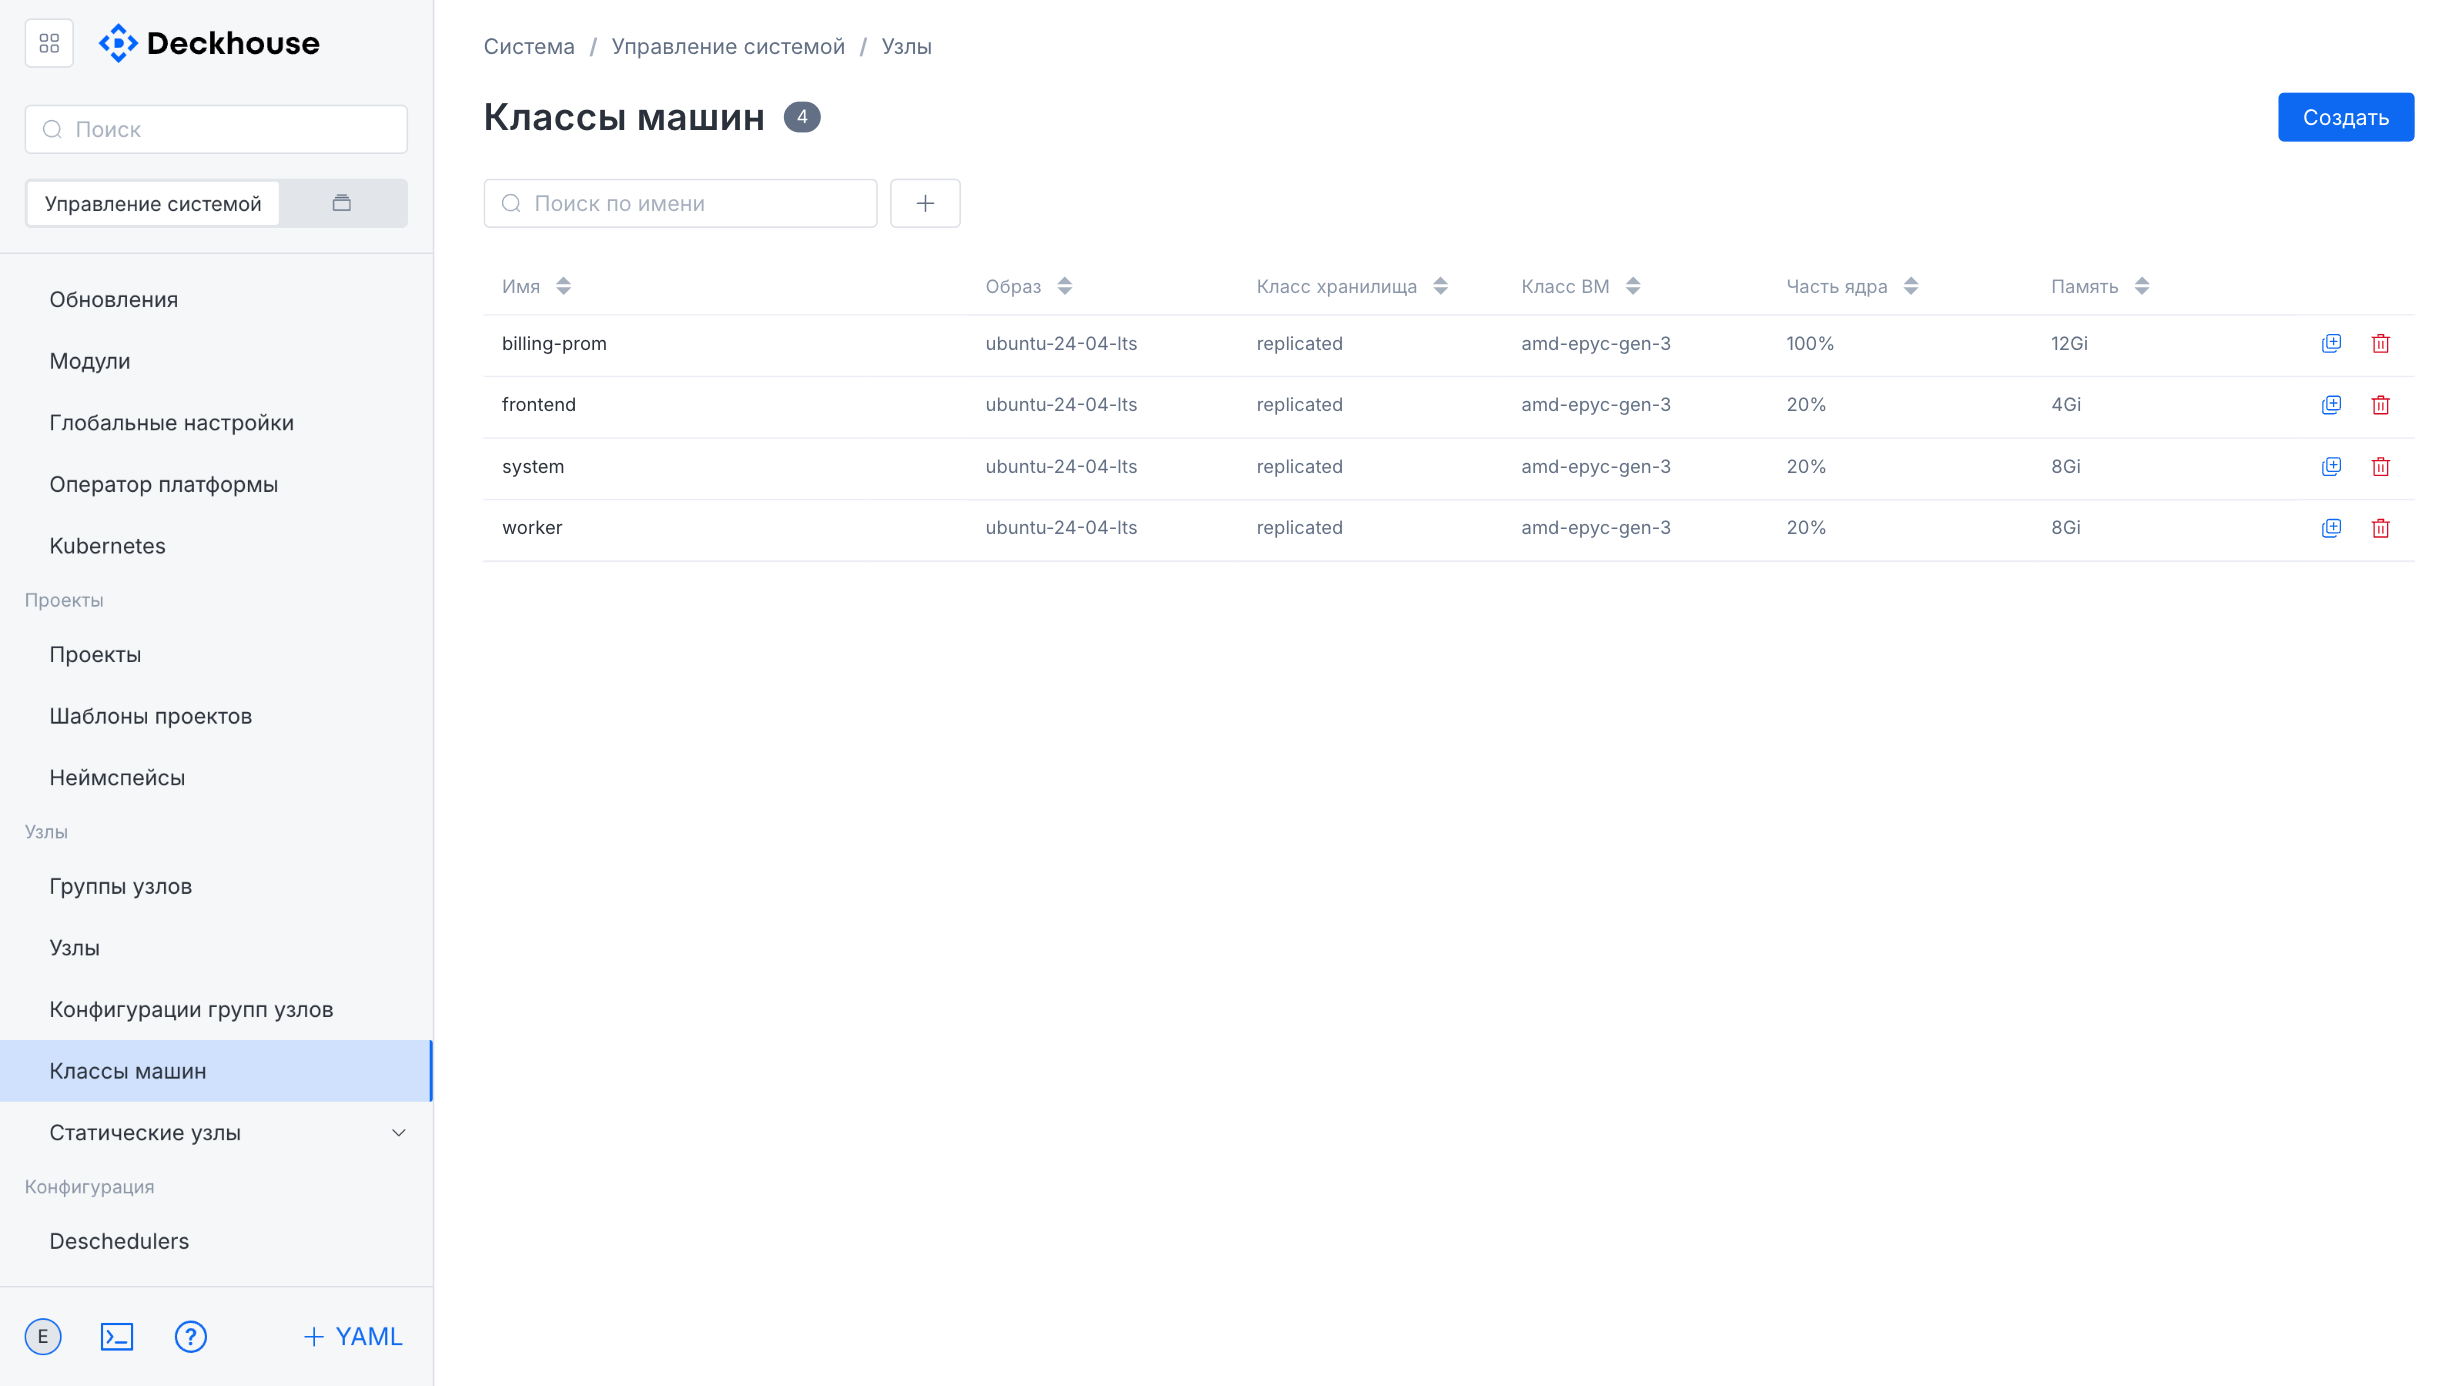
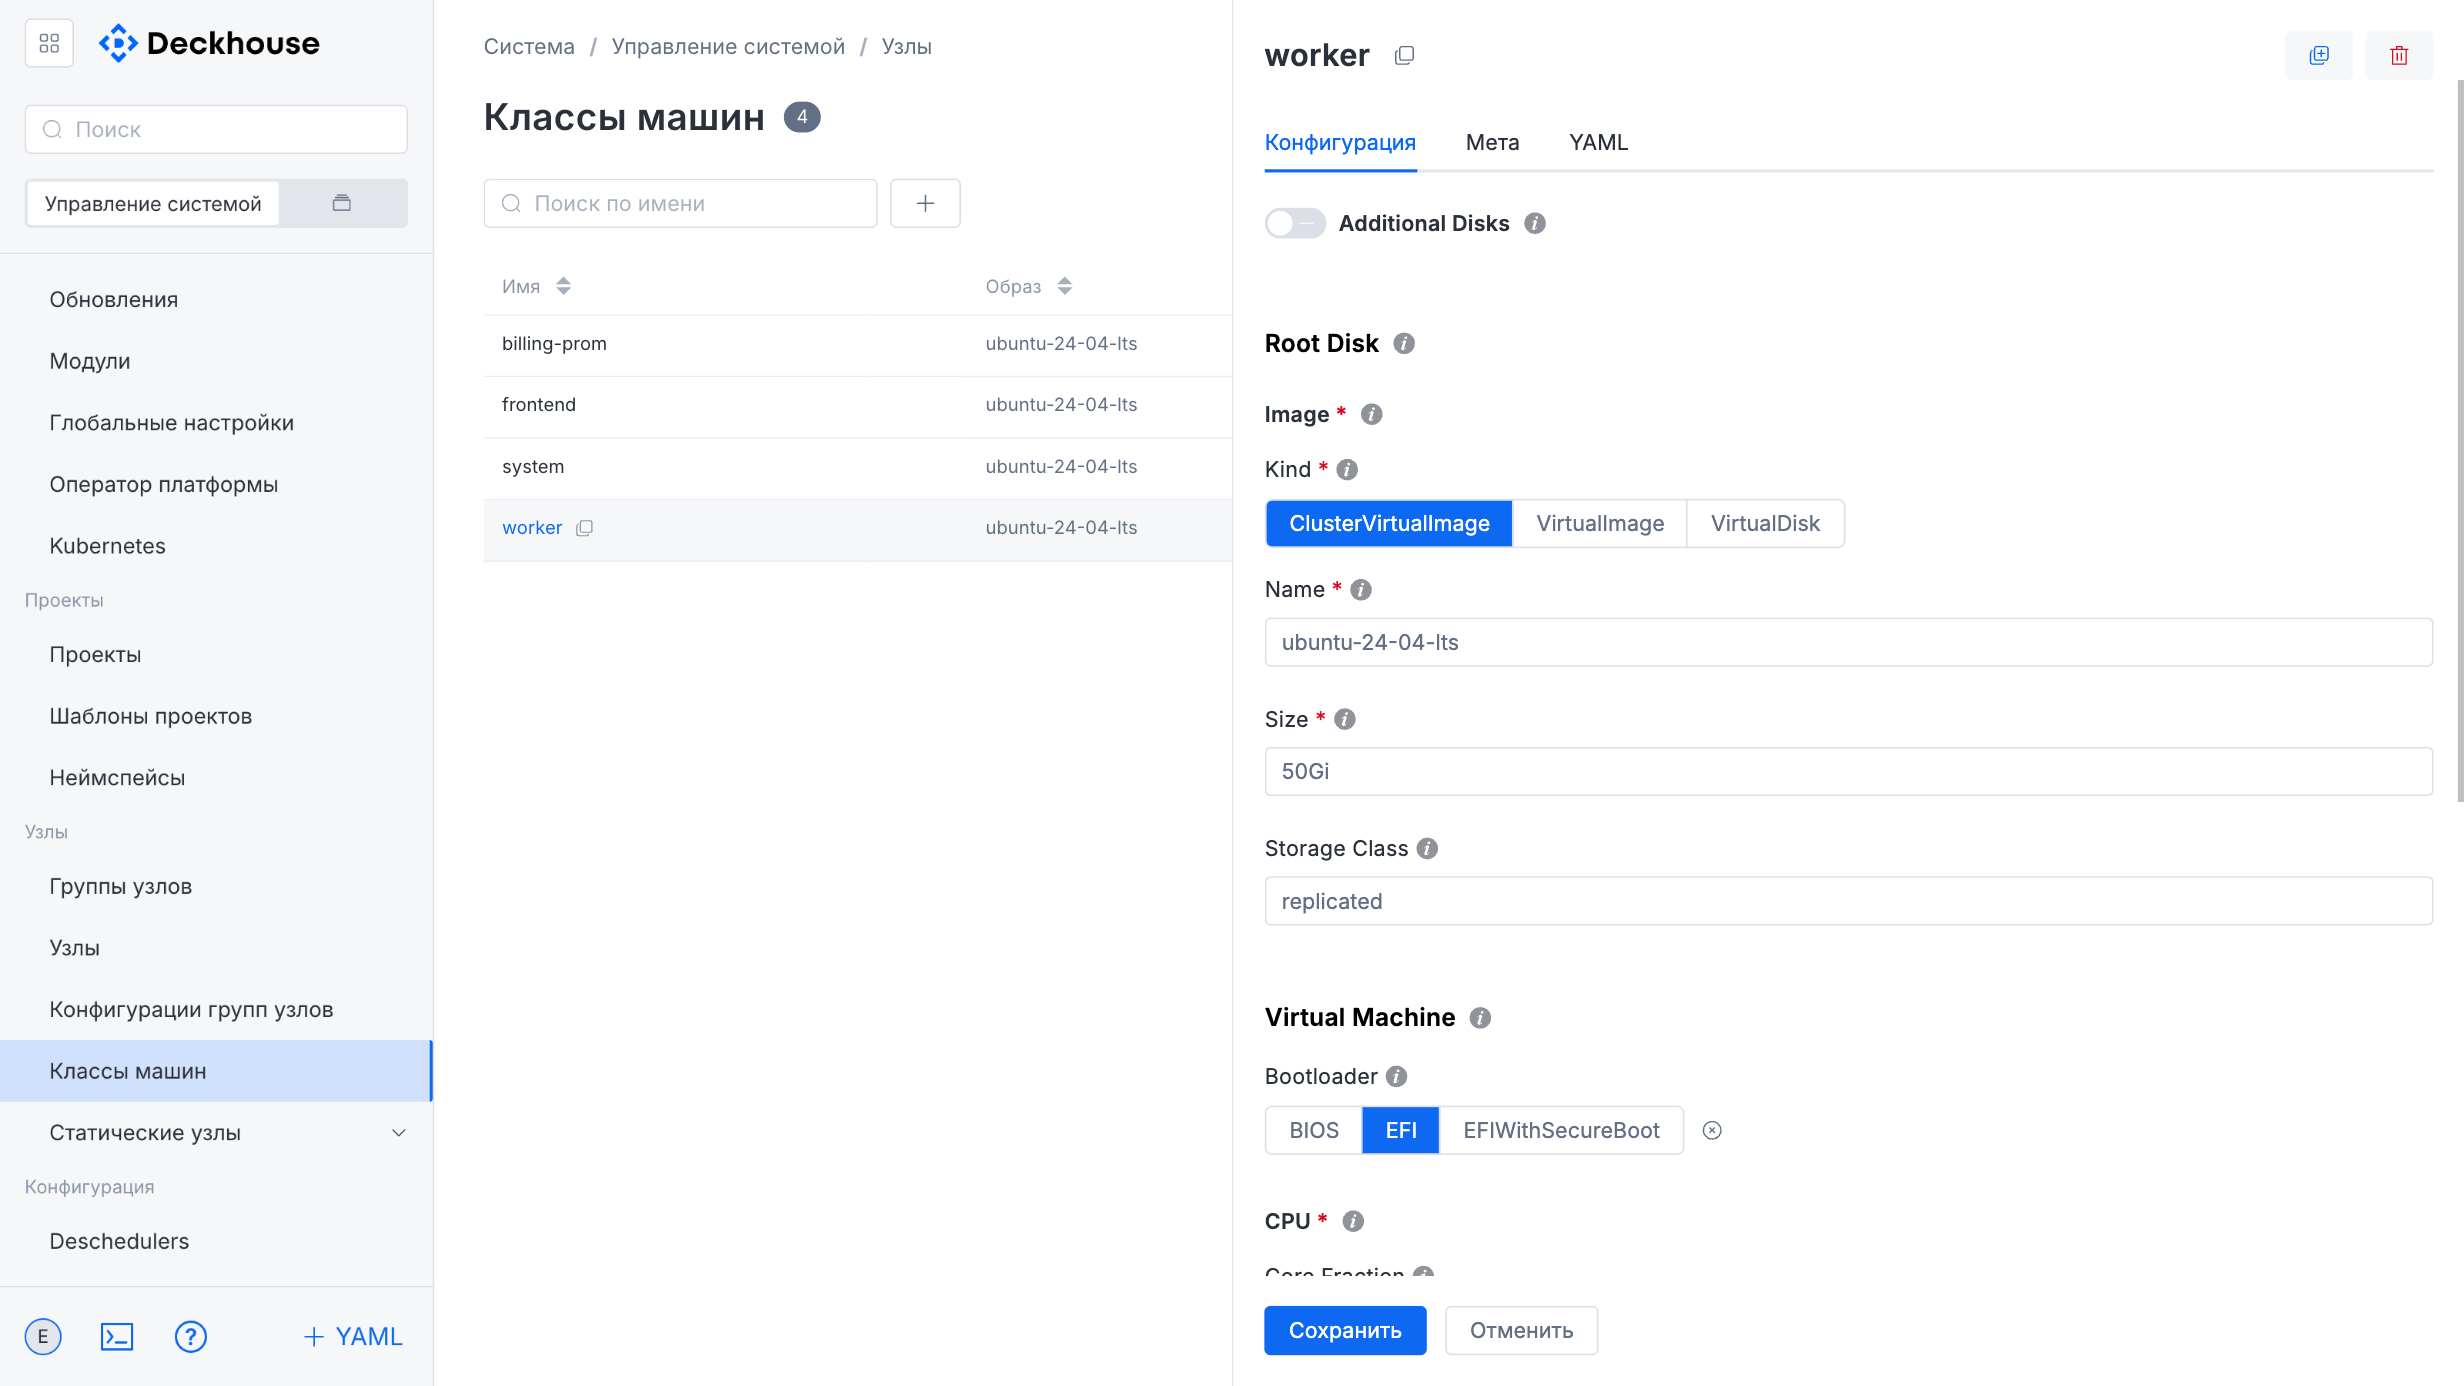
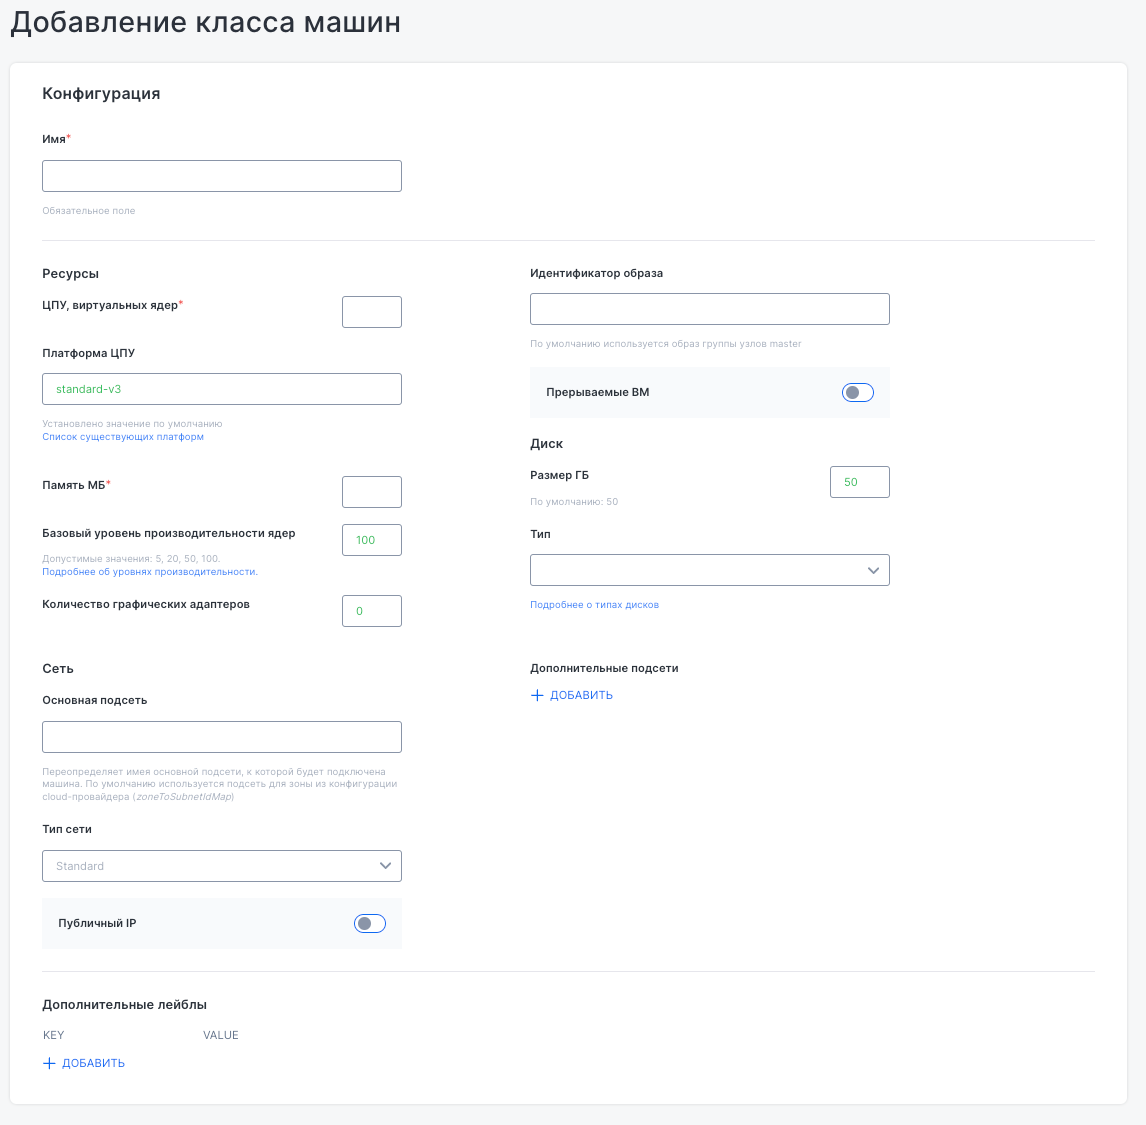
The “Create resource” form lets you specify parameters for a new instance configuration for the cluster.
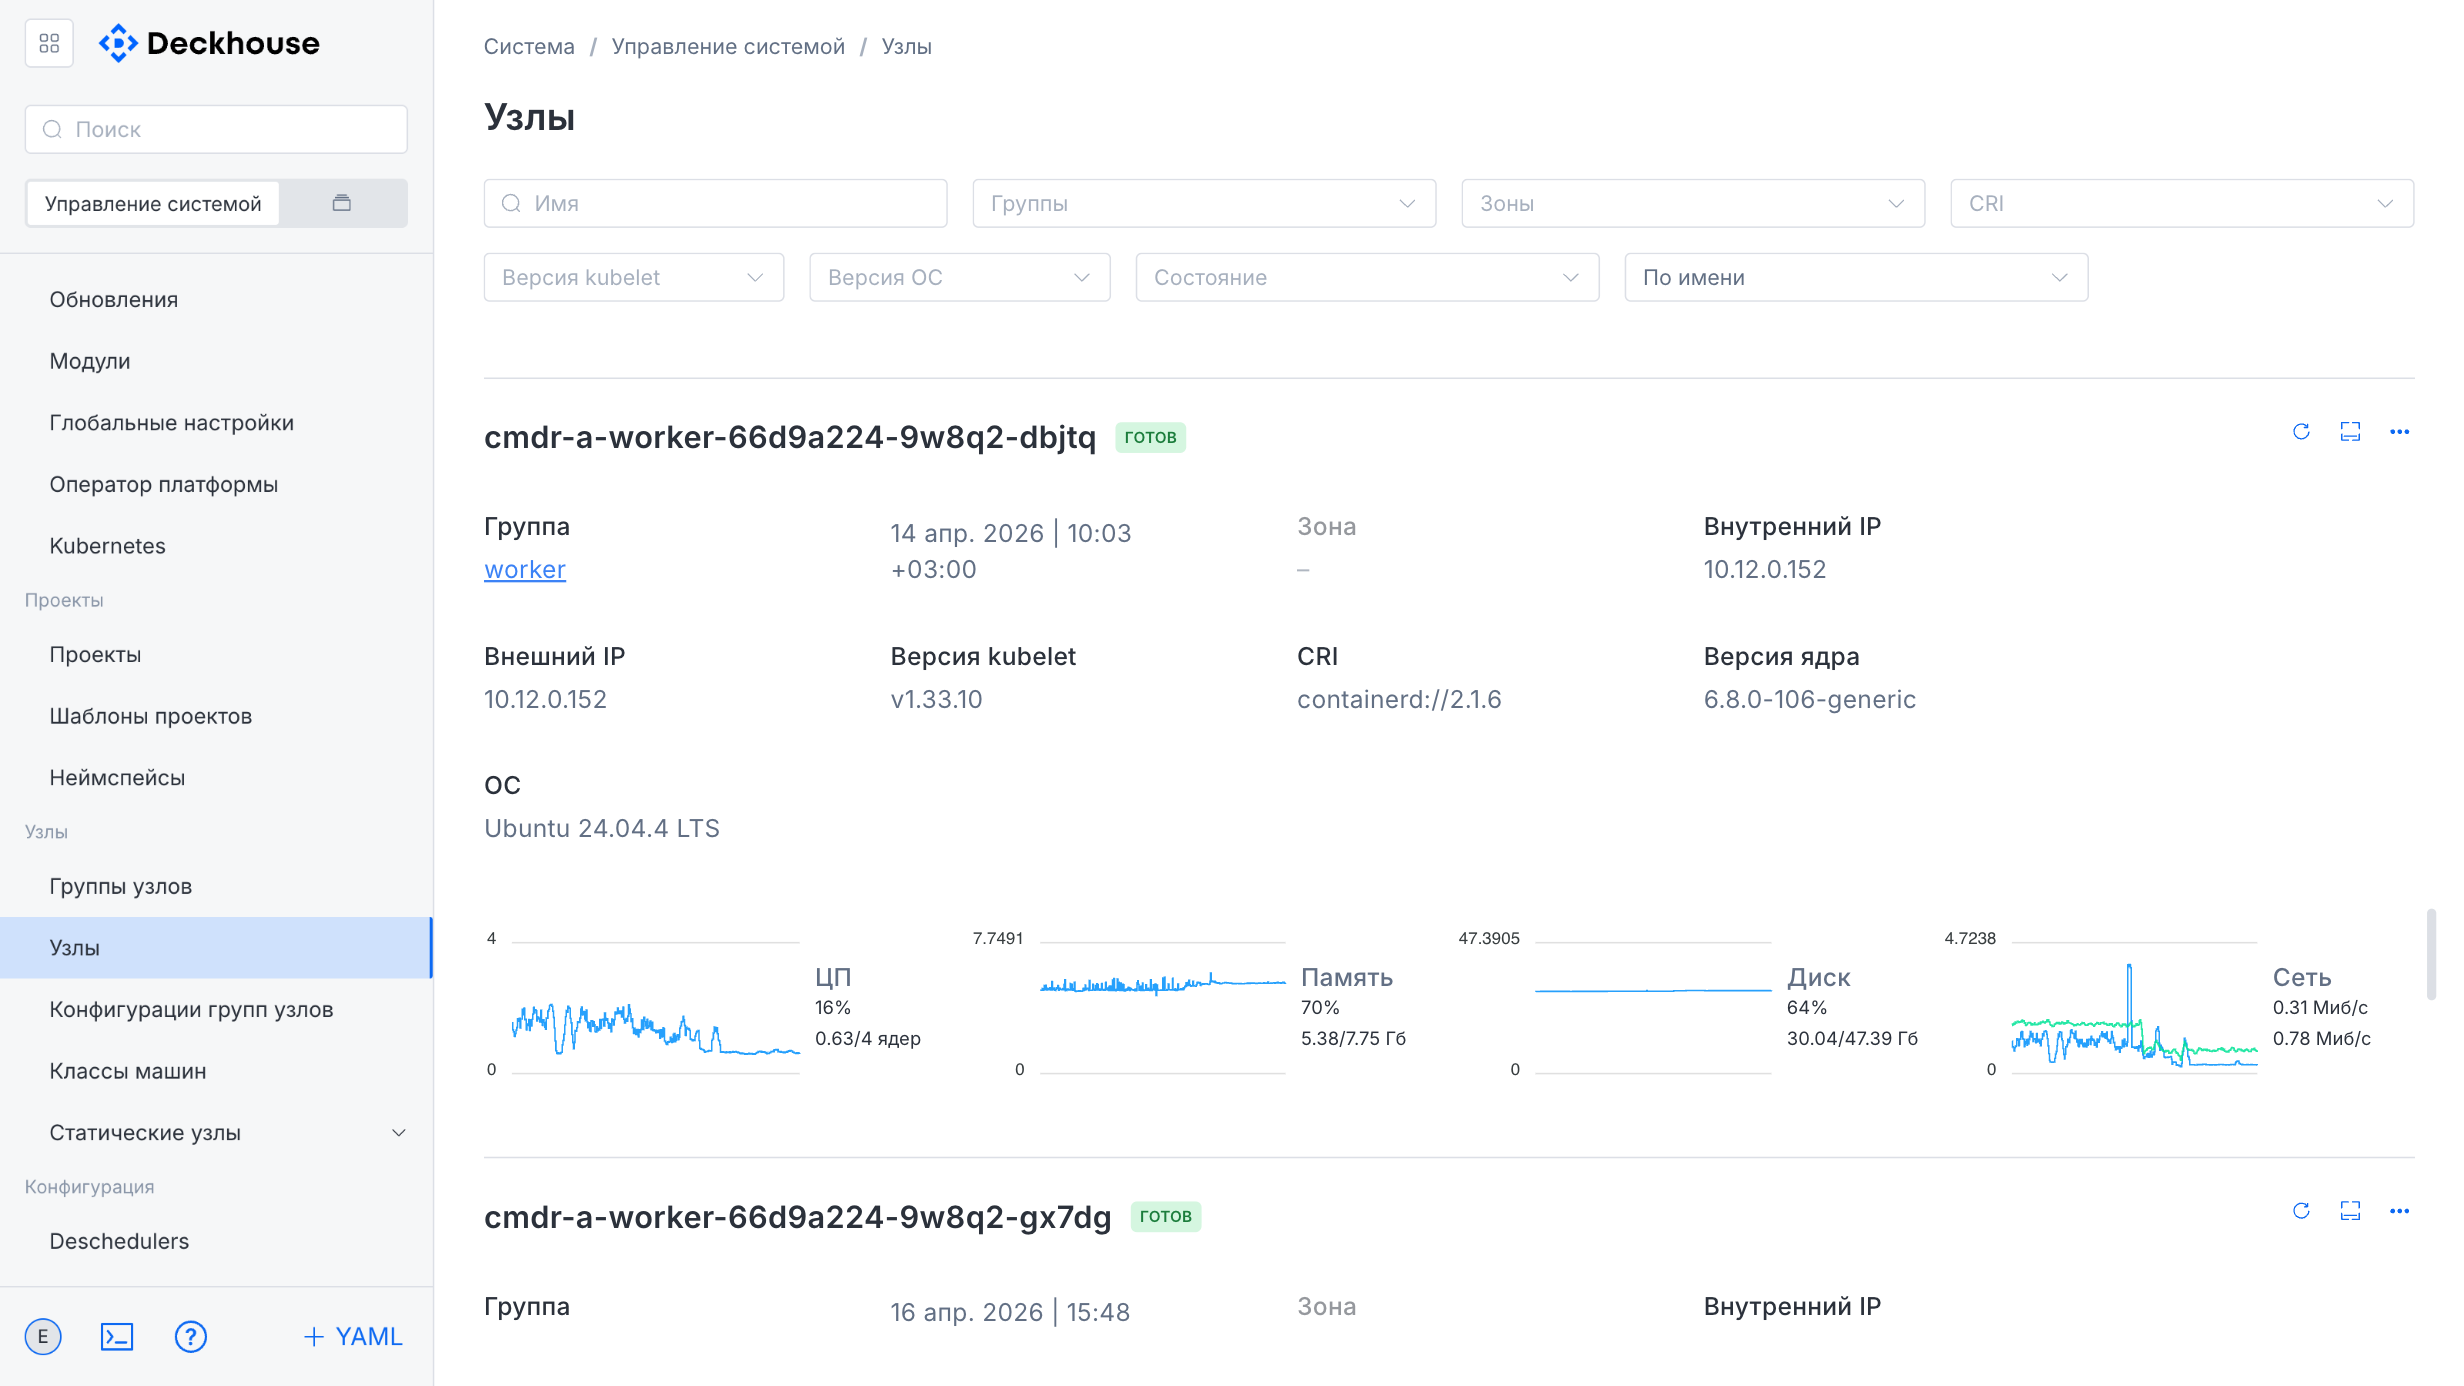
“Nodes” subsection
This subsection provides summary information about all DKP cluster nodes with filtering and sorting capabilities.
The node card displays:
- Current node state
- Group
- Date and time
- Availability zone
- Internal and external IP addresses
- Container runtime in use
- Kernel version
- Kubelet version
- Operating system
The subsection also contains charts showing CPU, memory, disk, and network traffic usage, allowing you to monitor node performance. To manage node availability in the cluster, the “Cordon” and “Cordon+Drain” buttons are available.
“Static instances” subsection
This subsection is intended for managing static instances in the cluster and includes two tabs:
- “Instances”: For working with static instances.
- “SSH access”: For configuring SSH access.
The interface allows you to quickly find and manage static instances.
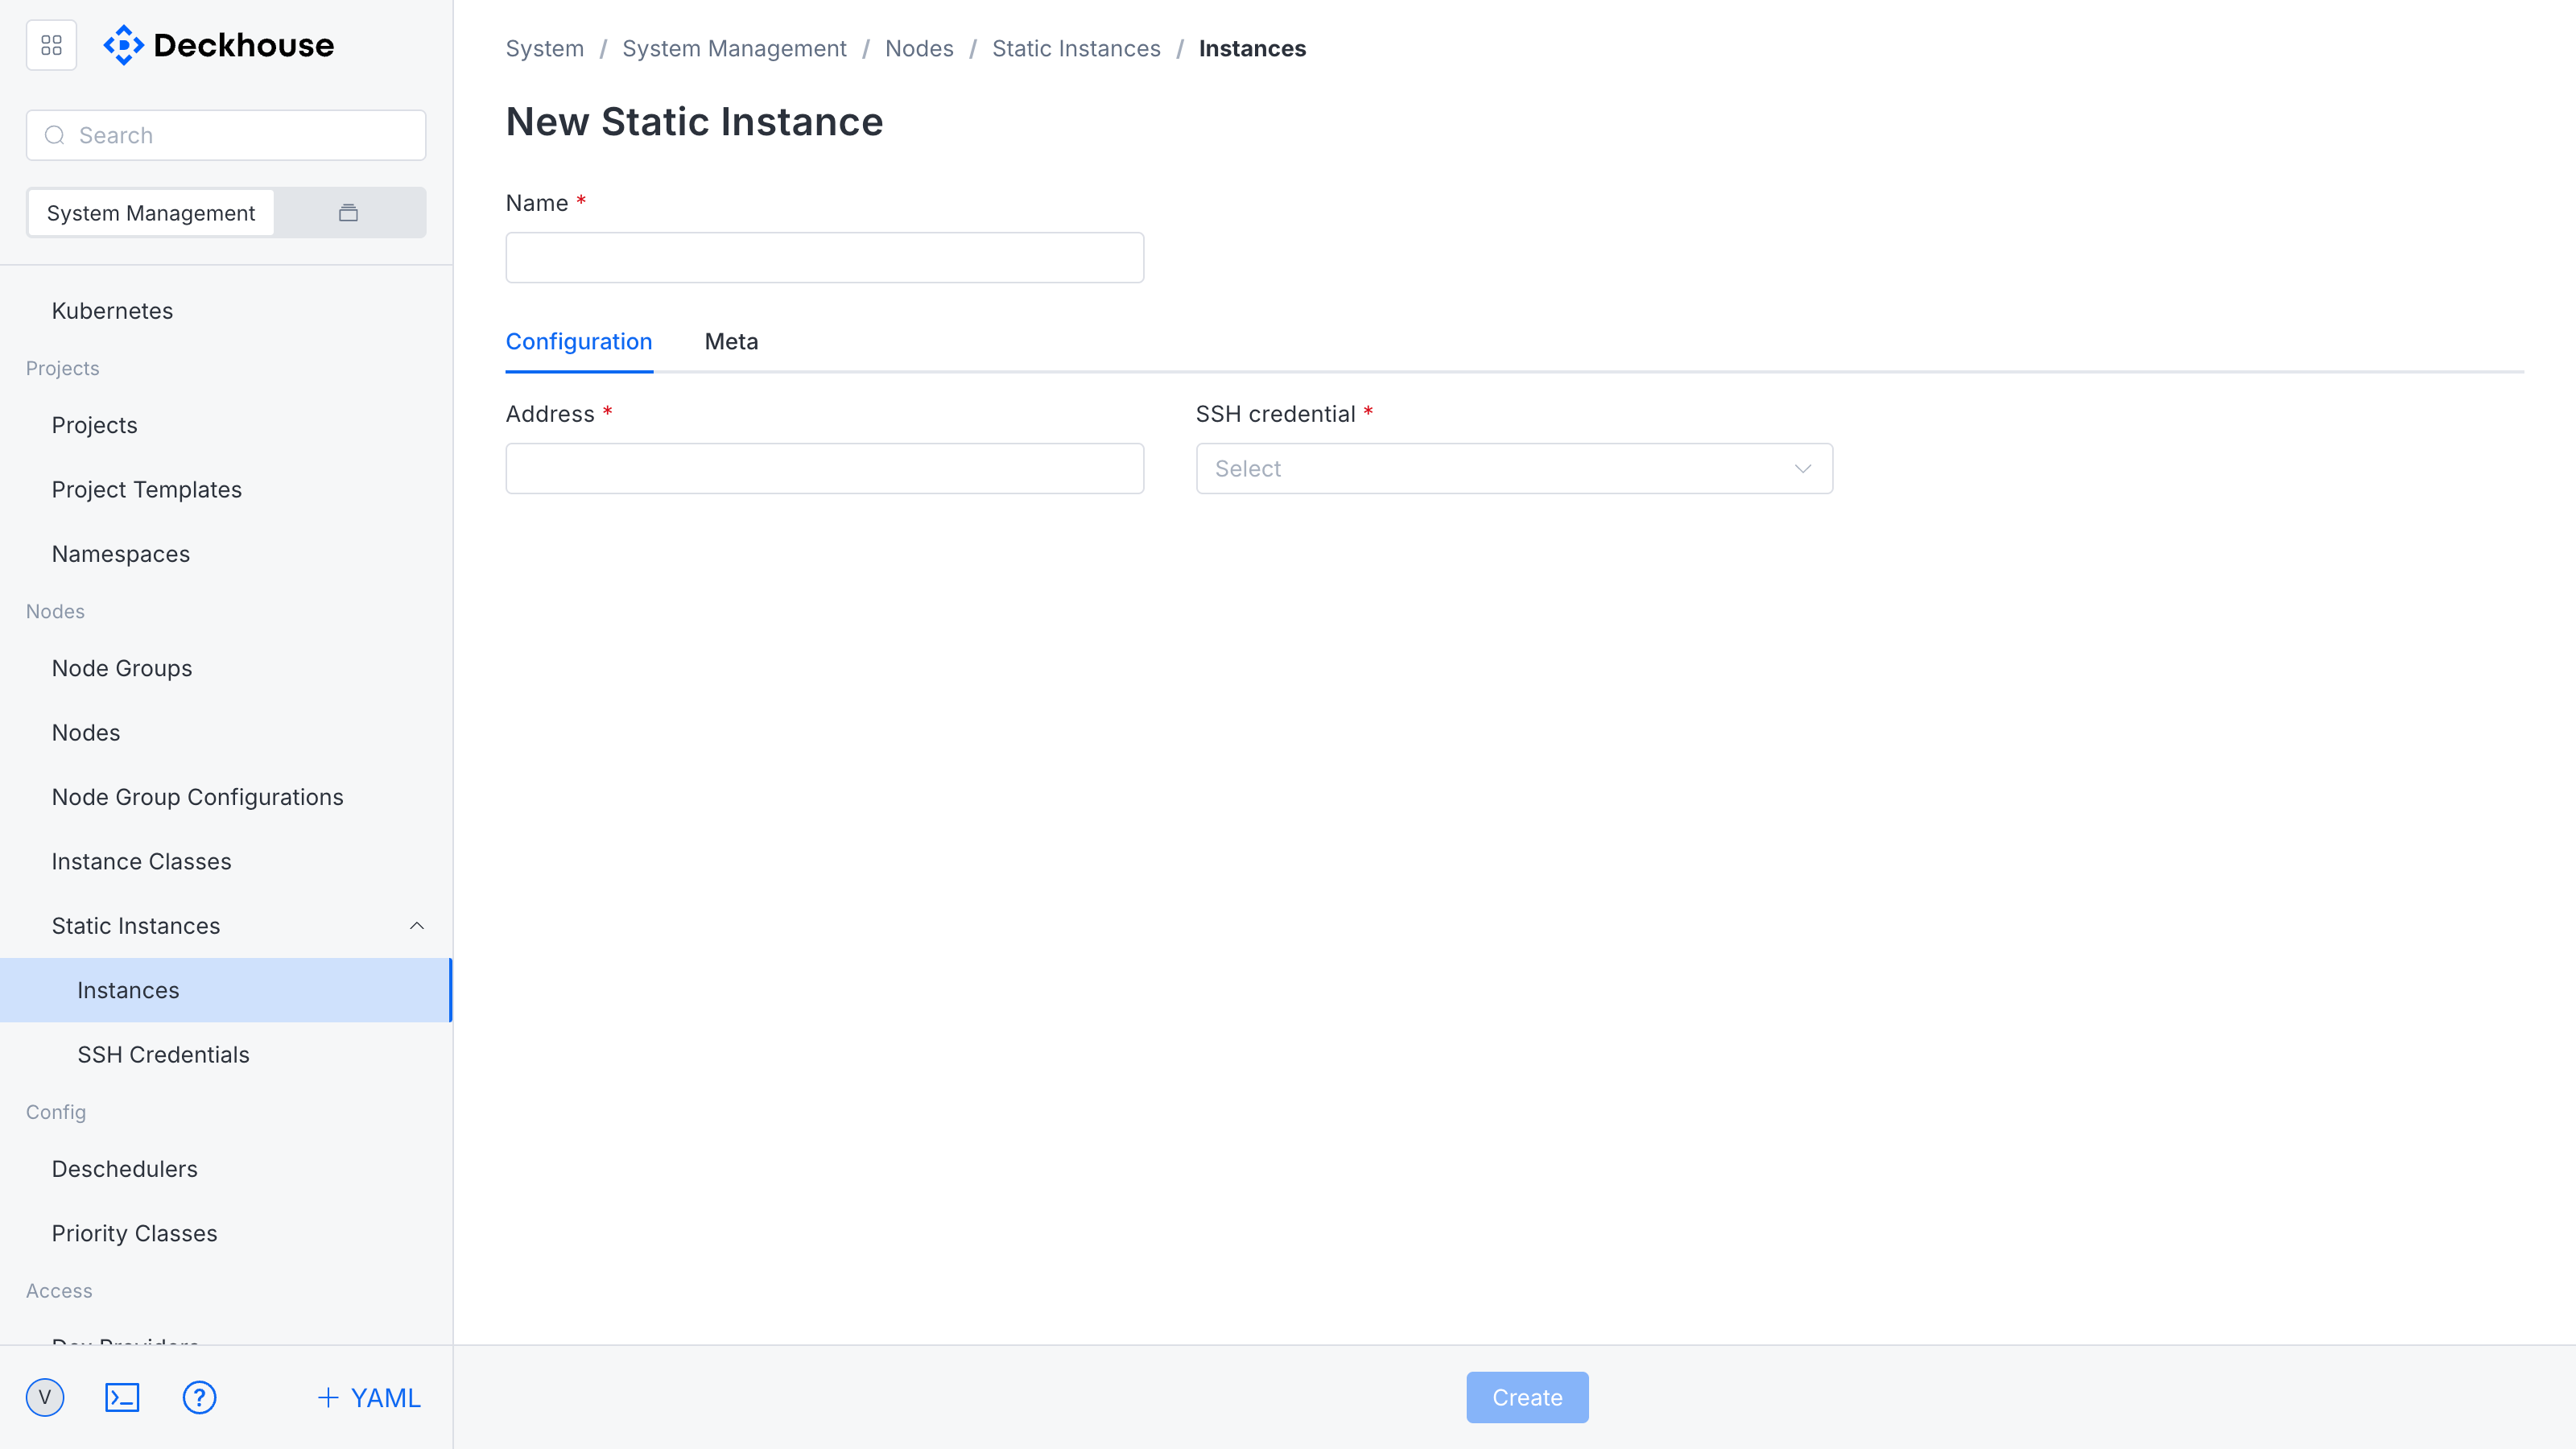
The “Add instance” button on the “Instances” tab opens the form for adding a new instance to the cluster. The form requires the following information:
- Instance name
- Instance address
- SSH access method from the drop-down list
Additionally, you can specify labels by defining keys and values for further identification and management of the instance.
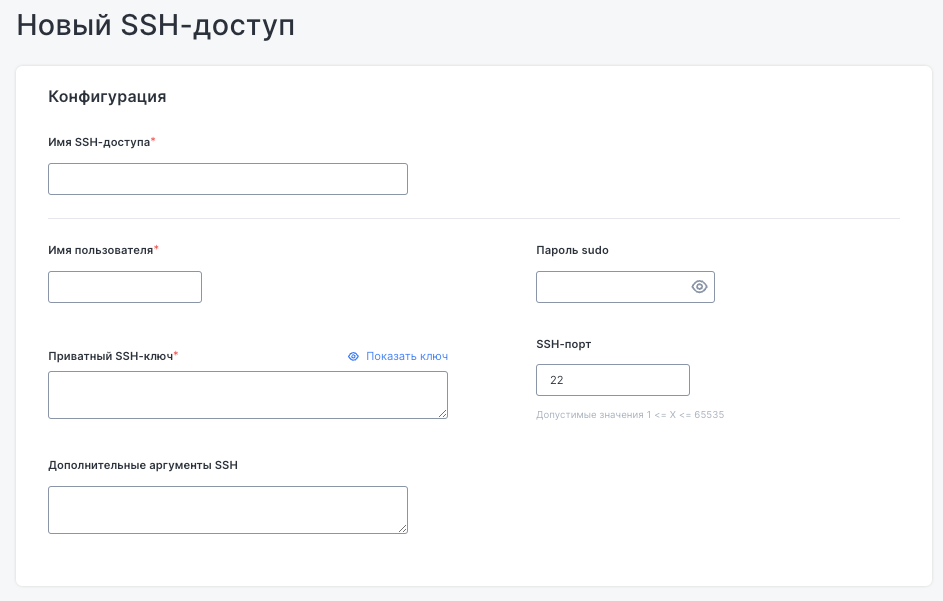
The “Add SSH access” button on the “SSH access” tab opens the form for configuring SSH connections to nodes. The form requires the following information:
- SSH access name
- Username
- Private SSH key
- (Optional)
sudopassword for executing privileged commands
Additional fields are available for changing the SSH port and adding extra SSH arguments.
Multitenancy
“Projects” subsection
This subsection is intended for creating projects based on prepared templates that define the set of resources to be created and their parameters.
During project creation, the following operations are performed:
- Parameter validation against the OpenAPI schema.
- Template rendering through Helm.
- Deployment of all described resources in an automatically created namespace.
Standard Kubernetes mechanisms are used for access control, resource limits, and network isolation. This allows you to manage security and workload inside the namespace.
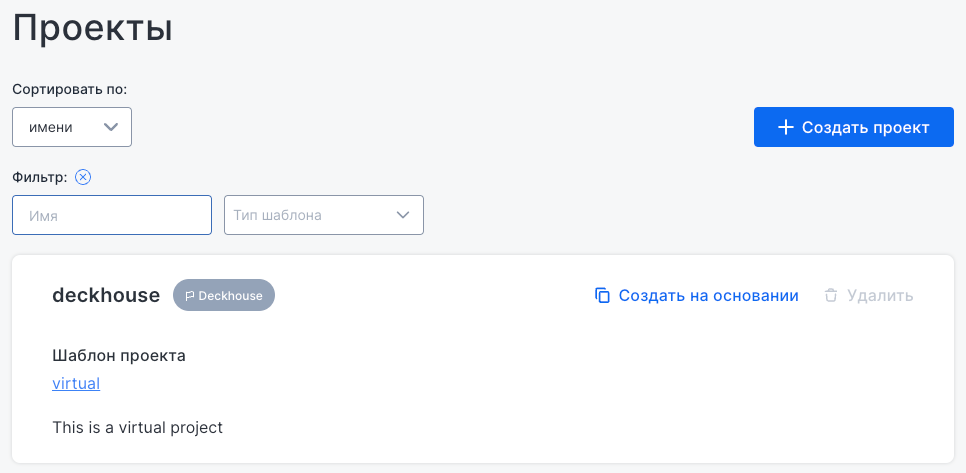
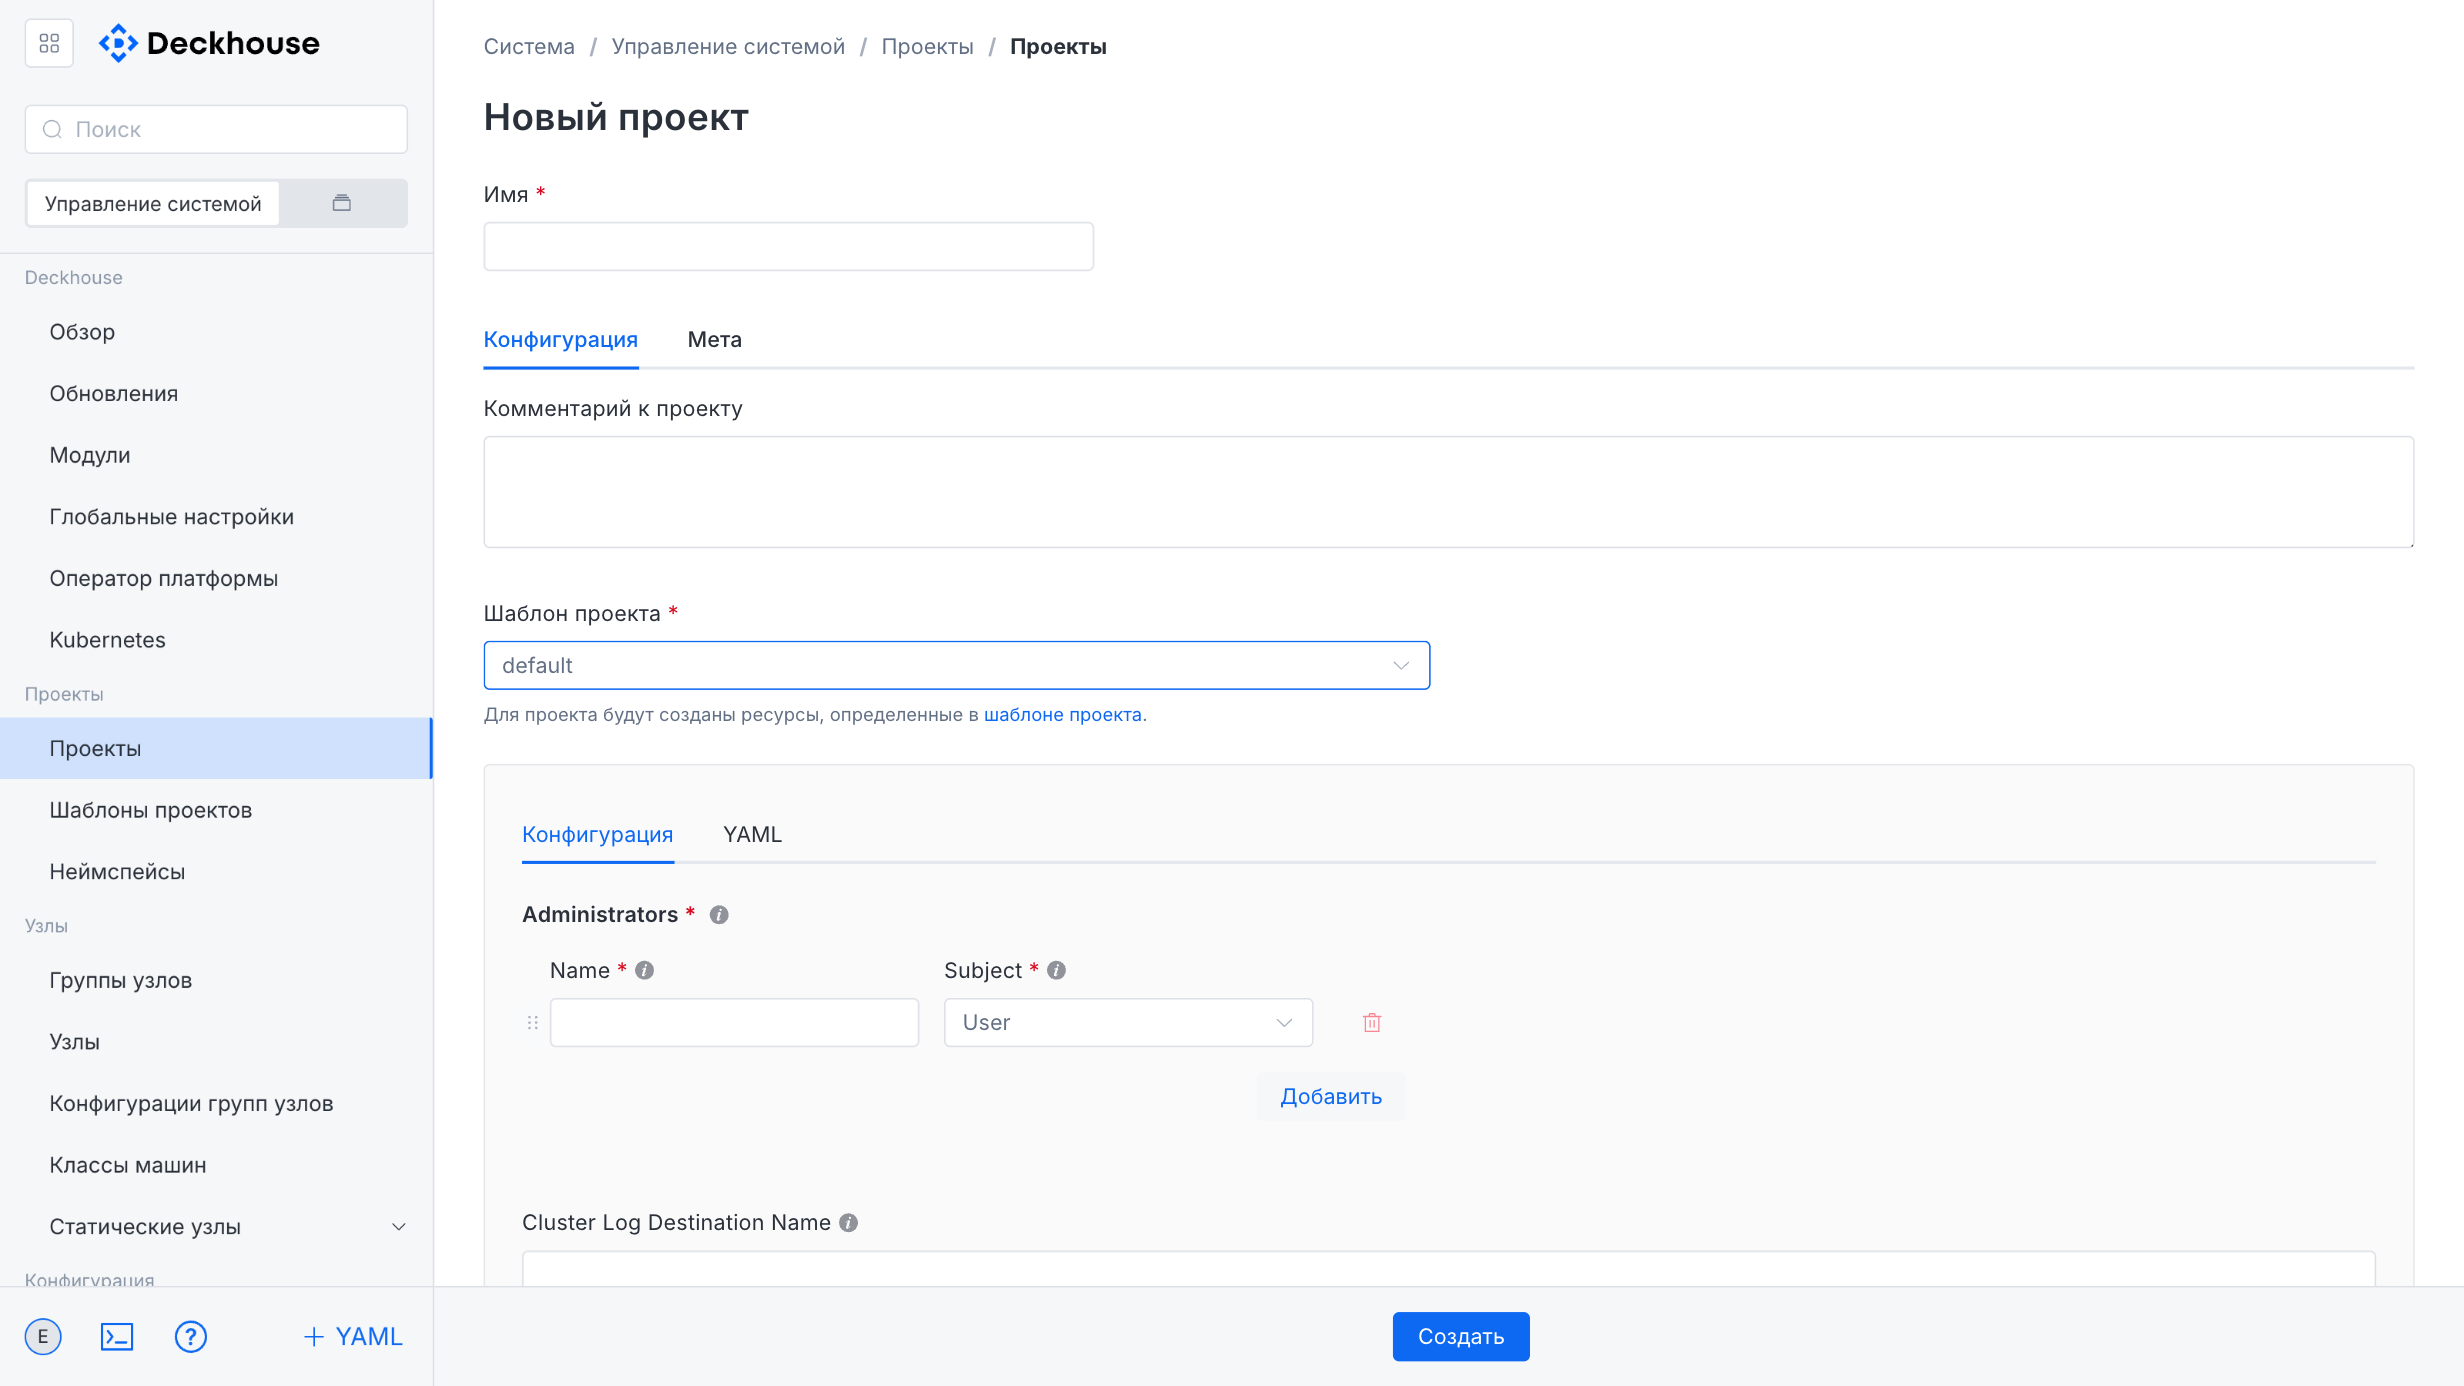
The “Create project” button opens the form for adding a new project based on the selected template. In the form, specify the project name and optionally add labels and annotations.
In the central part of the form, select the project template based on which the required resources will be created. If necessary, leave a comment.
The lower part of the form contains fields for entering template parameters and displaying its structure.
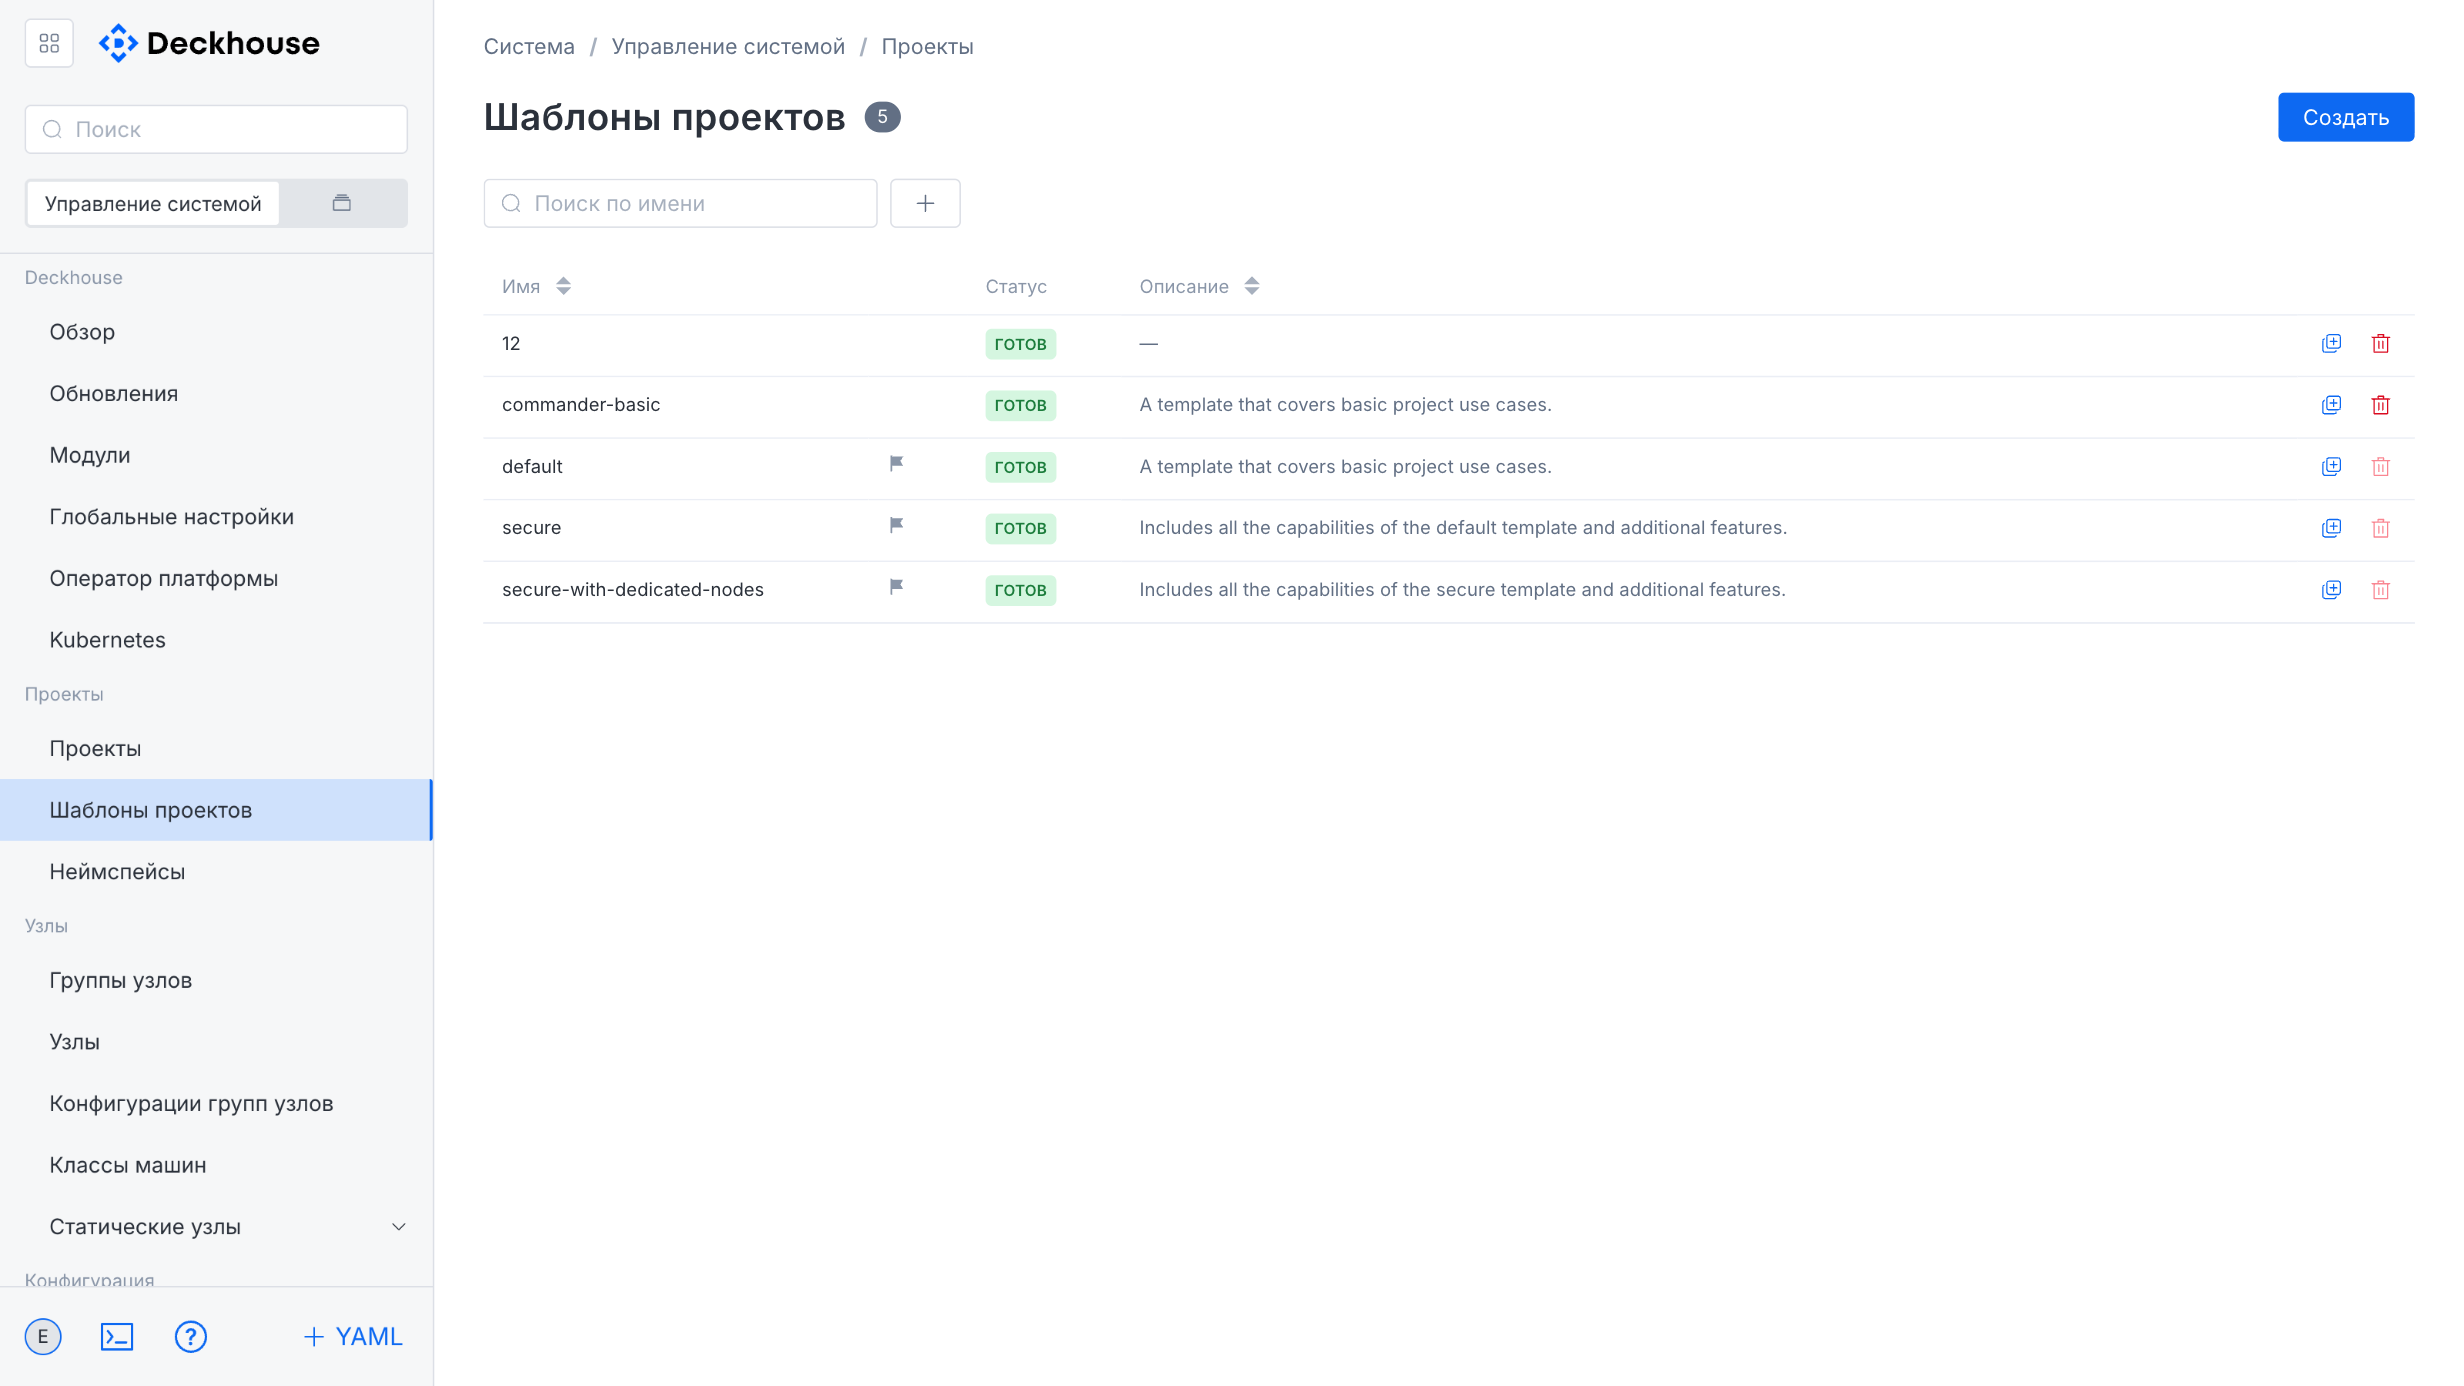
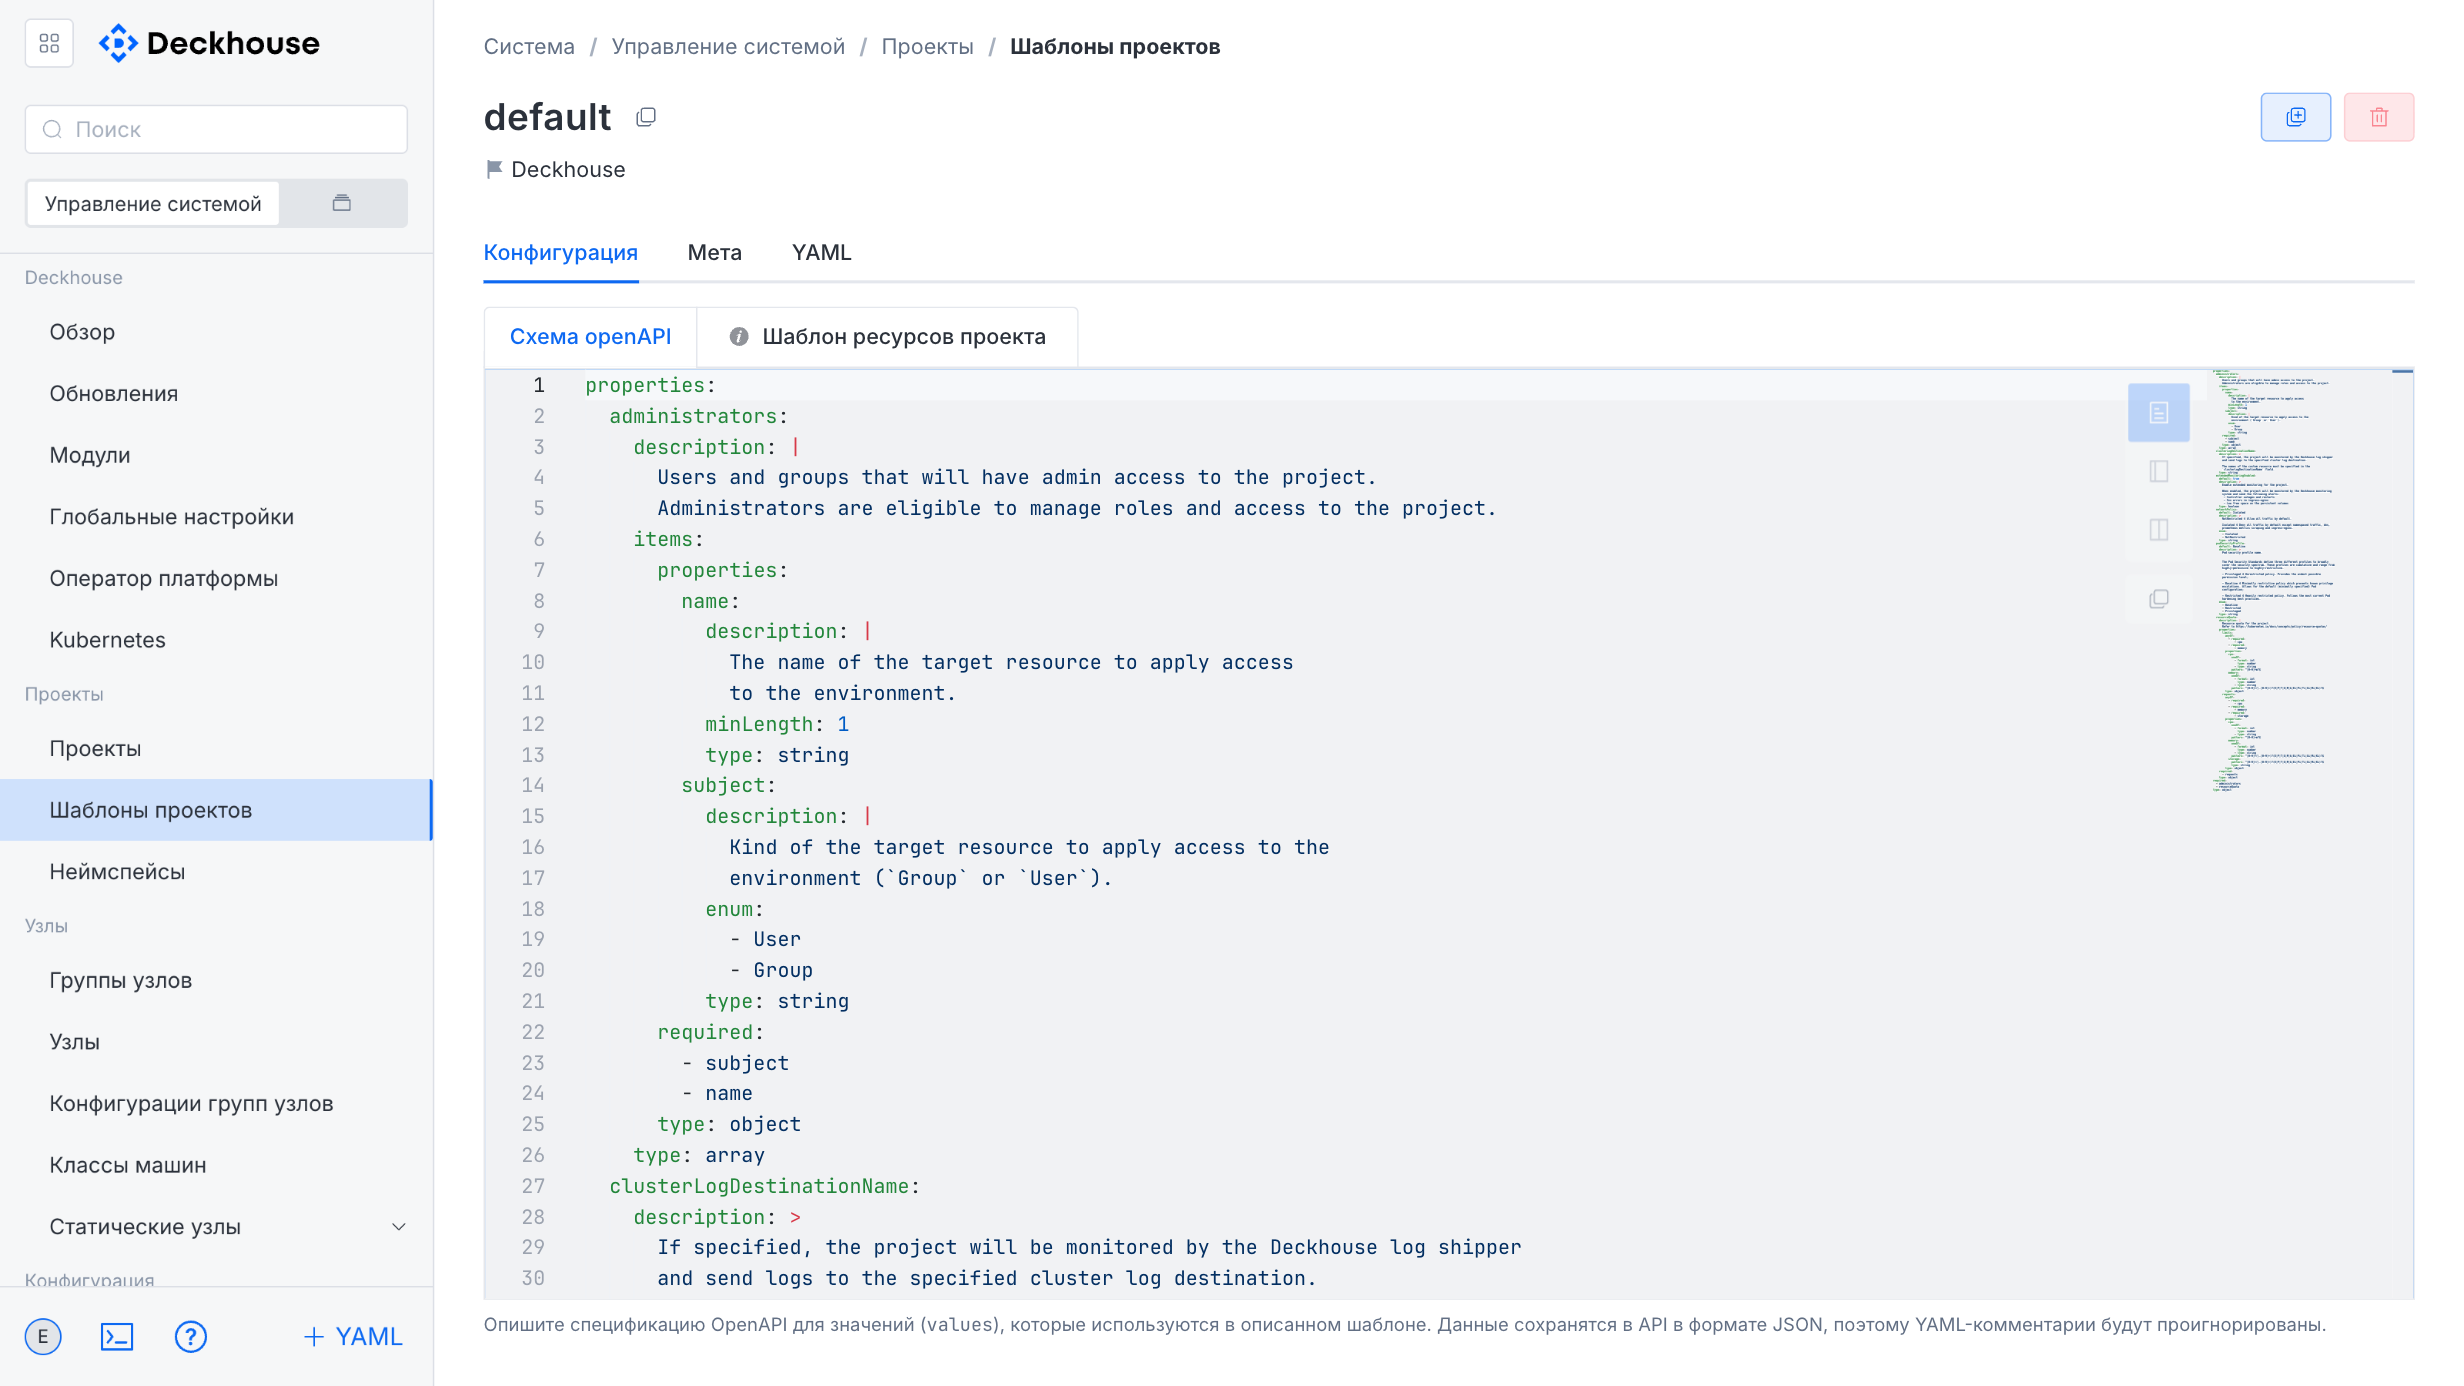
“Project templates” subsection
This subsection is intended for creating project templates.
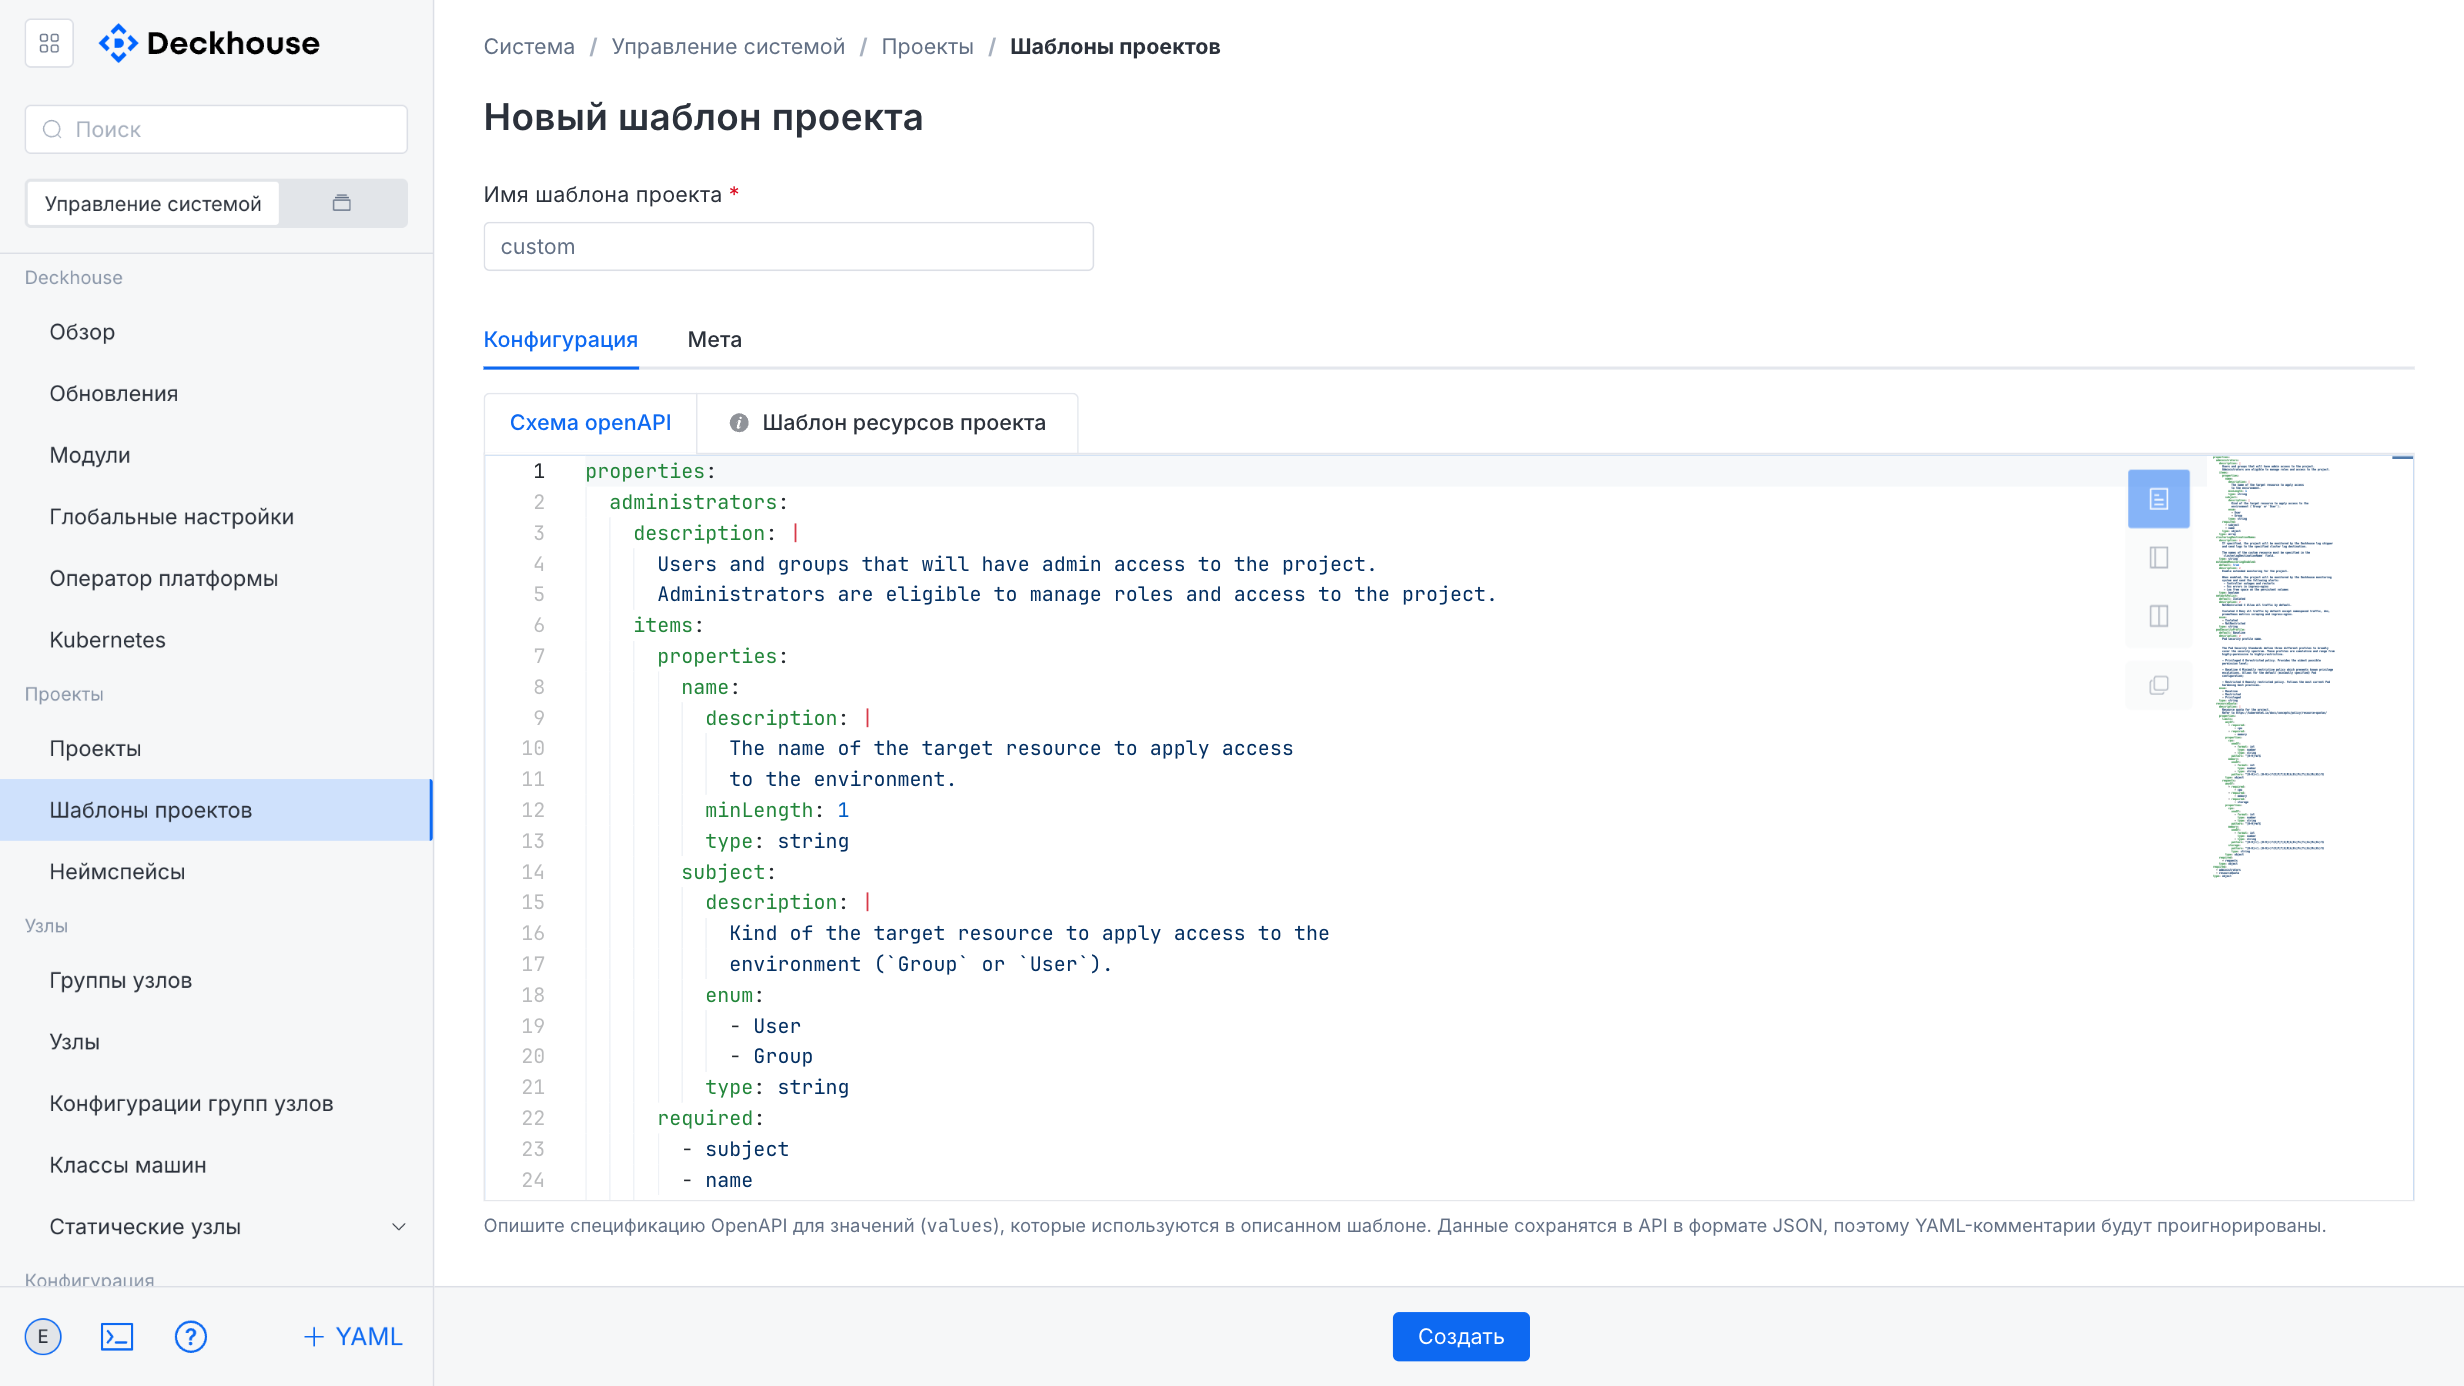
Project templates include basic usage scenarios by default and demonstrate DKP capabilities. To add a new template, use the “Create” button in the upper-right corner.
The “New project template” form lets you specify the template name and add labels and annotations for identification.
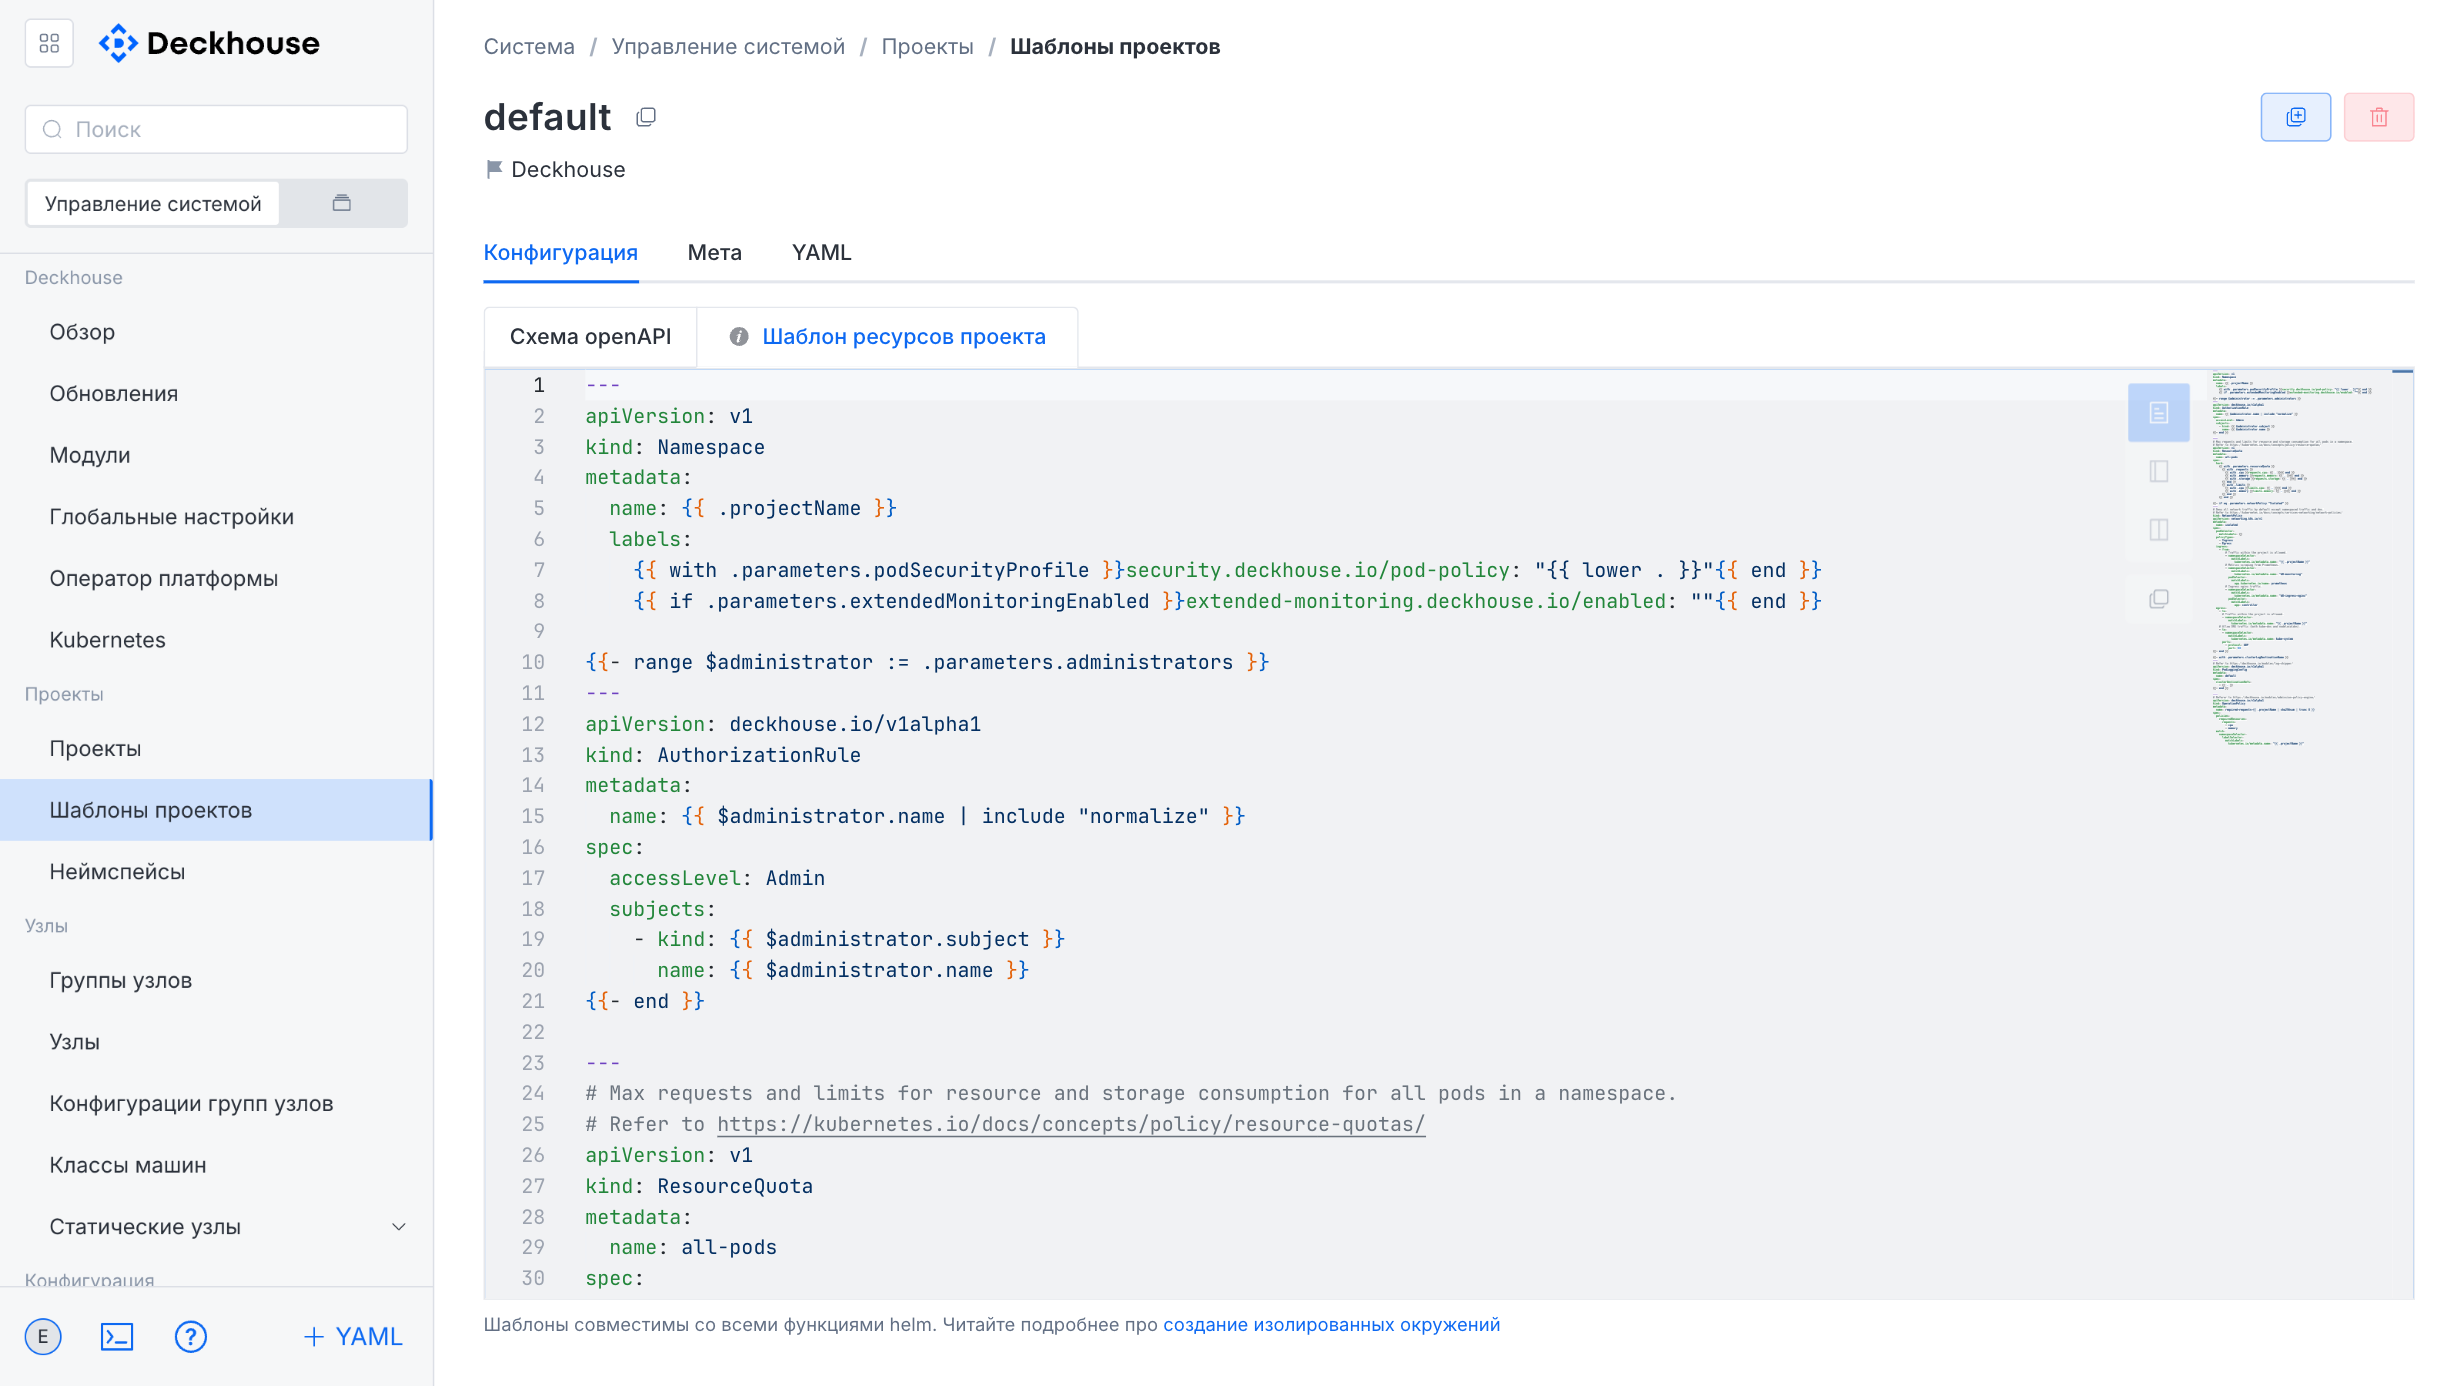
The form contains two tabs:
- “OpenAPI schema”: For describing the value specification in JSON format.
- “Project resource template”: For defining Helm-compatible resources and managing the project environment.
A new template can be created based on an existing one.
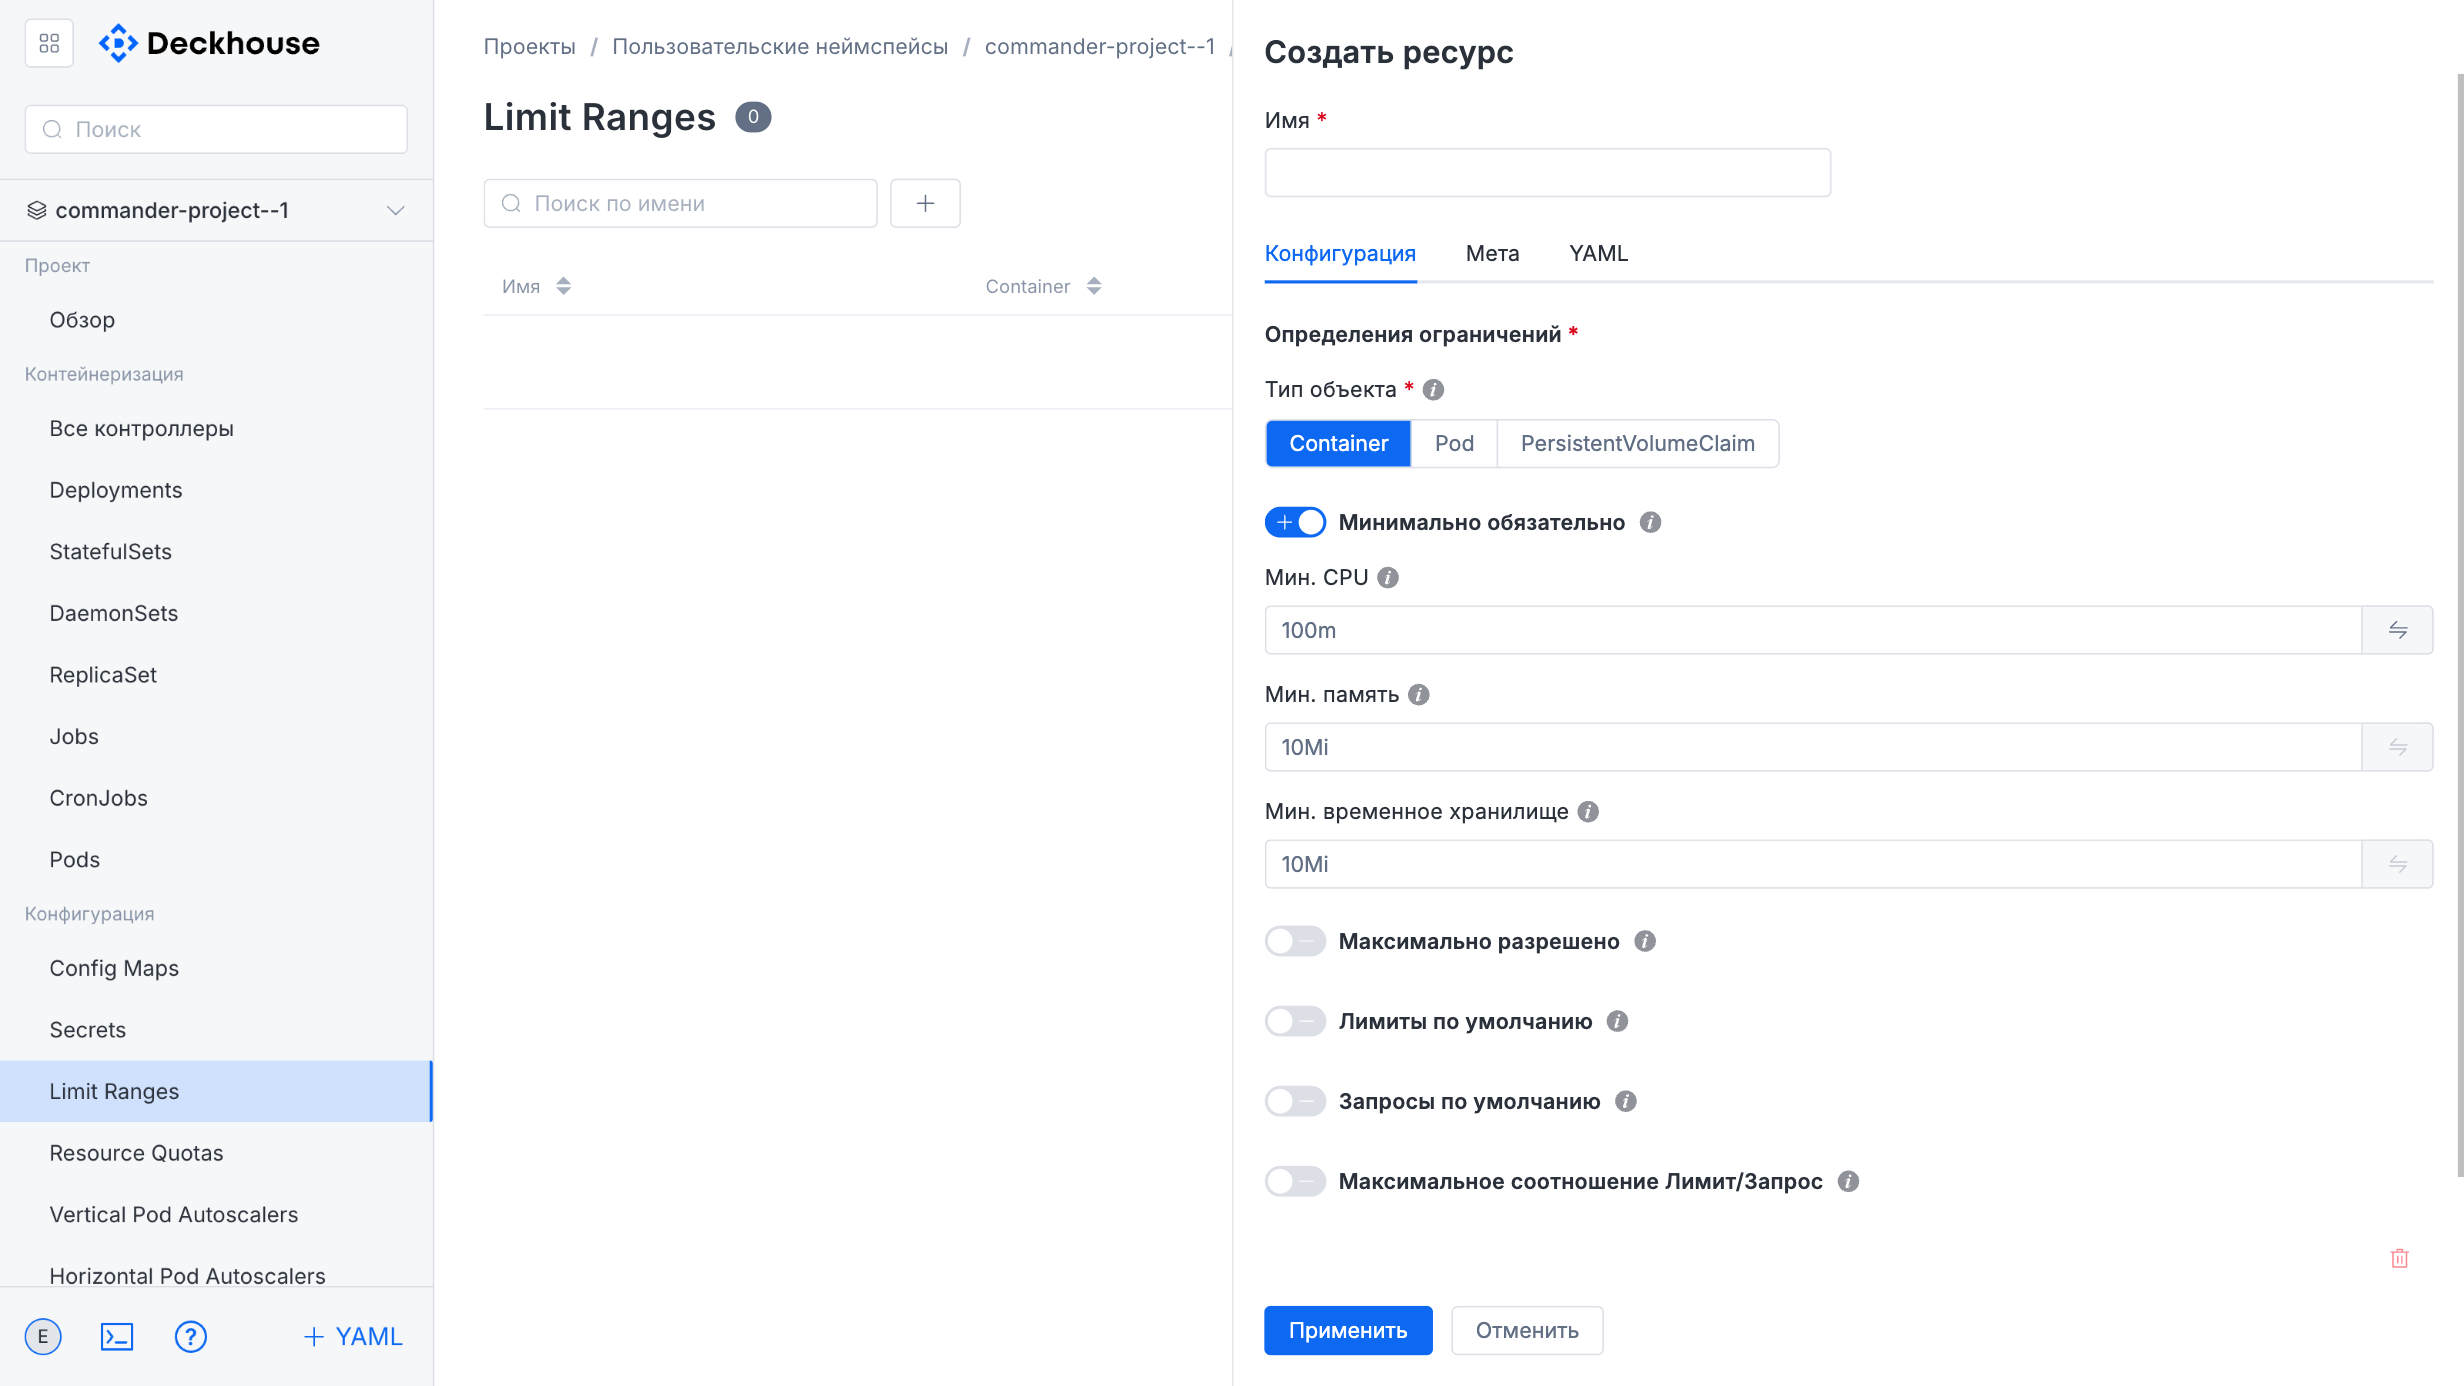
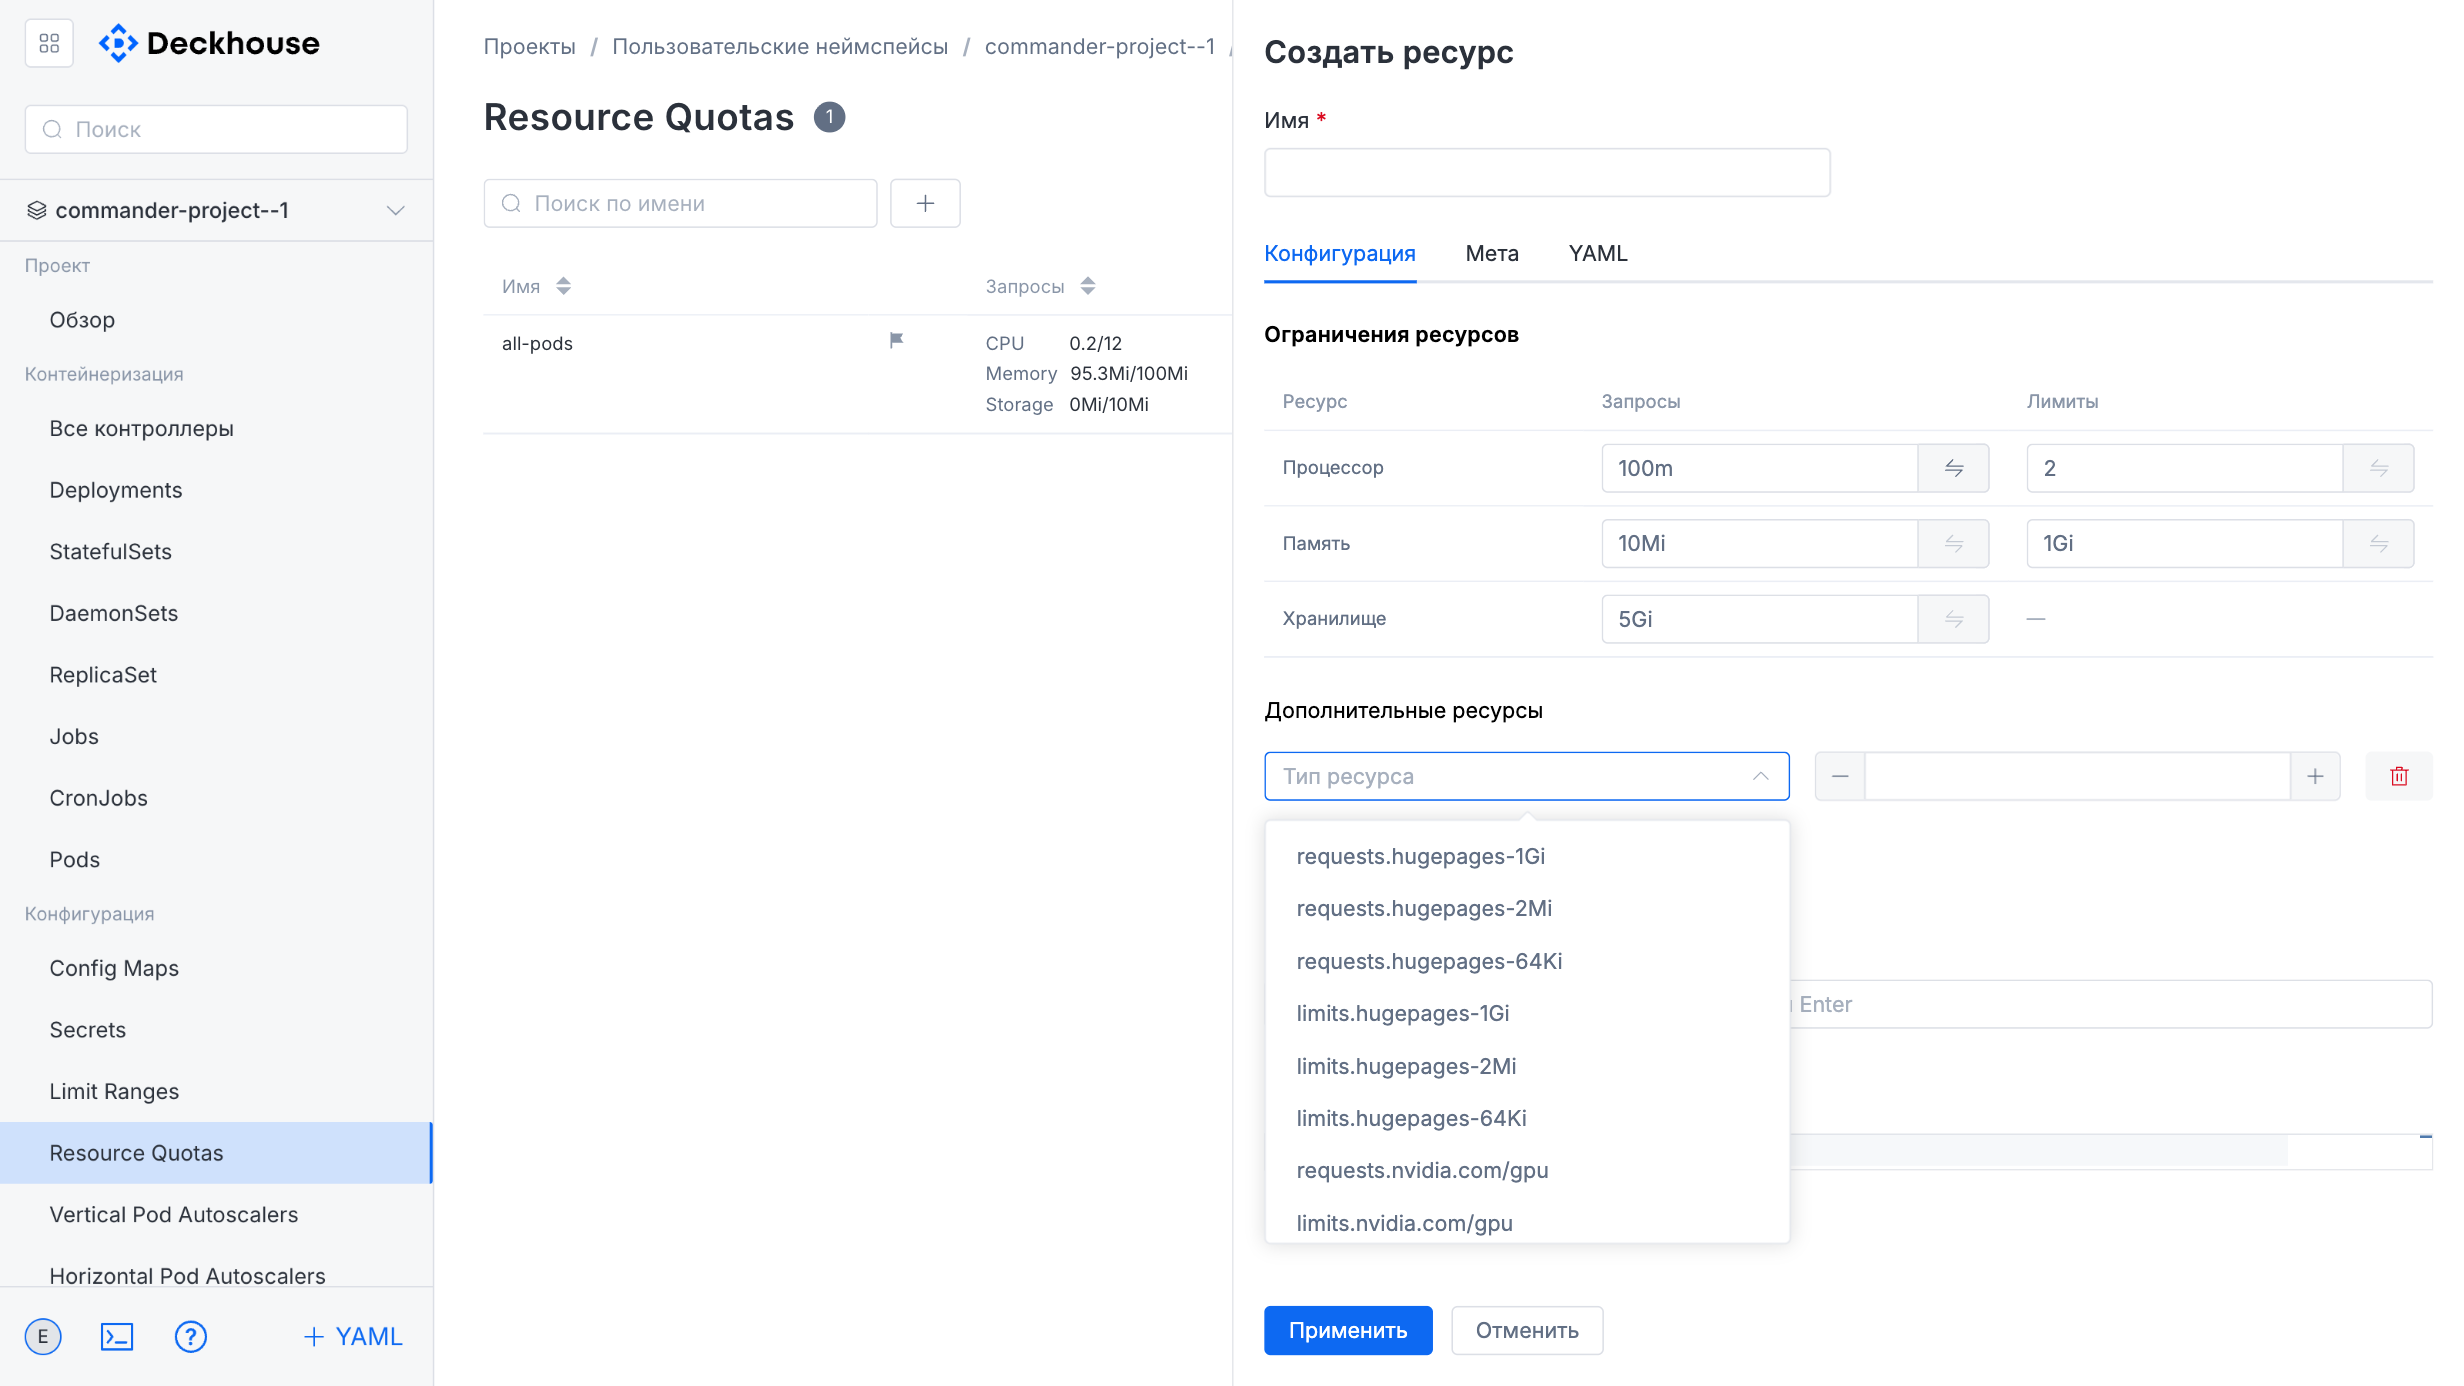
“User namespaces” subsection
This subsection is intended for managing user project namespaces.
The “Overview” section provides information about the general namespace state.
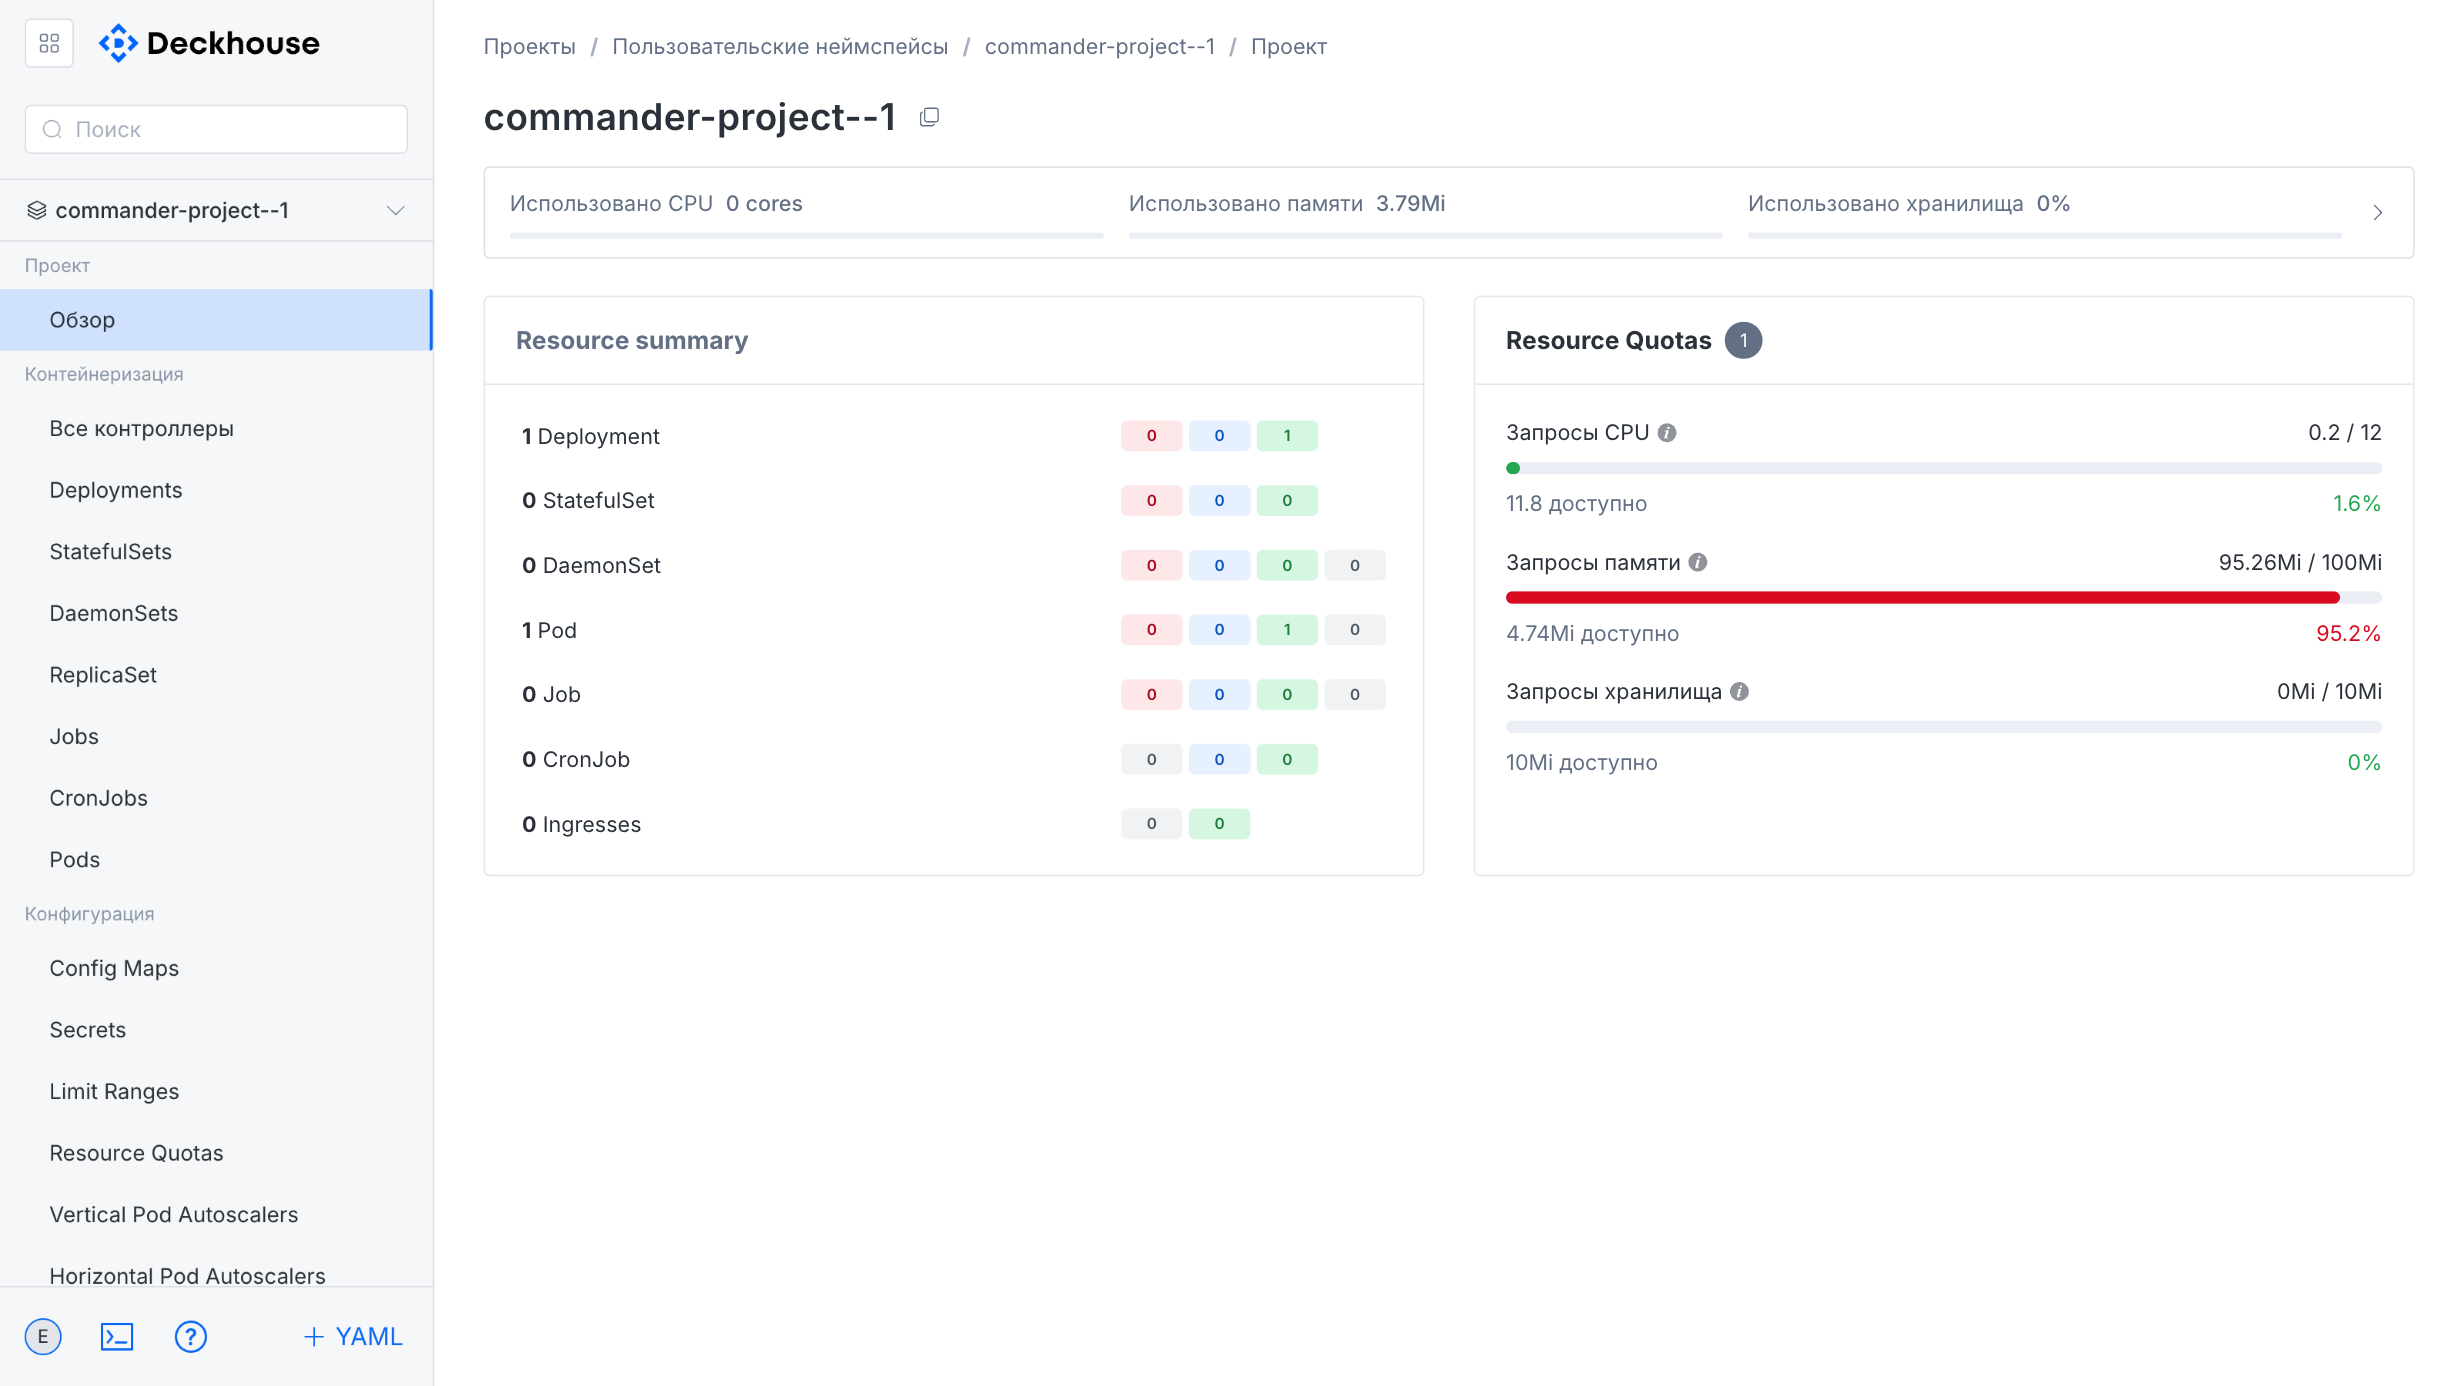
Here you can manage Deployment parameters and other cluster entities.
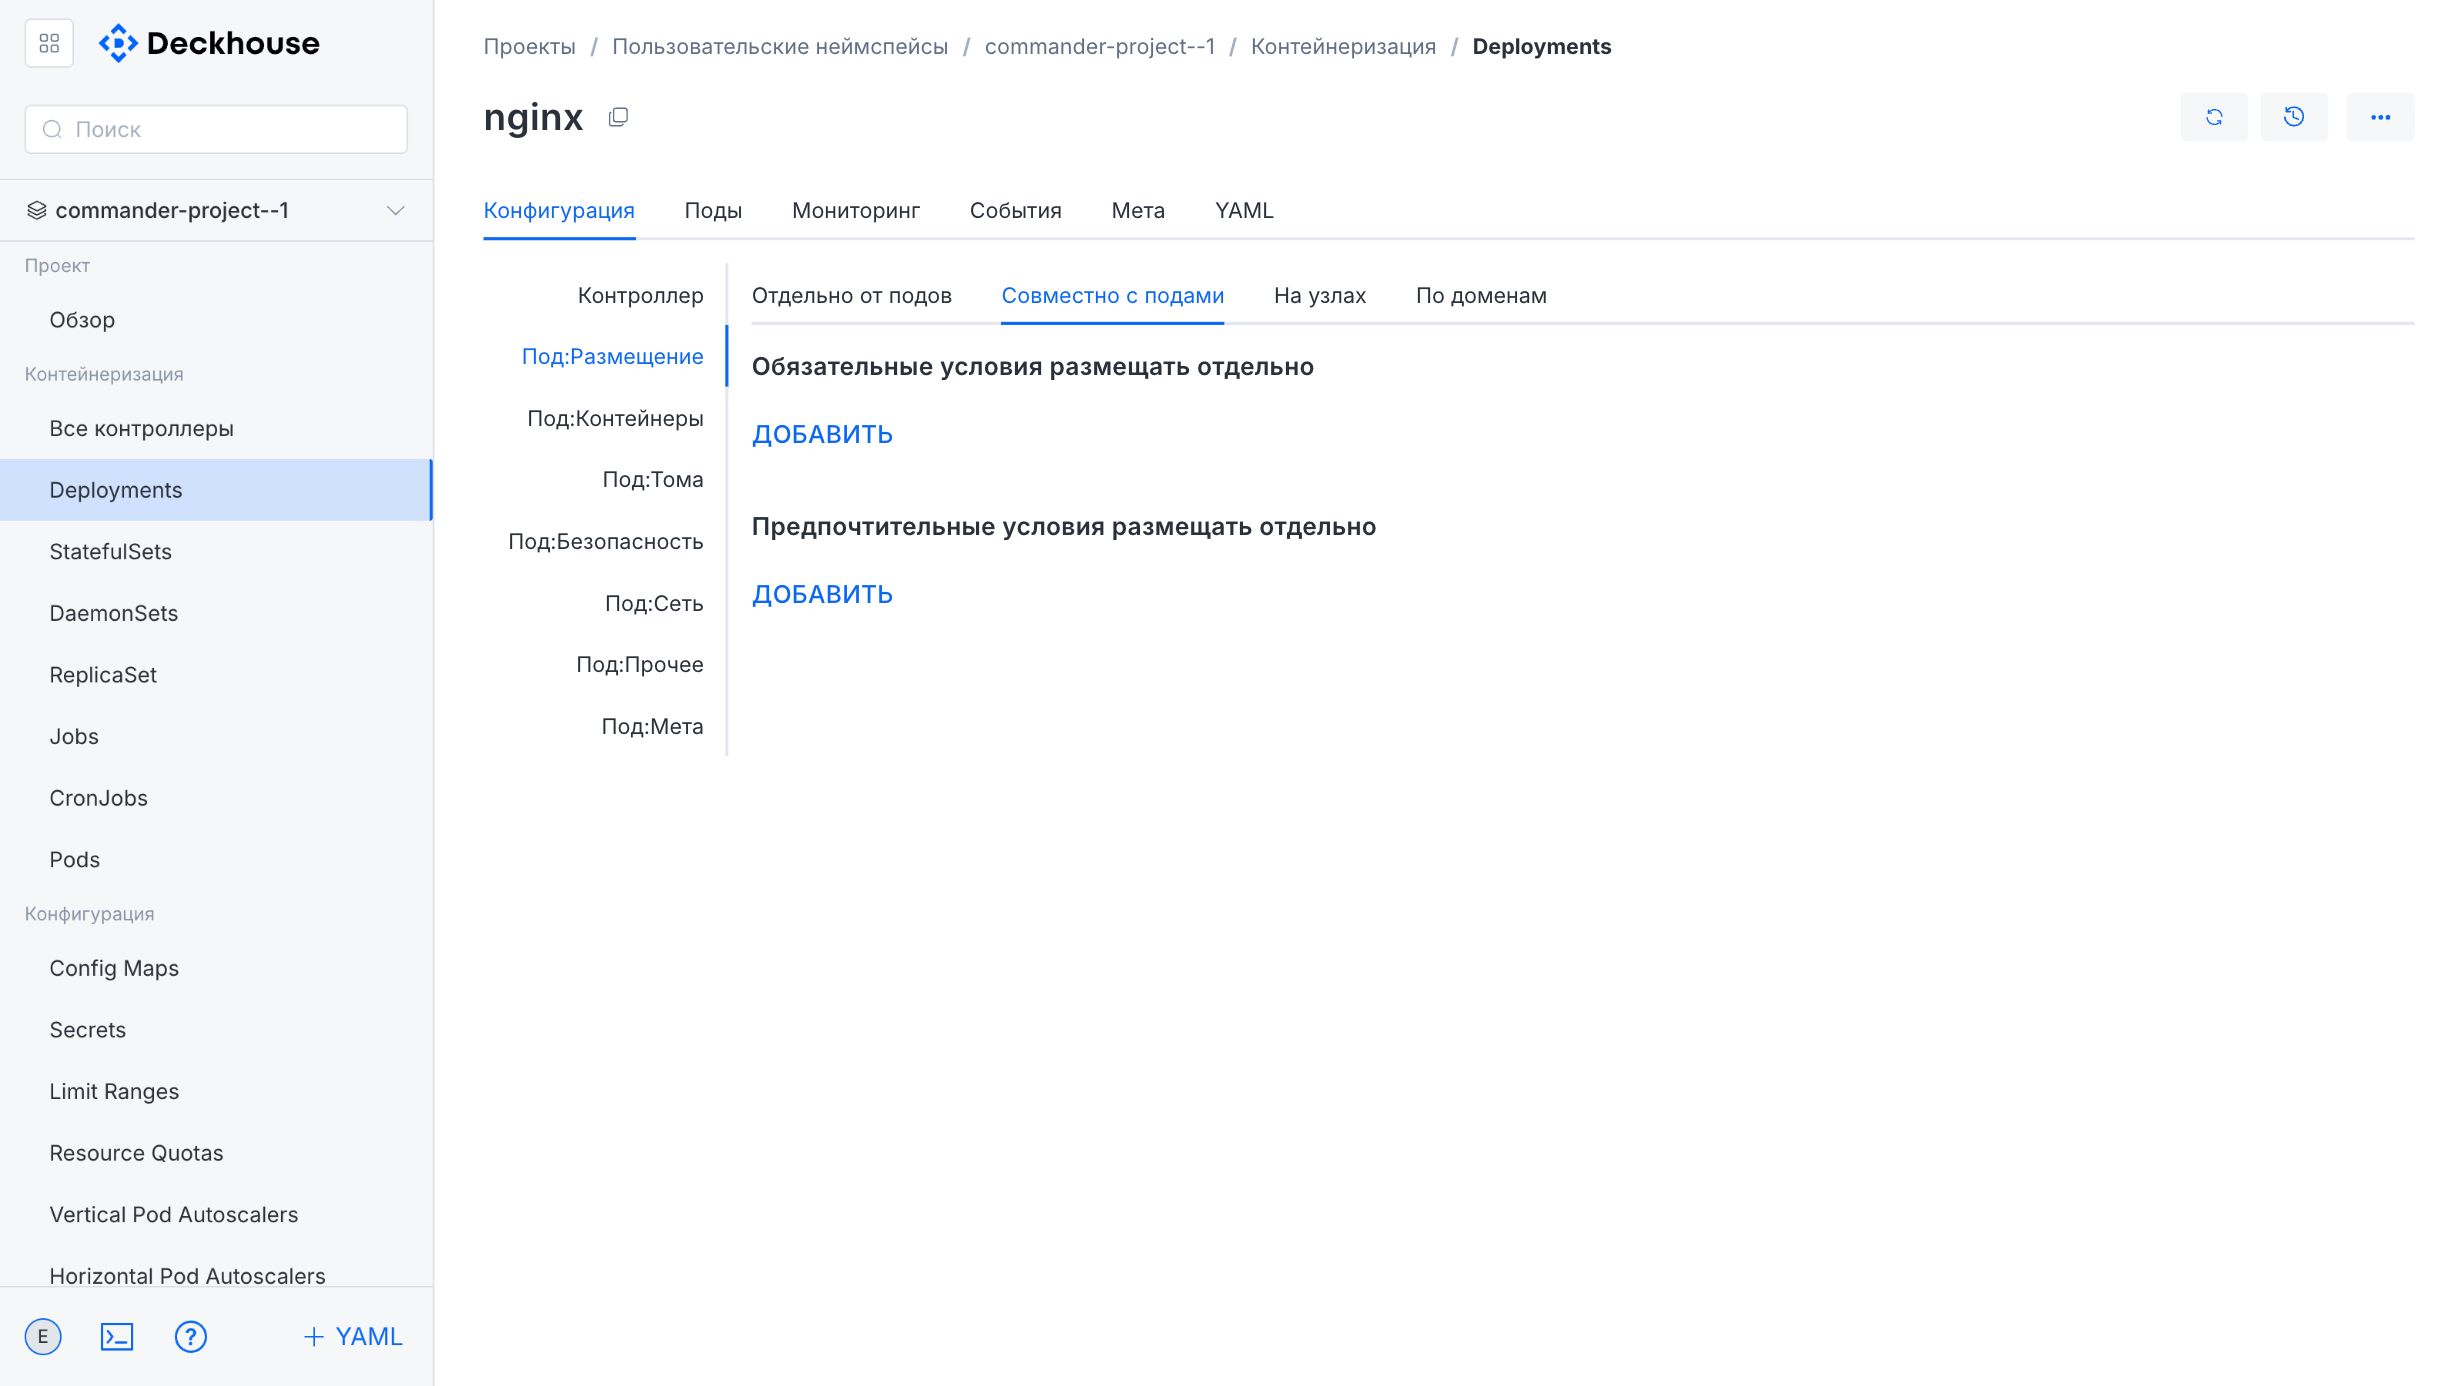
You can also configure resource limits and quotas.
Access
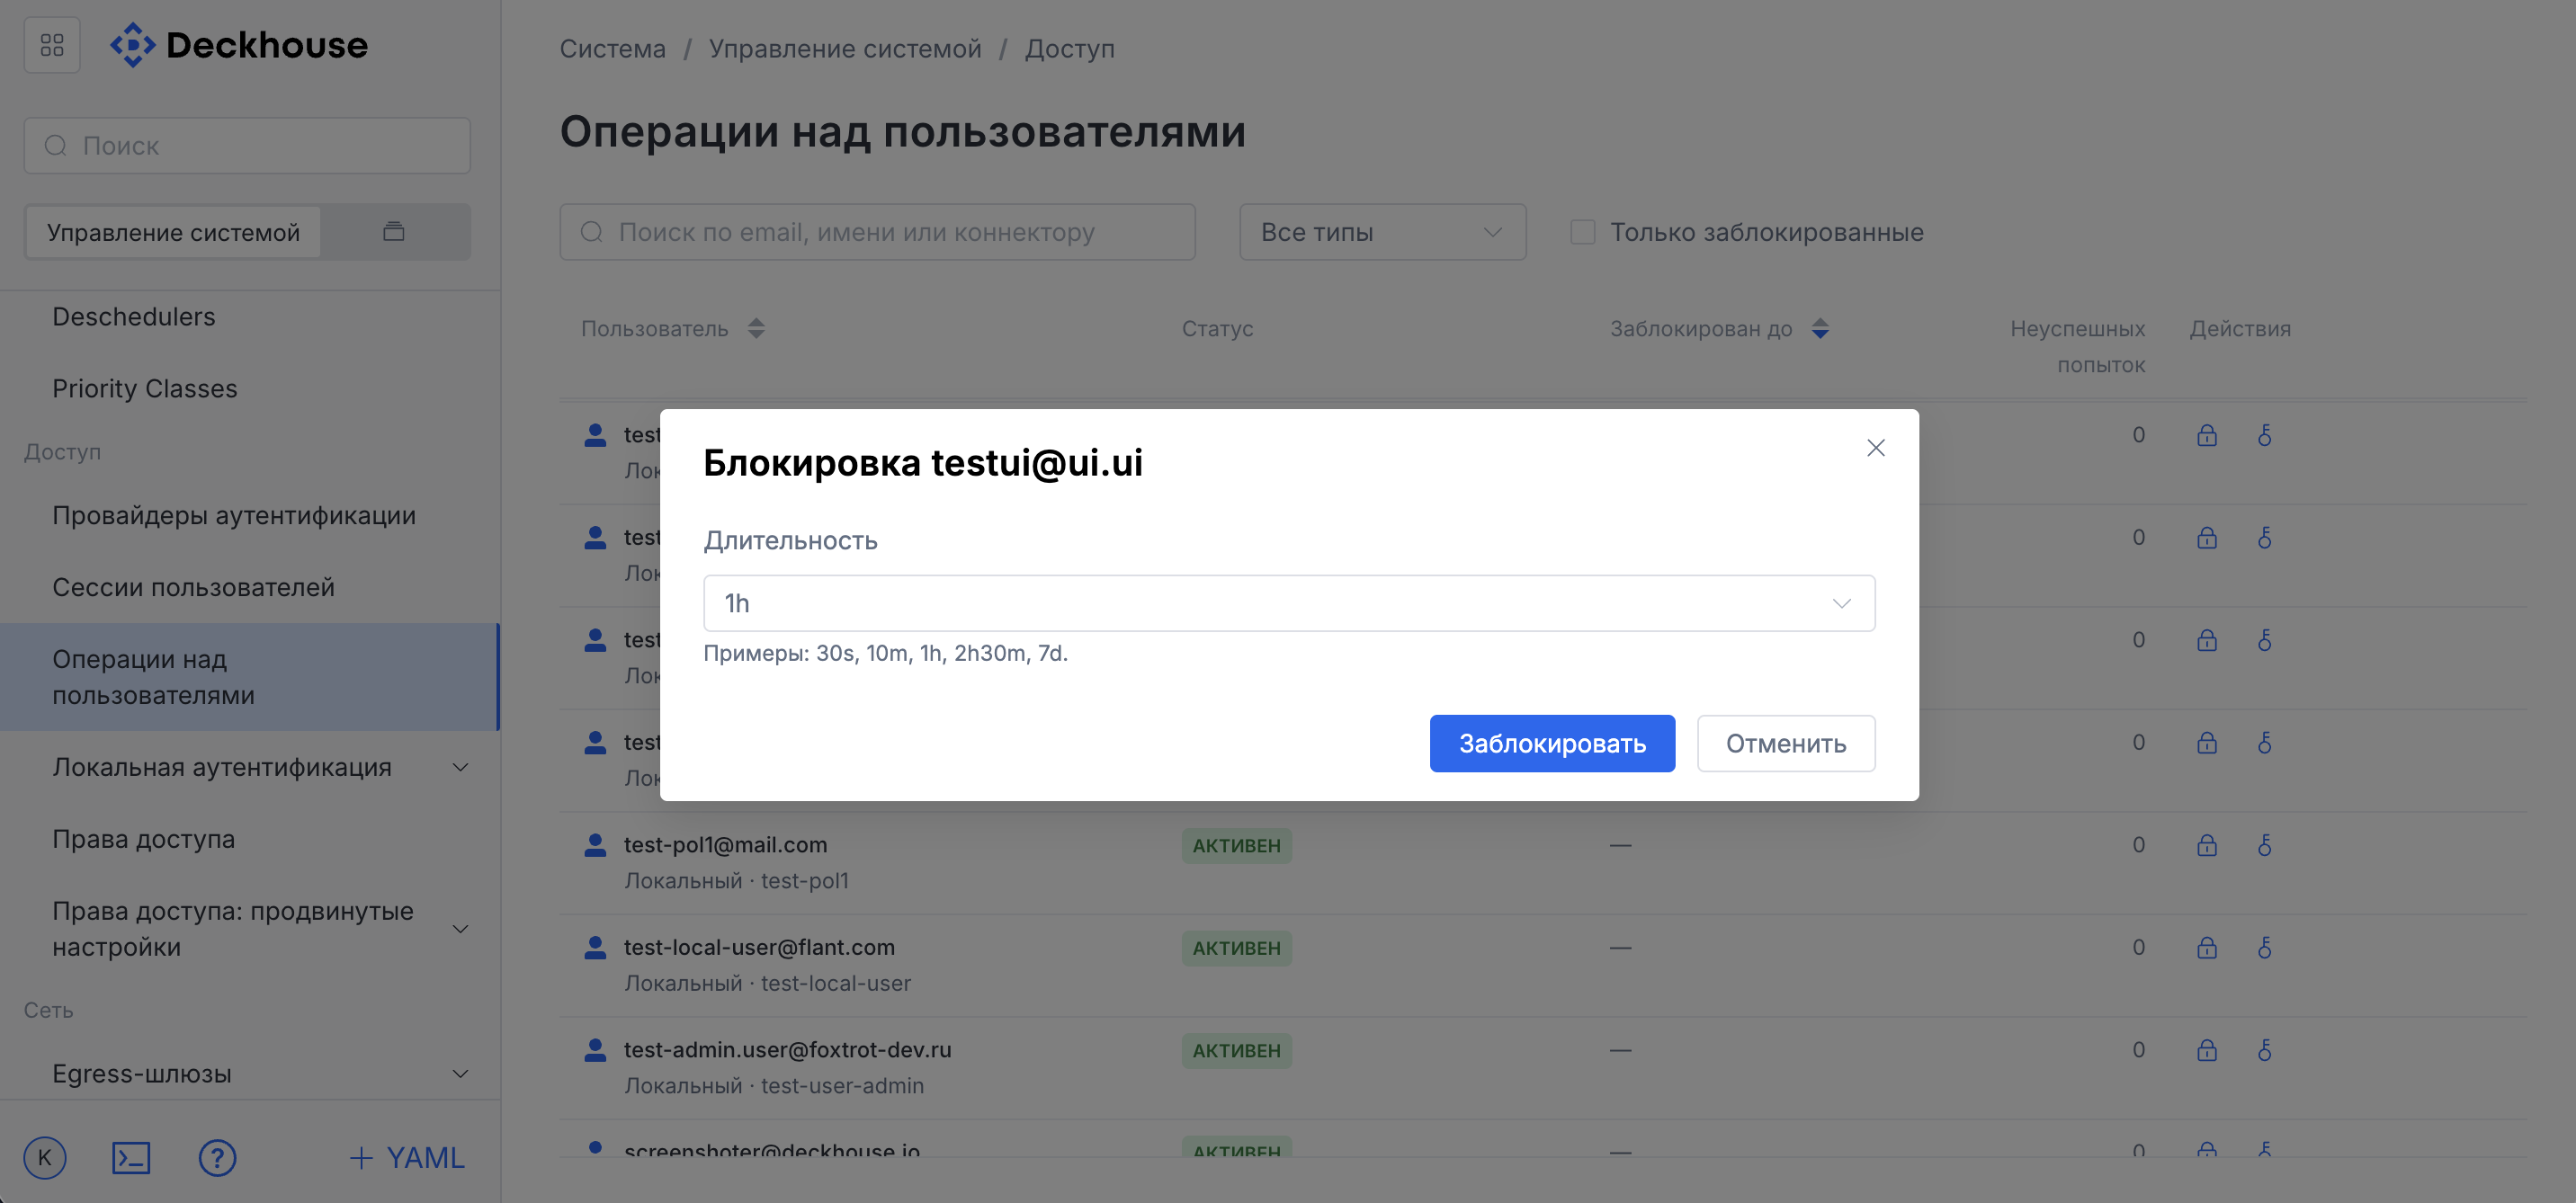
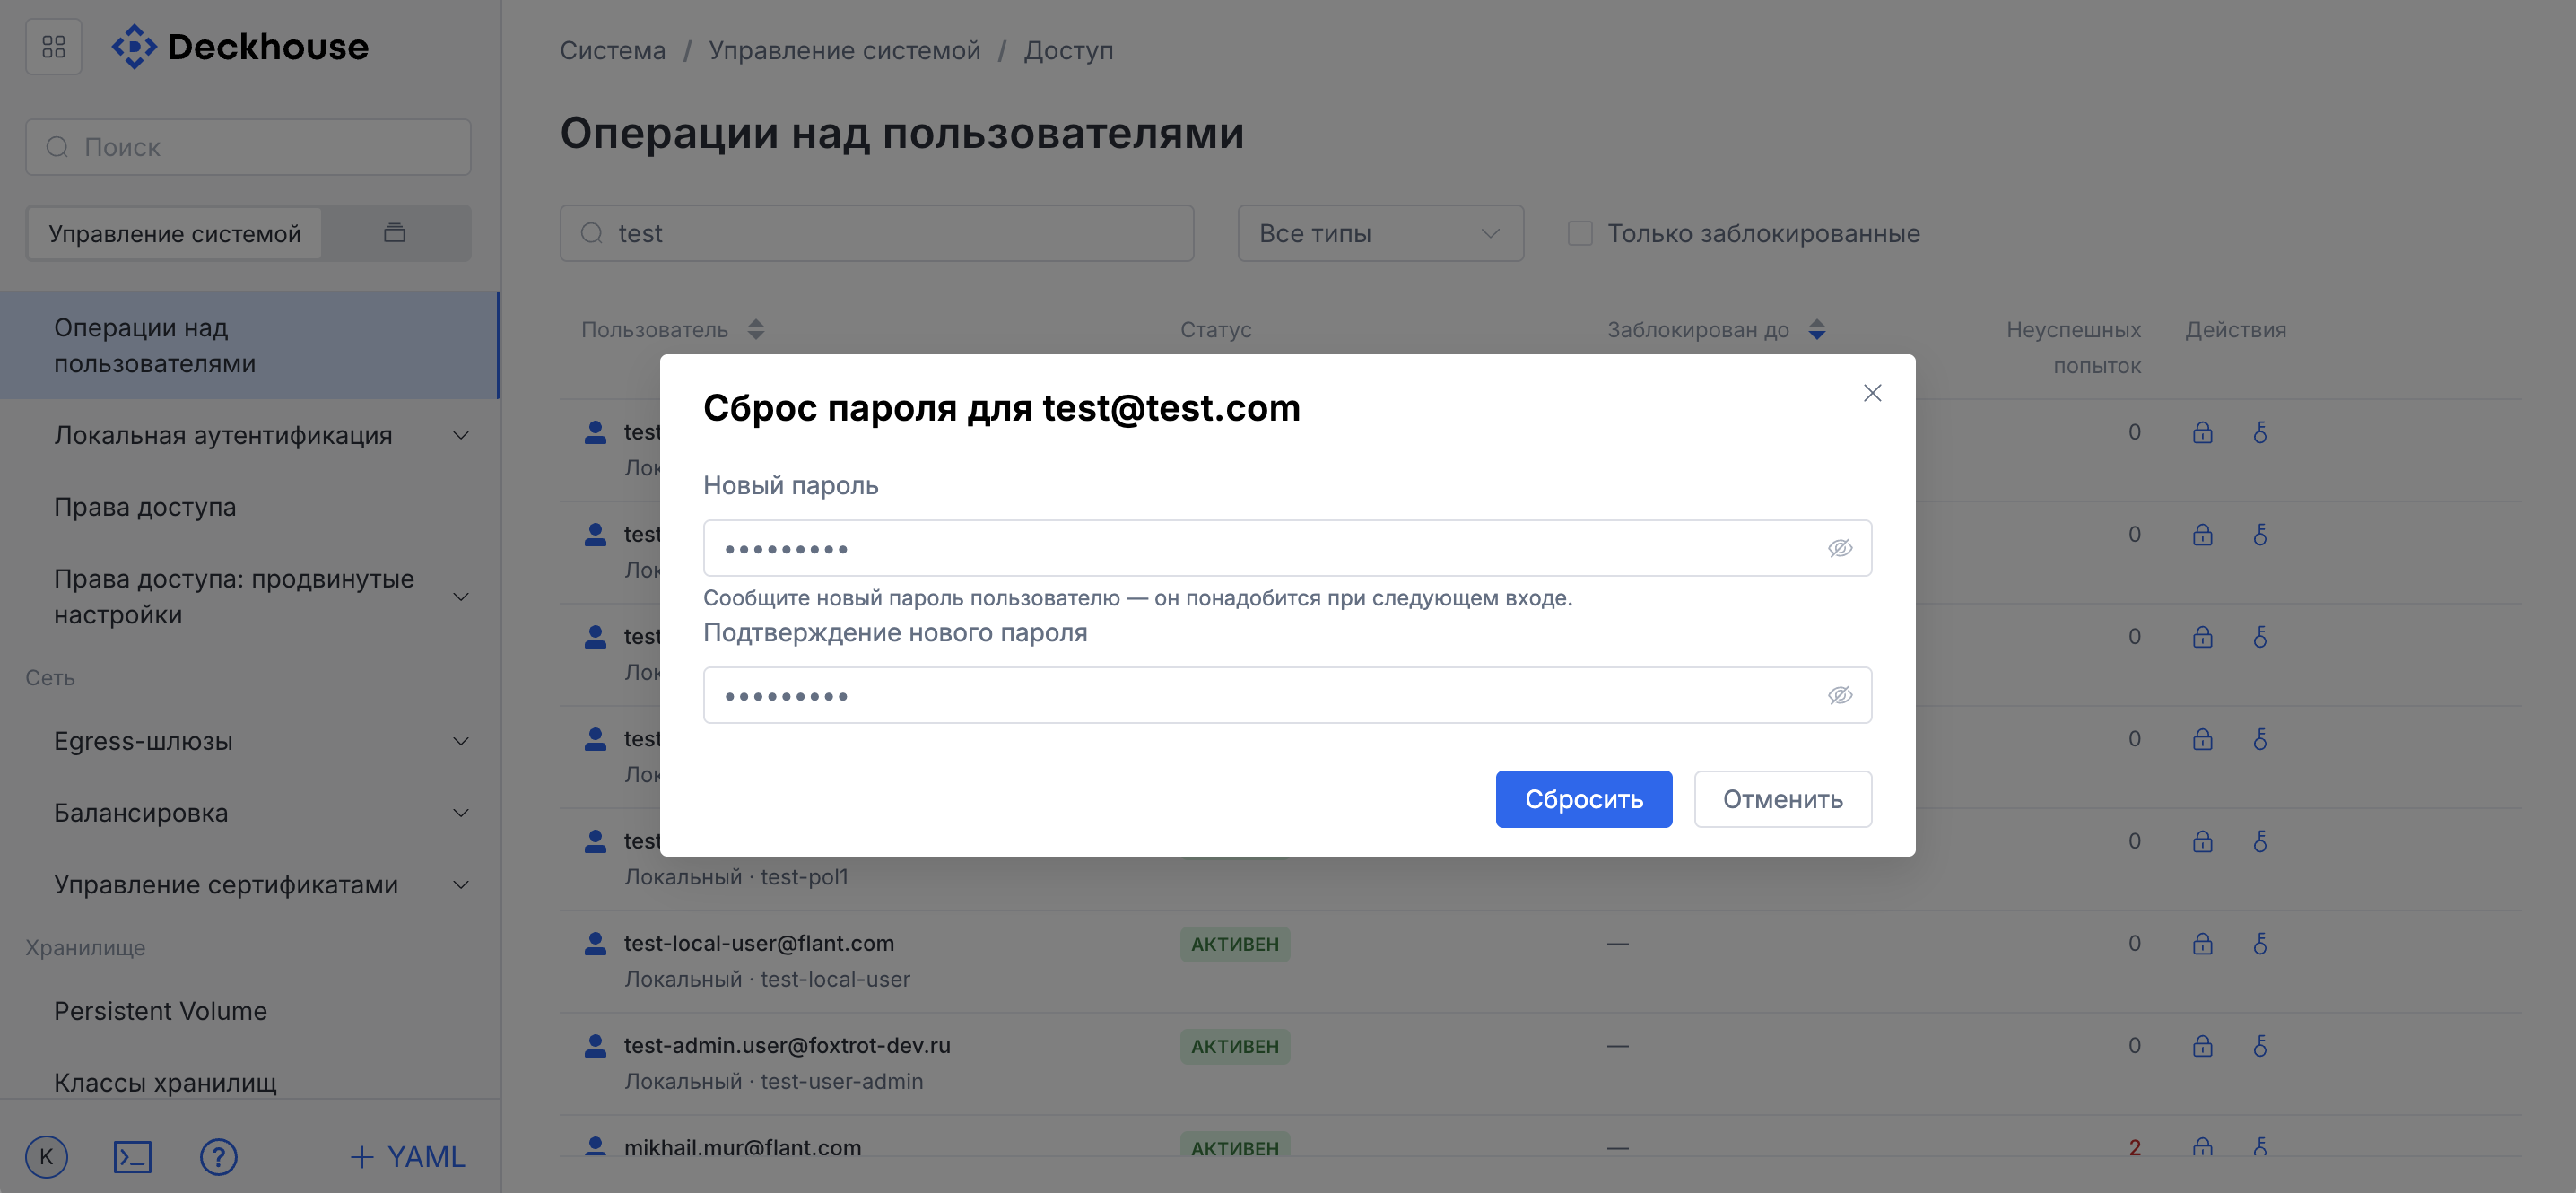
“User operations” subsection
This subsection provides an interface for user management.
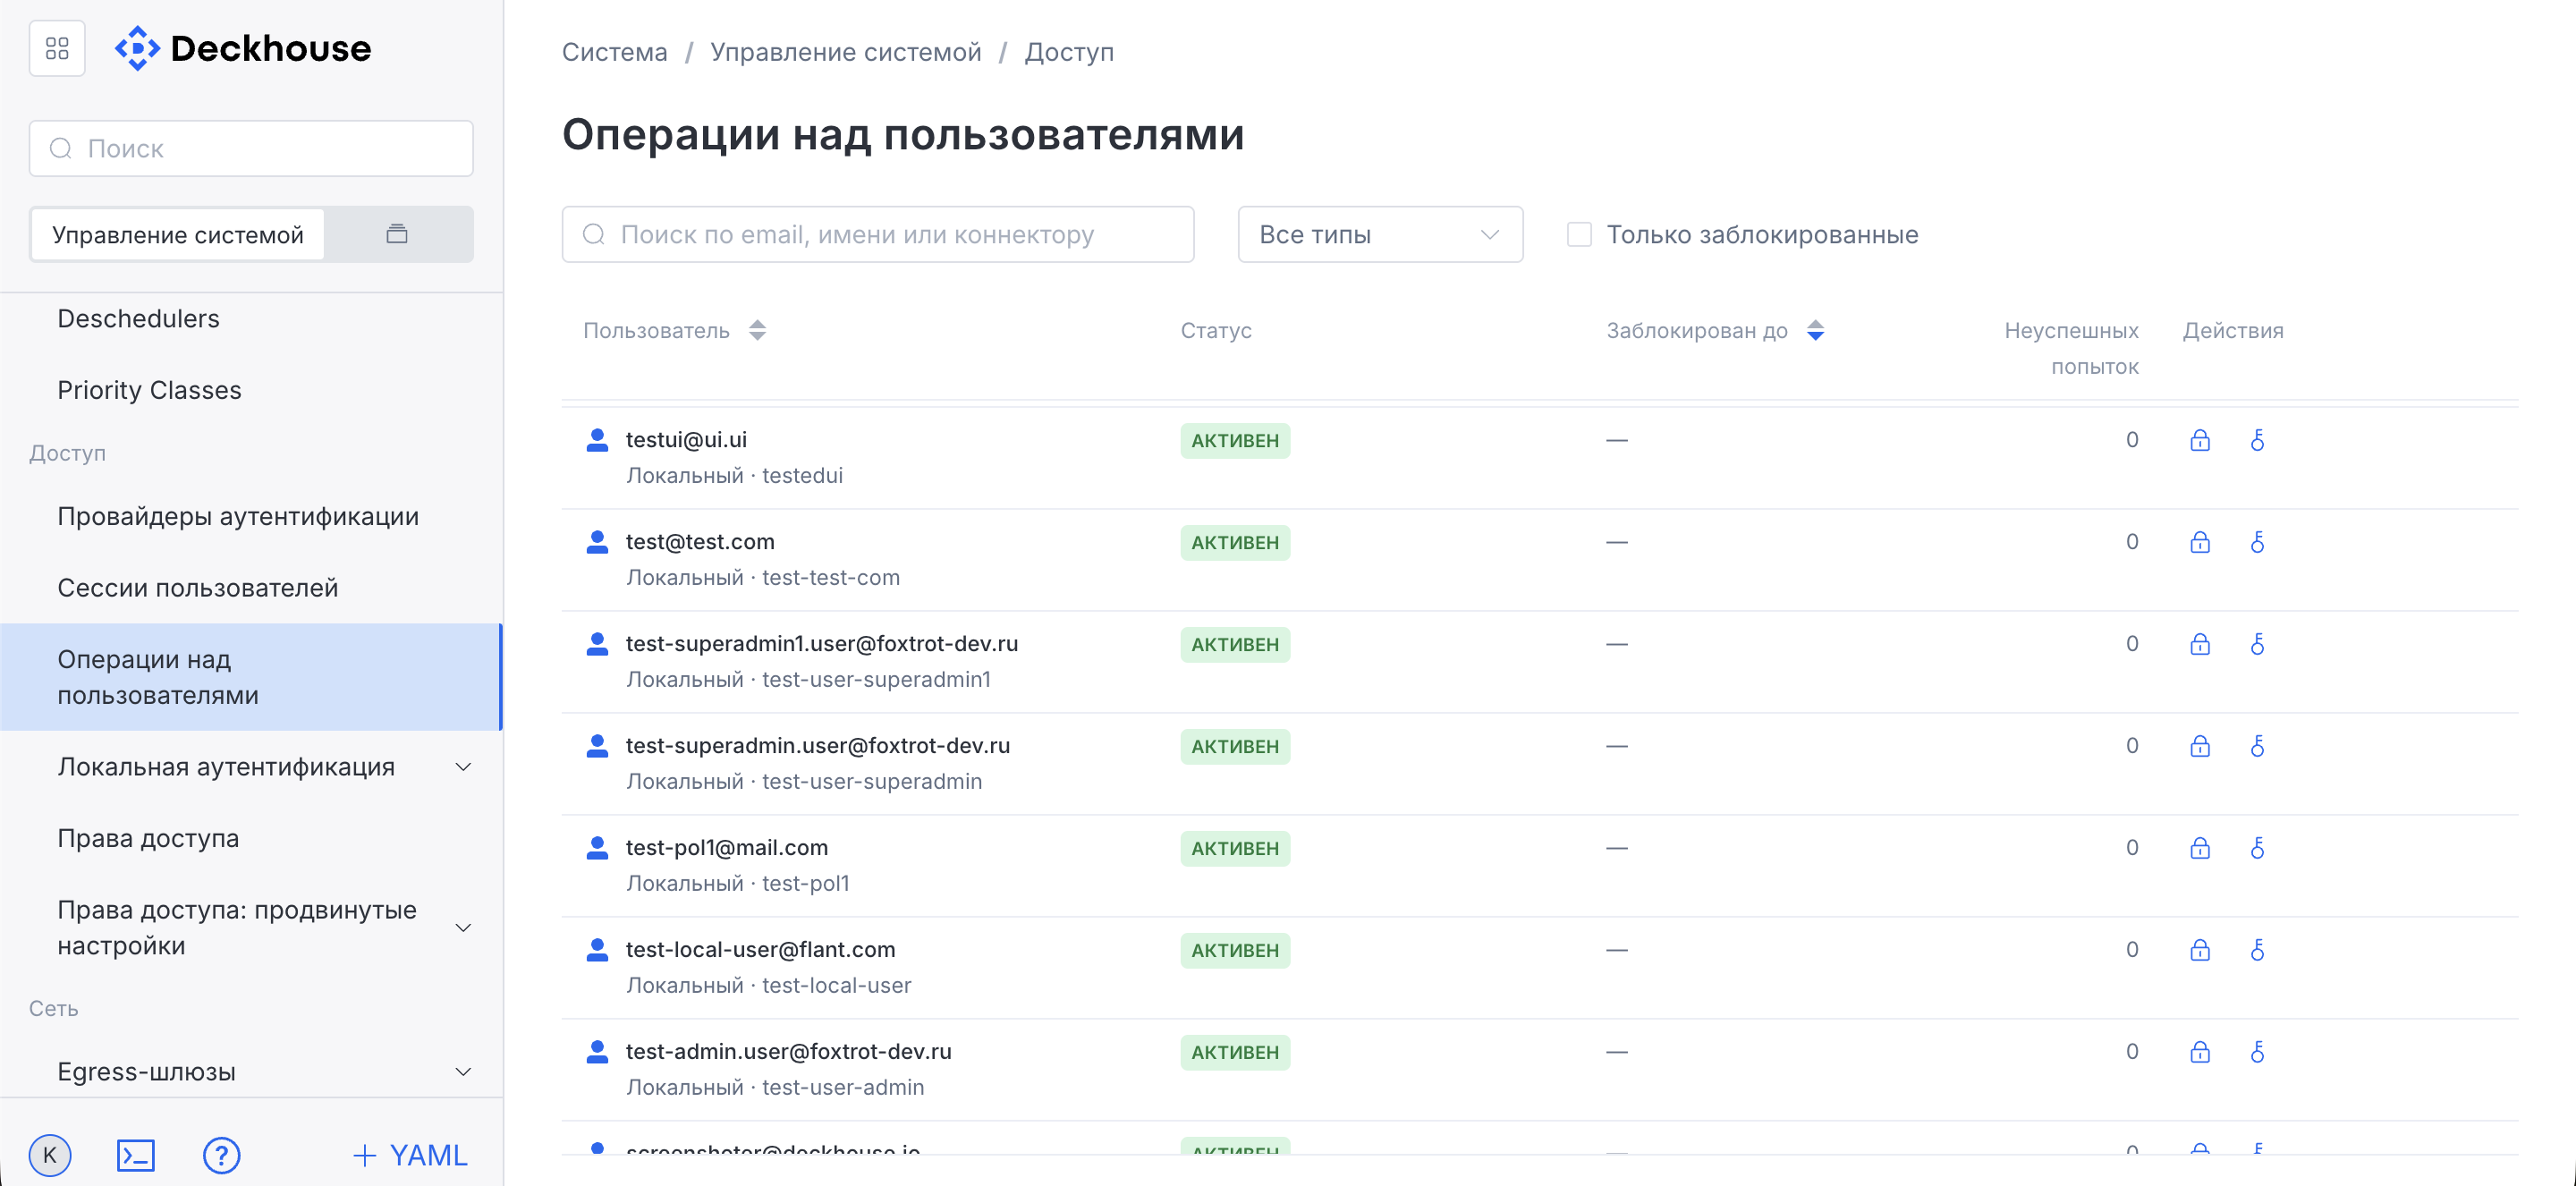
If necessary, you can block a user or reset a password.
Network
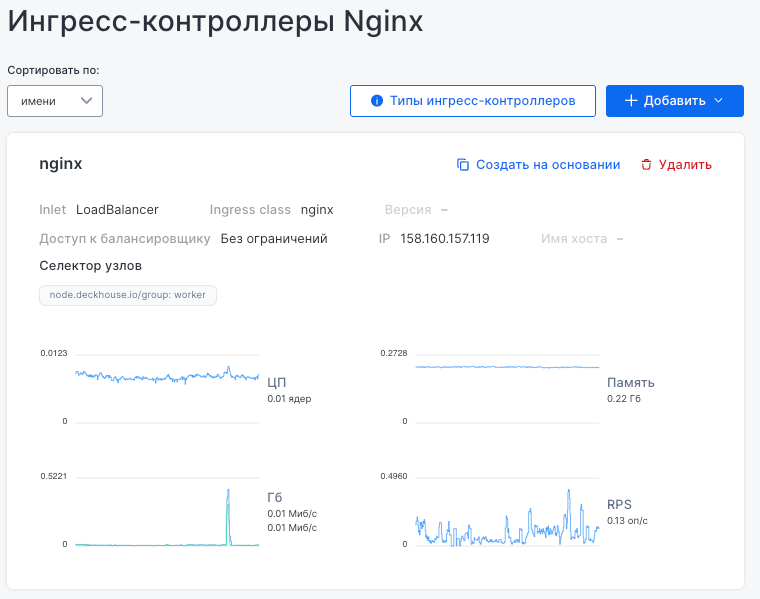
“Ingress controllers” subsection
This subsection displays information about the current Ingress controllers responsible for traffic routing inside the DKP cluster. If necessary, you can sort the list of controllers and add new ones.
The “Nginx Ingress controllers” card displays its main parameters:
- Inbound connection type (LoadBalancer)
- IP address and Ingress class (
nginx) - Load balancer access level
- Node selector that determines on which nodes the controller runs
The lower part of the card contains monitoring charts for CPU usage, memory usage, network traffic, and requests per second (RPS), allowing you to monitor controller performance. The “Create from” option is available for cloning the configuration, and the “Delete” option is available for removing the Ingress controller.
The “Add” button in the upper-right corner allows you to select the type of a new inbound connection (inlet) for the Ingress controller. Available options:
- HostPort
- HostPort with Proxy Protocol
- HostPort with a failover controller
- LoadBalancer
- LoadBalancer with Proxy Protocol
Storage
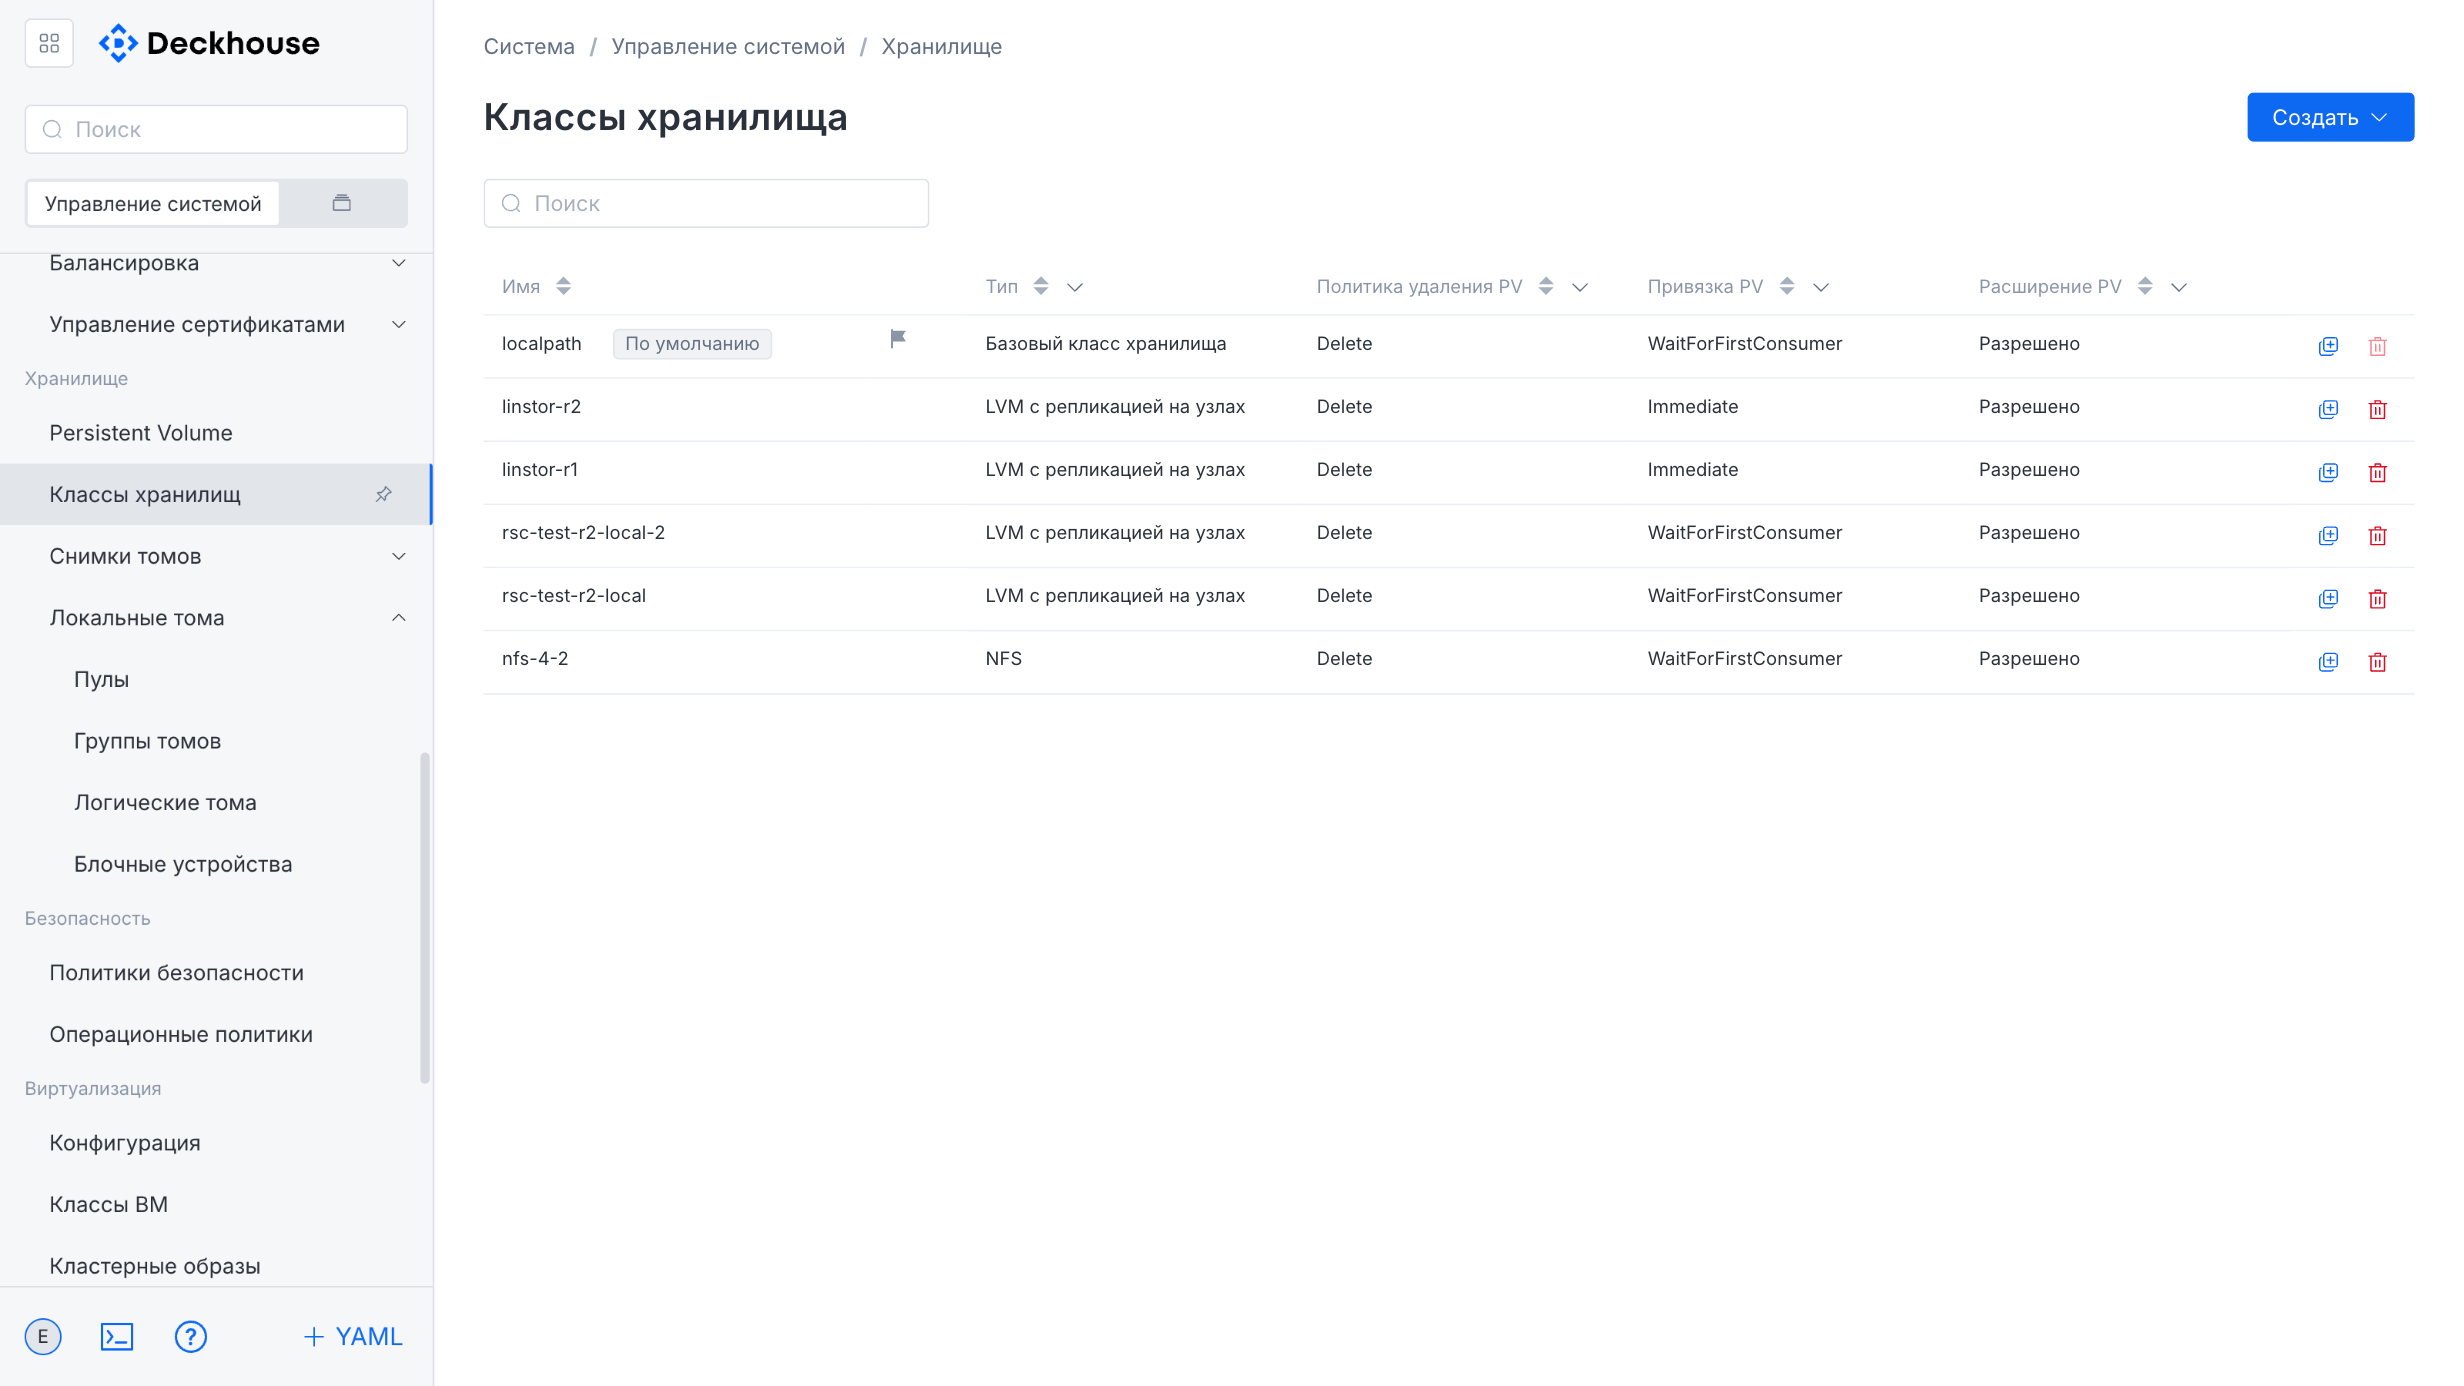
“Storage classes” subsection
This subsection is intended for managing storage classes.
“Persistent volume” subsection
This subsection is intended for managing persistent volumes.
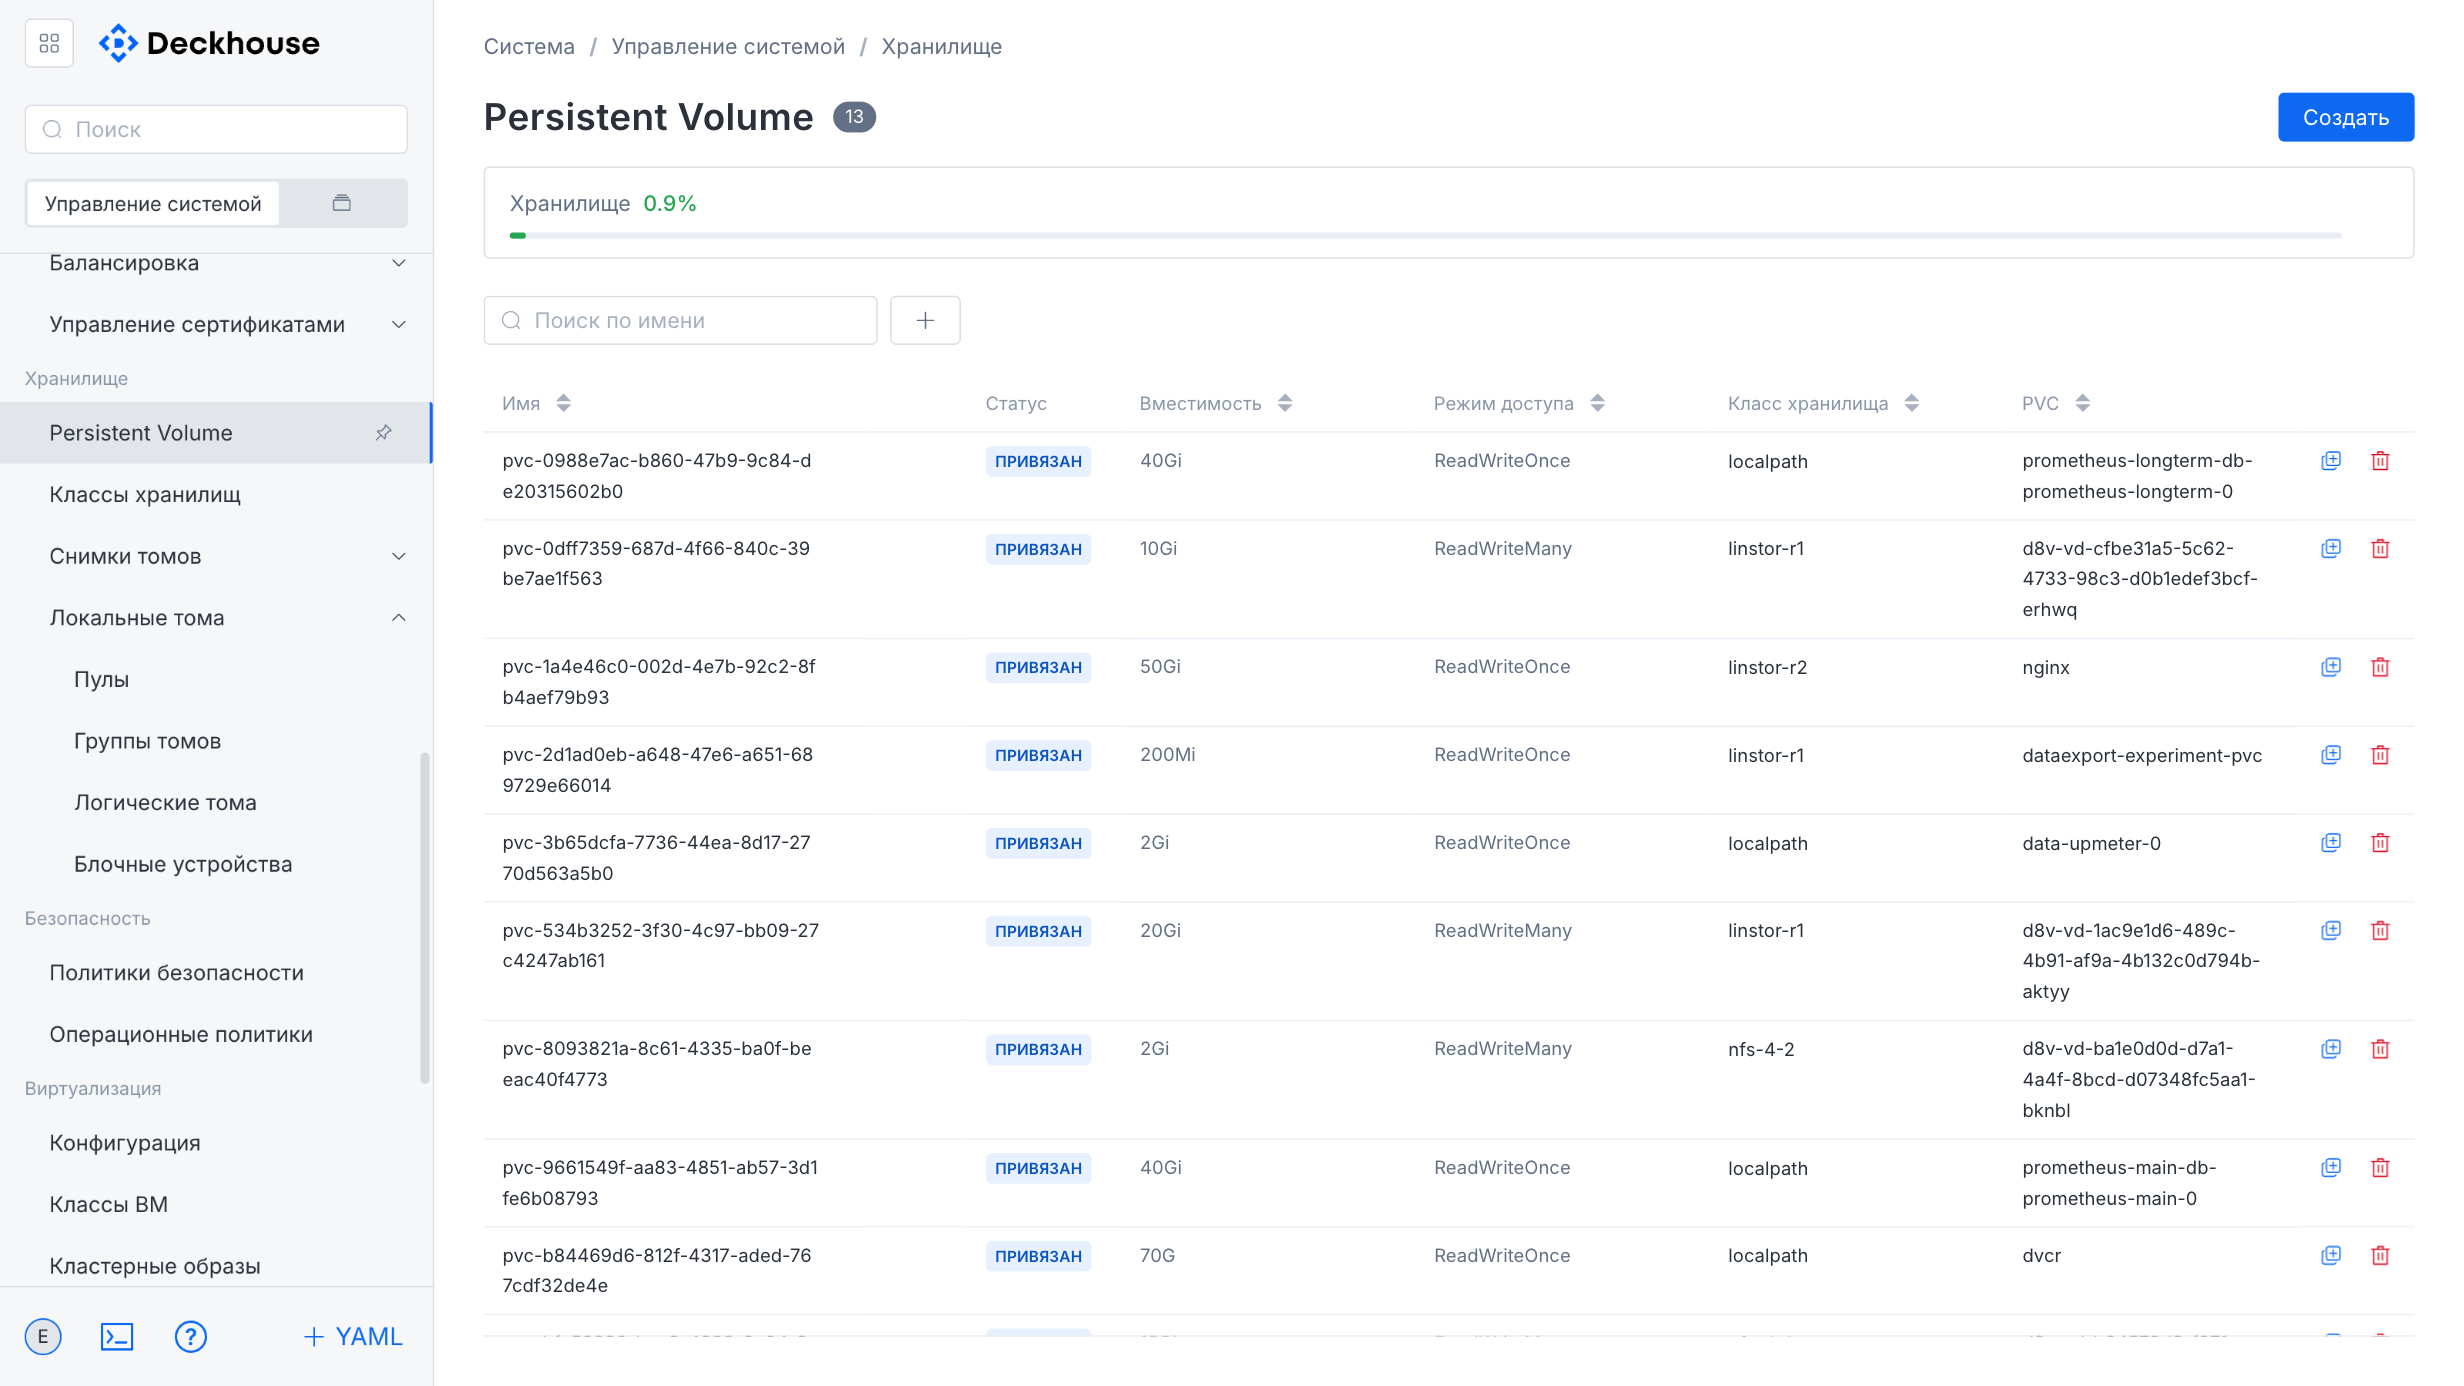
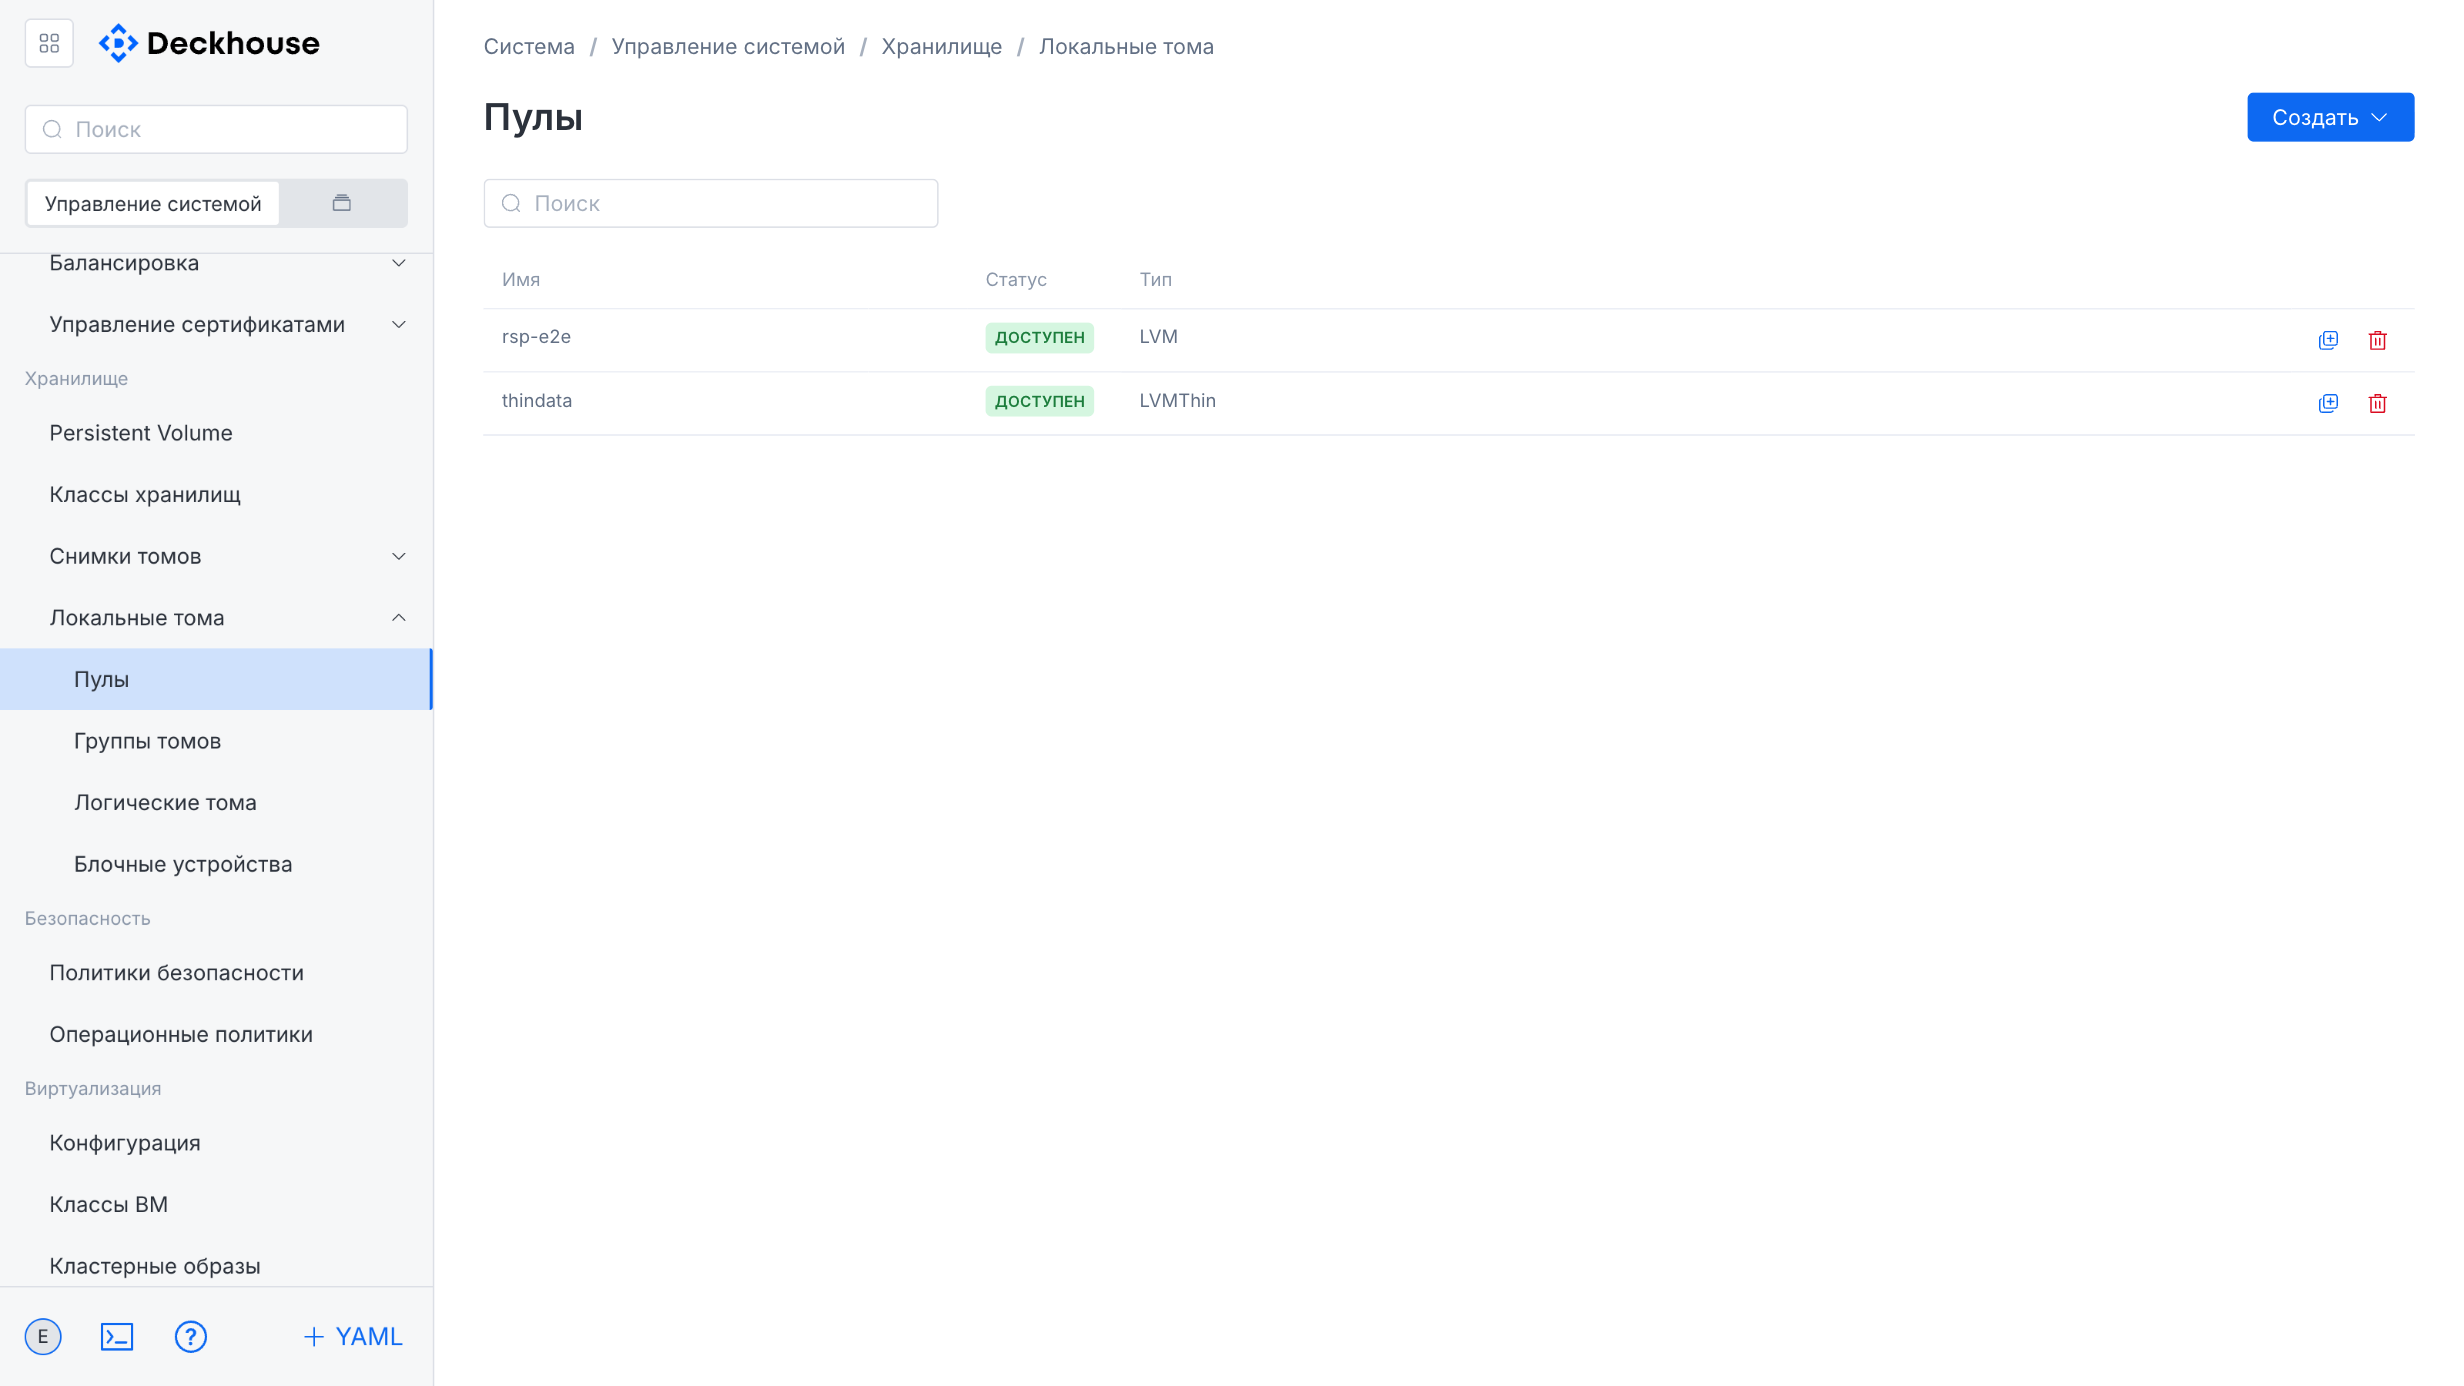
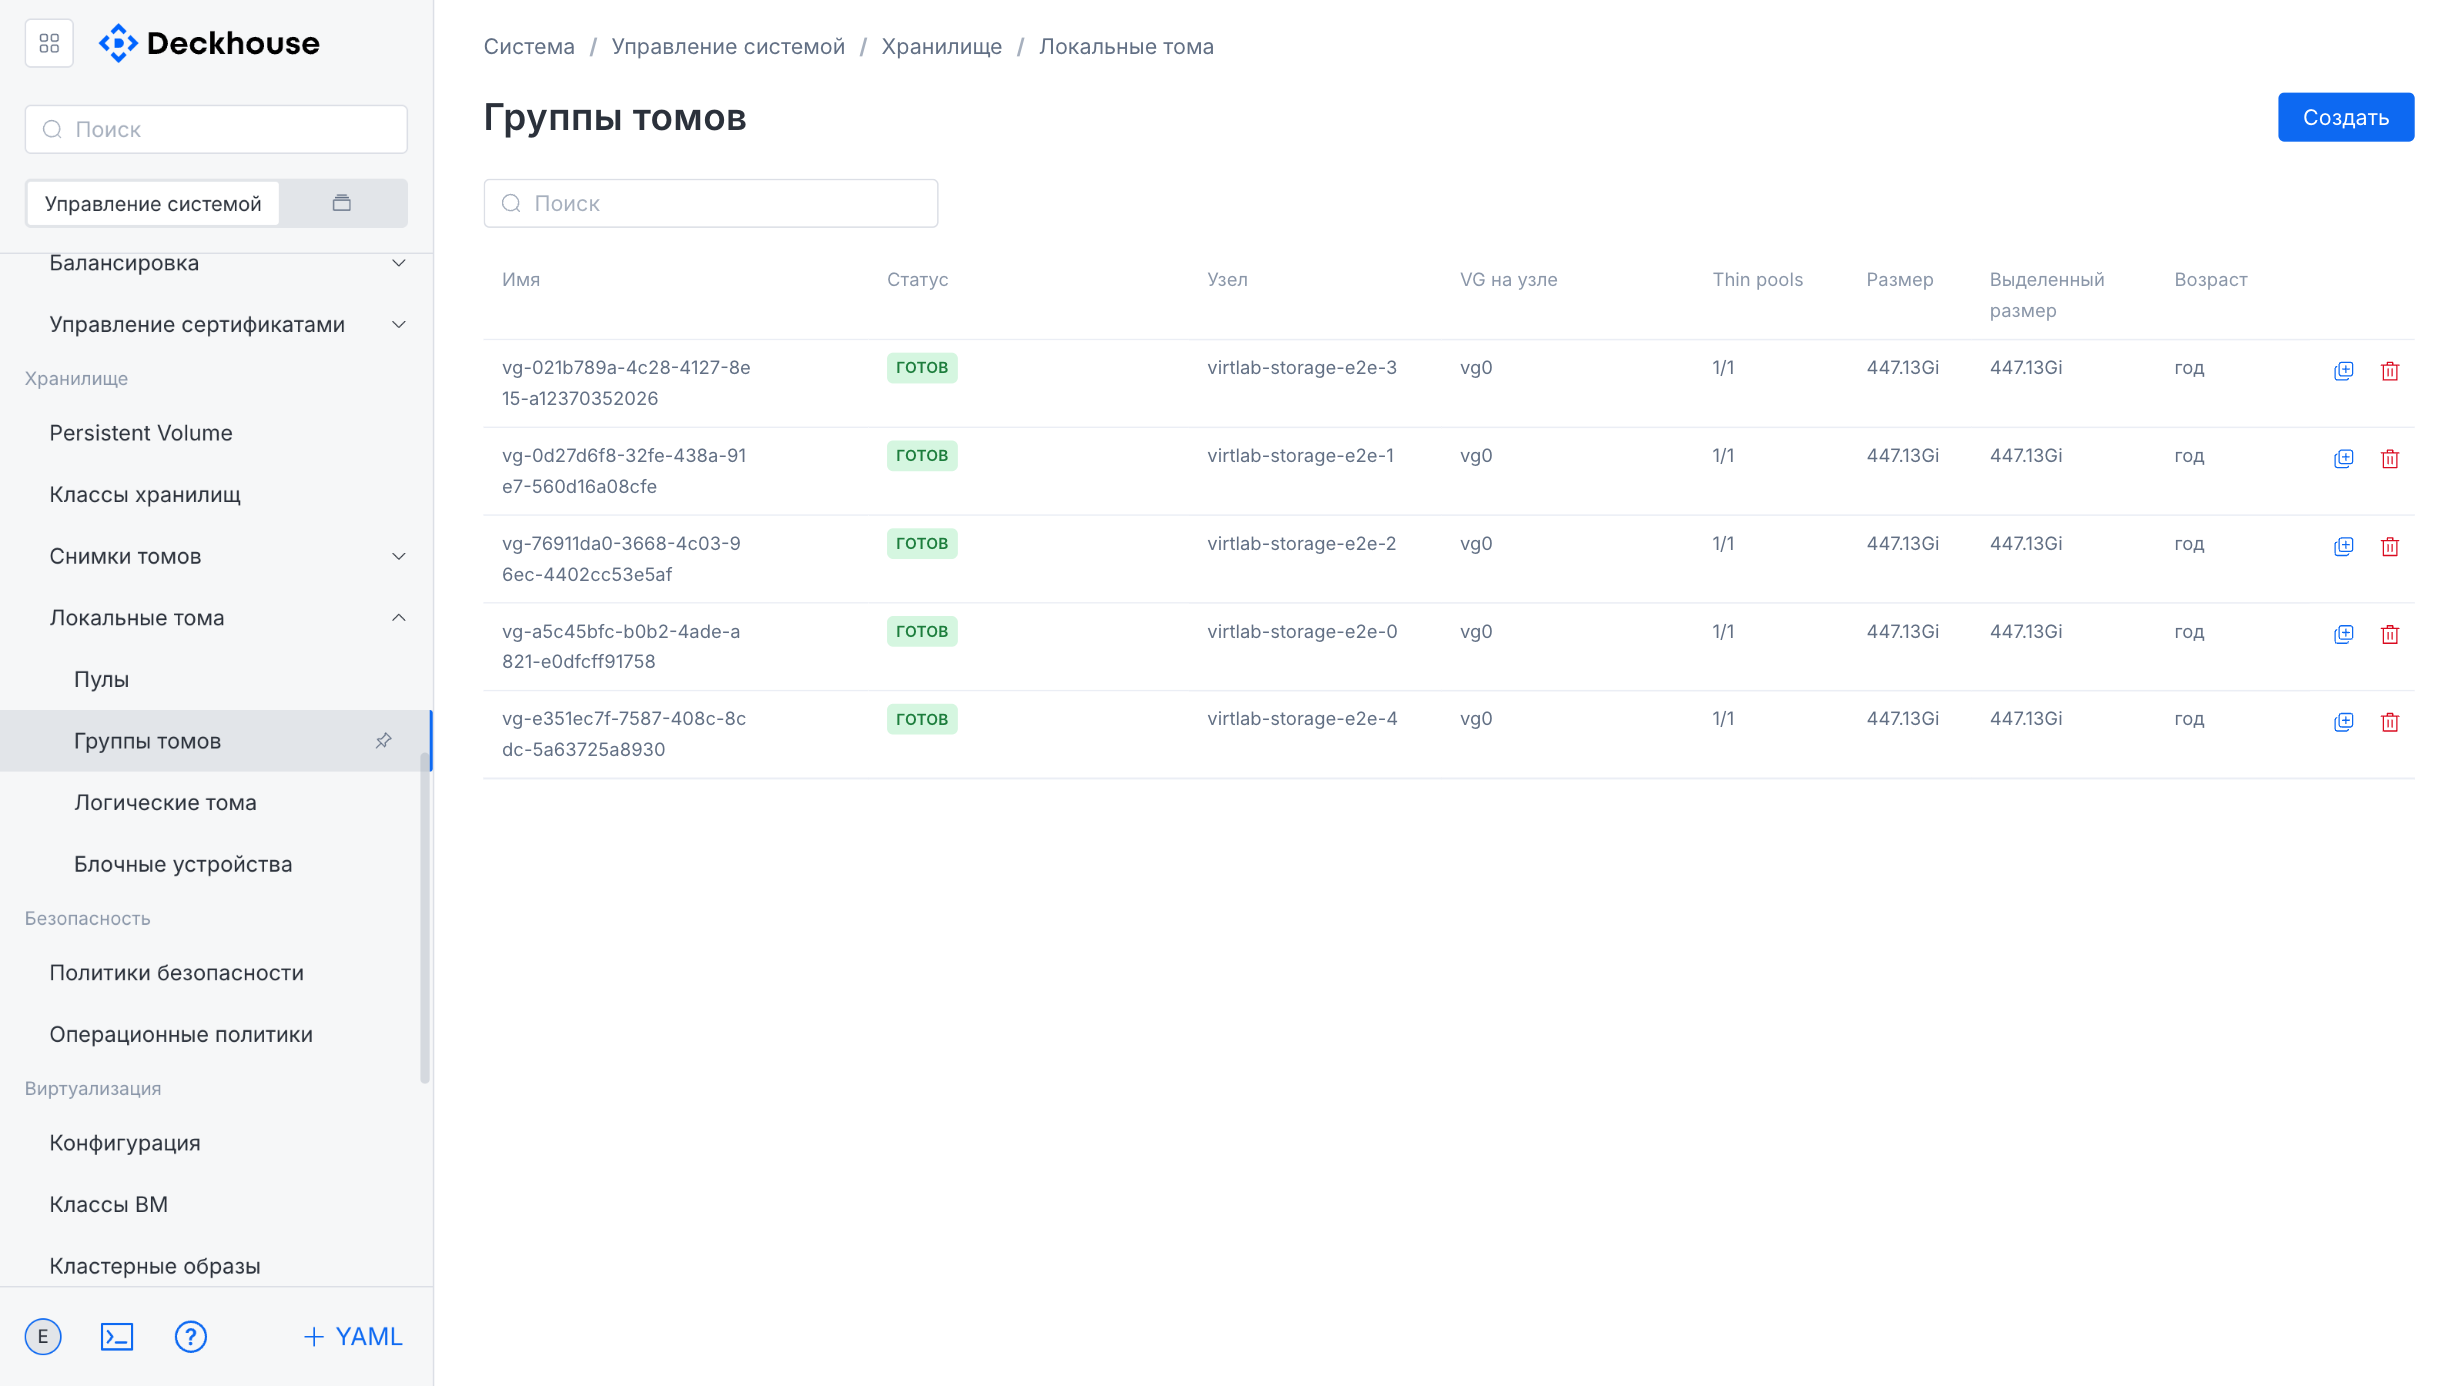
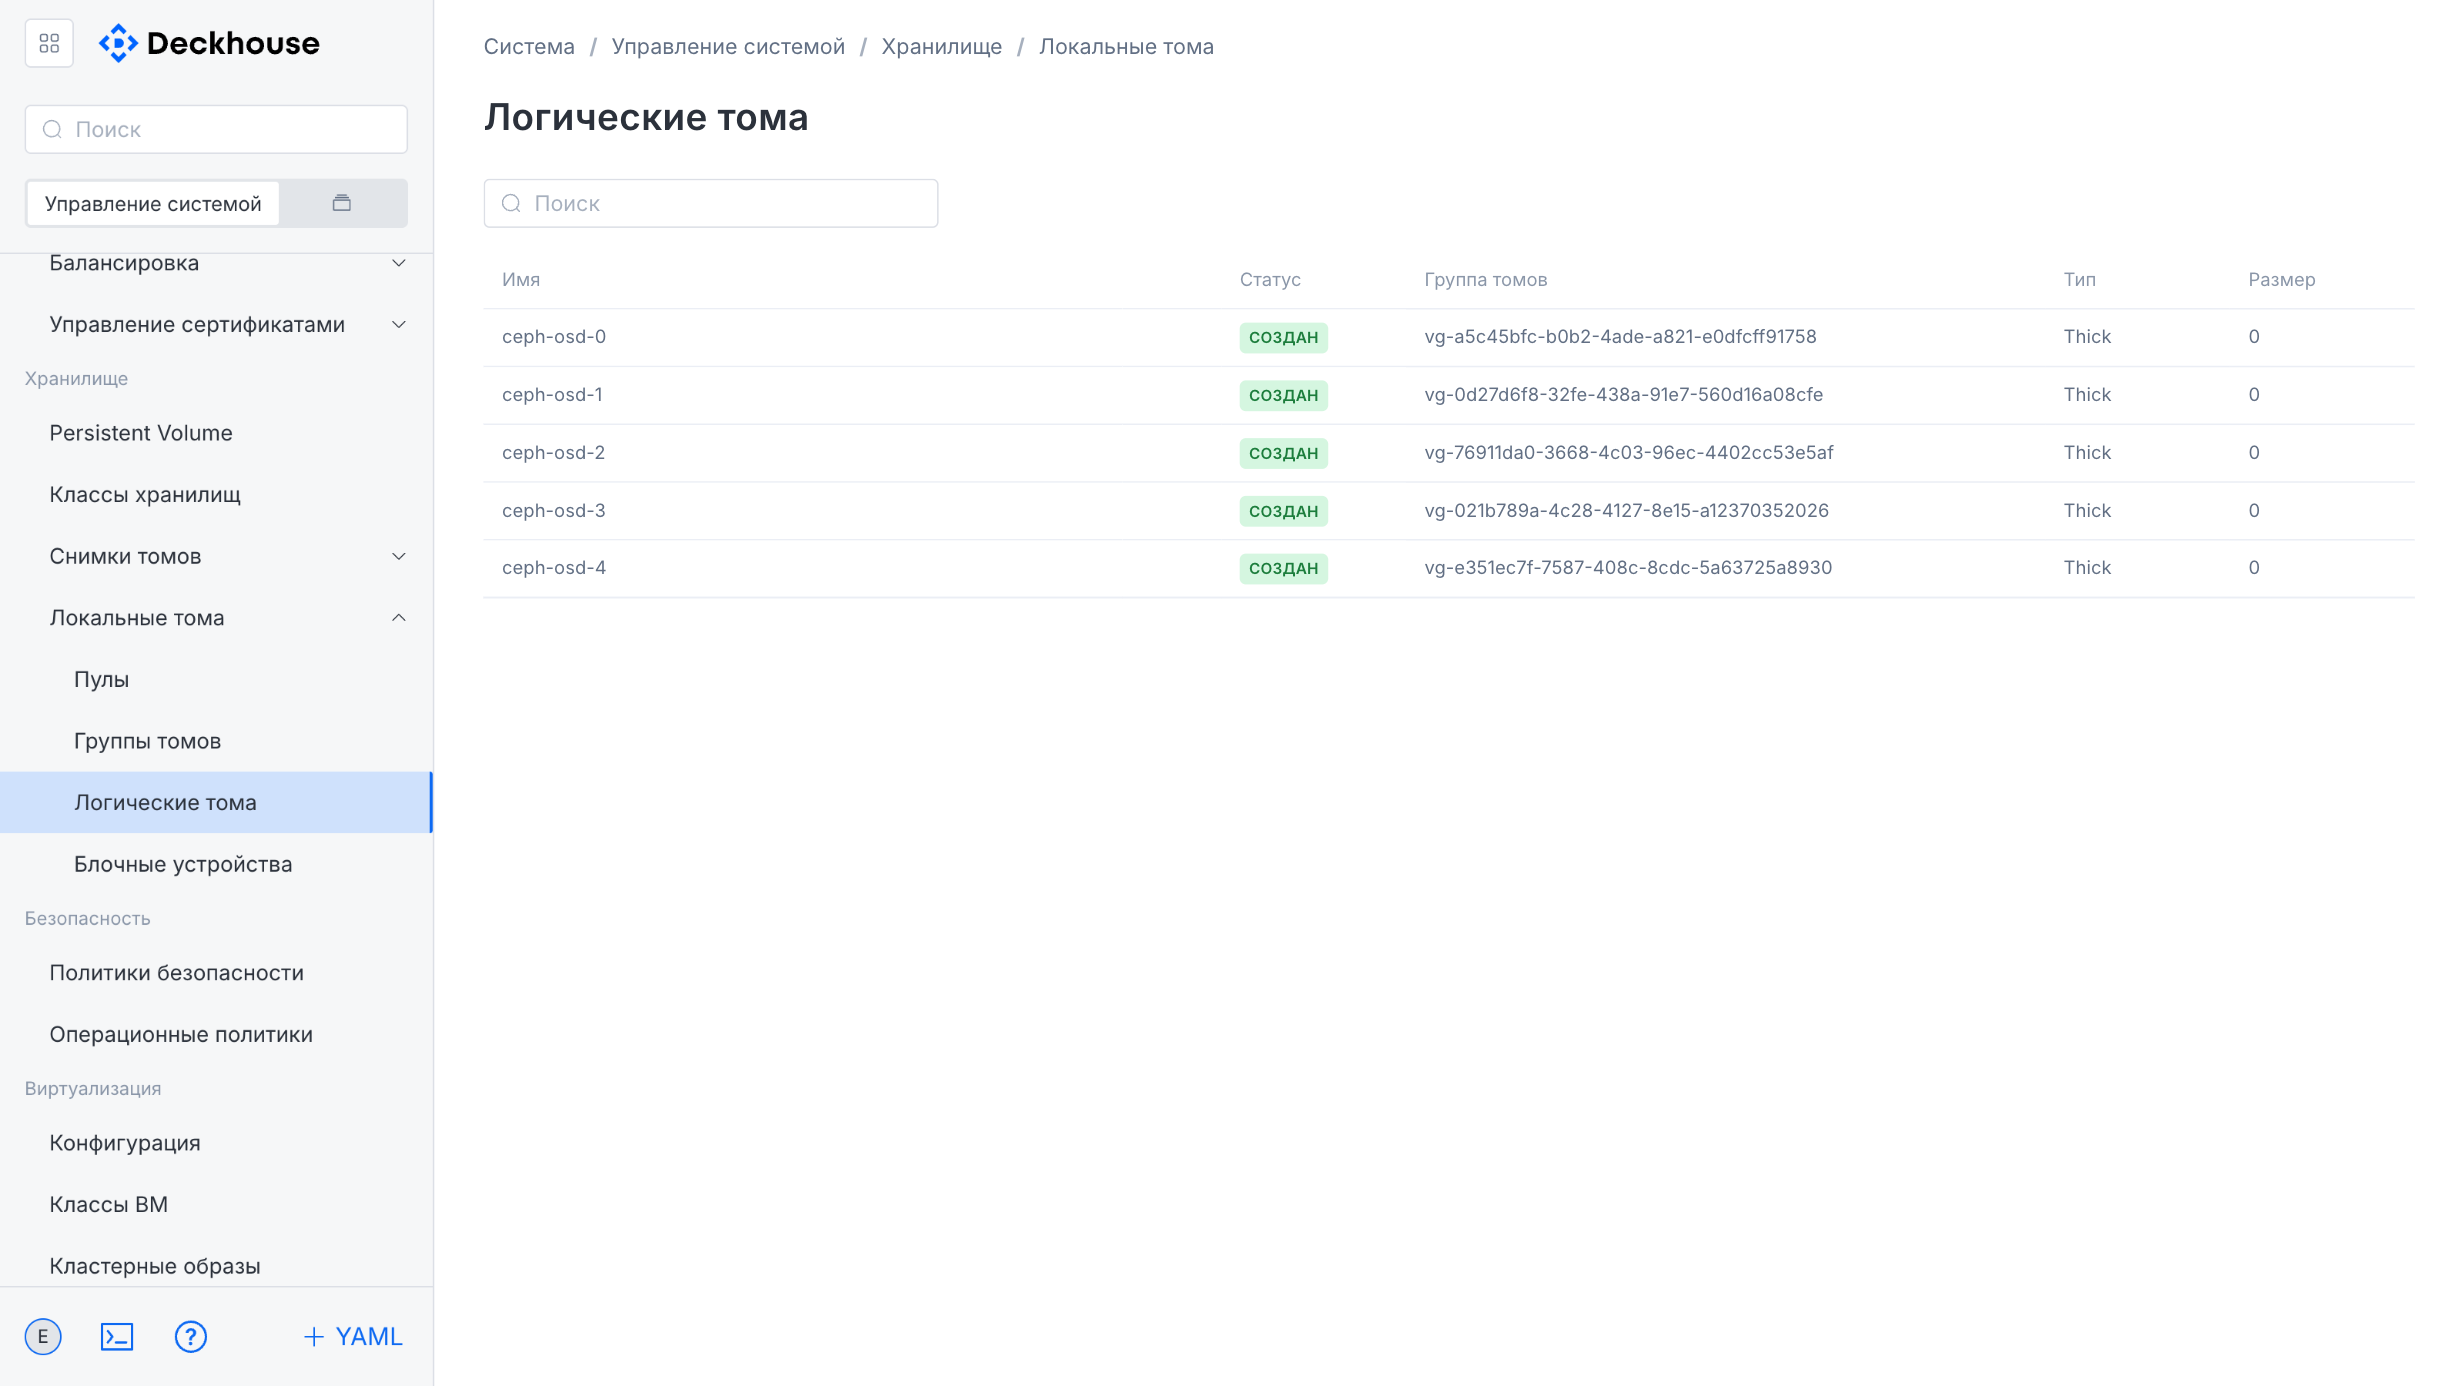
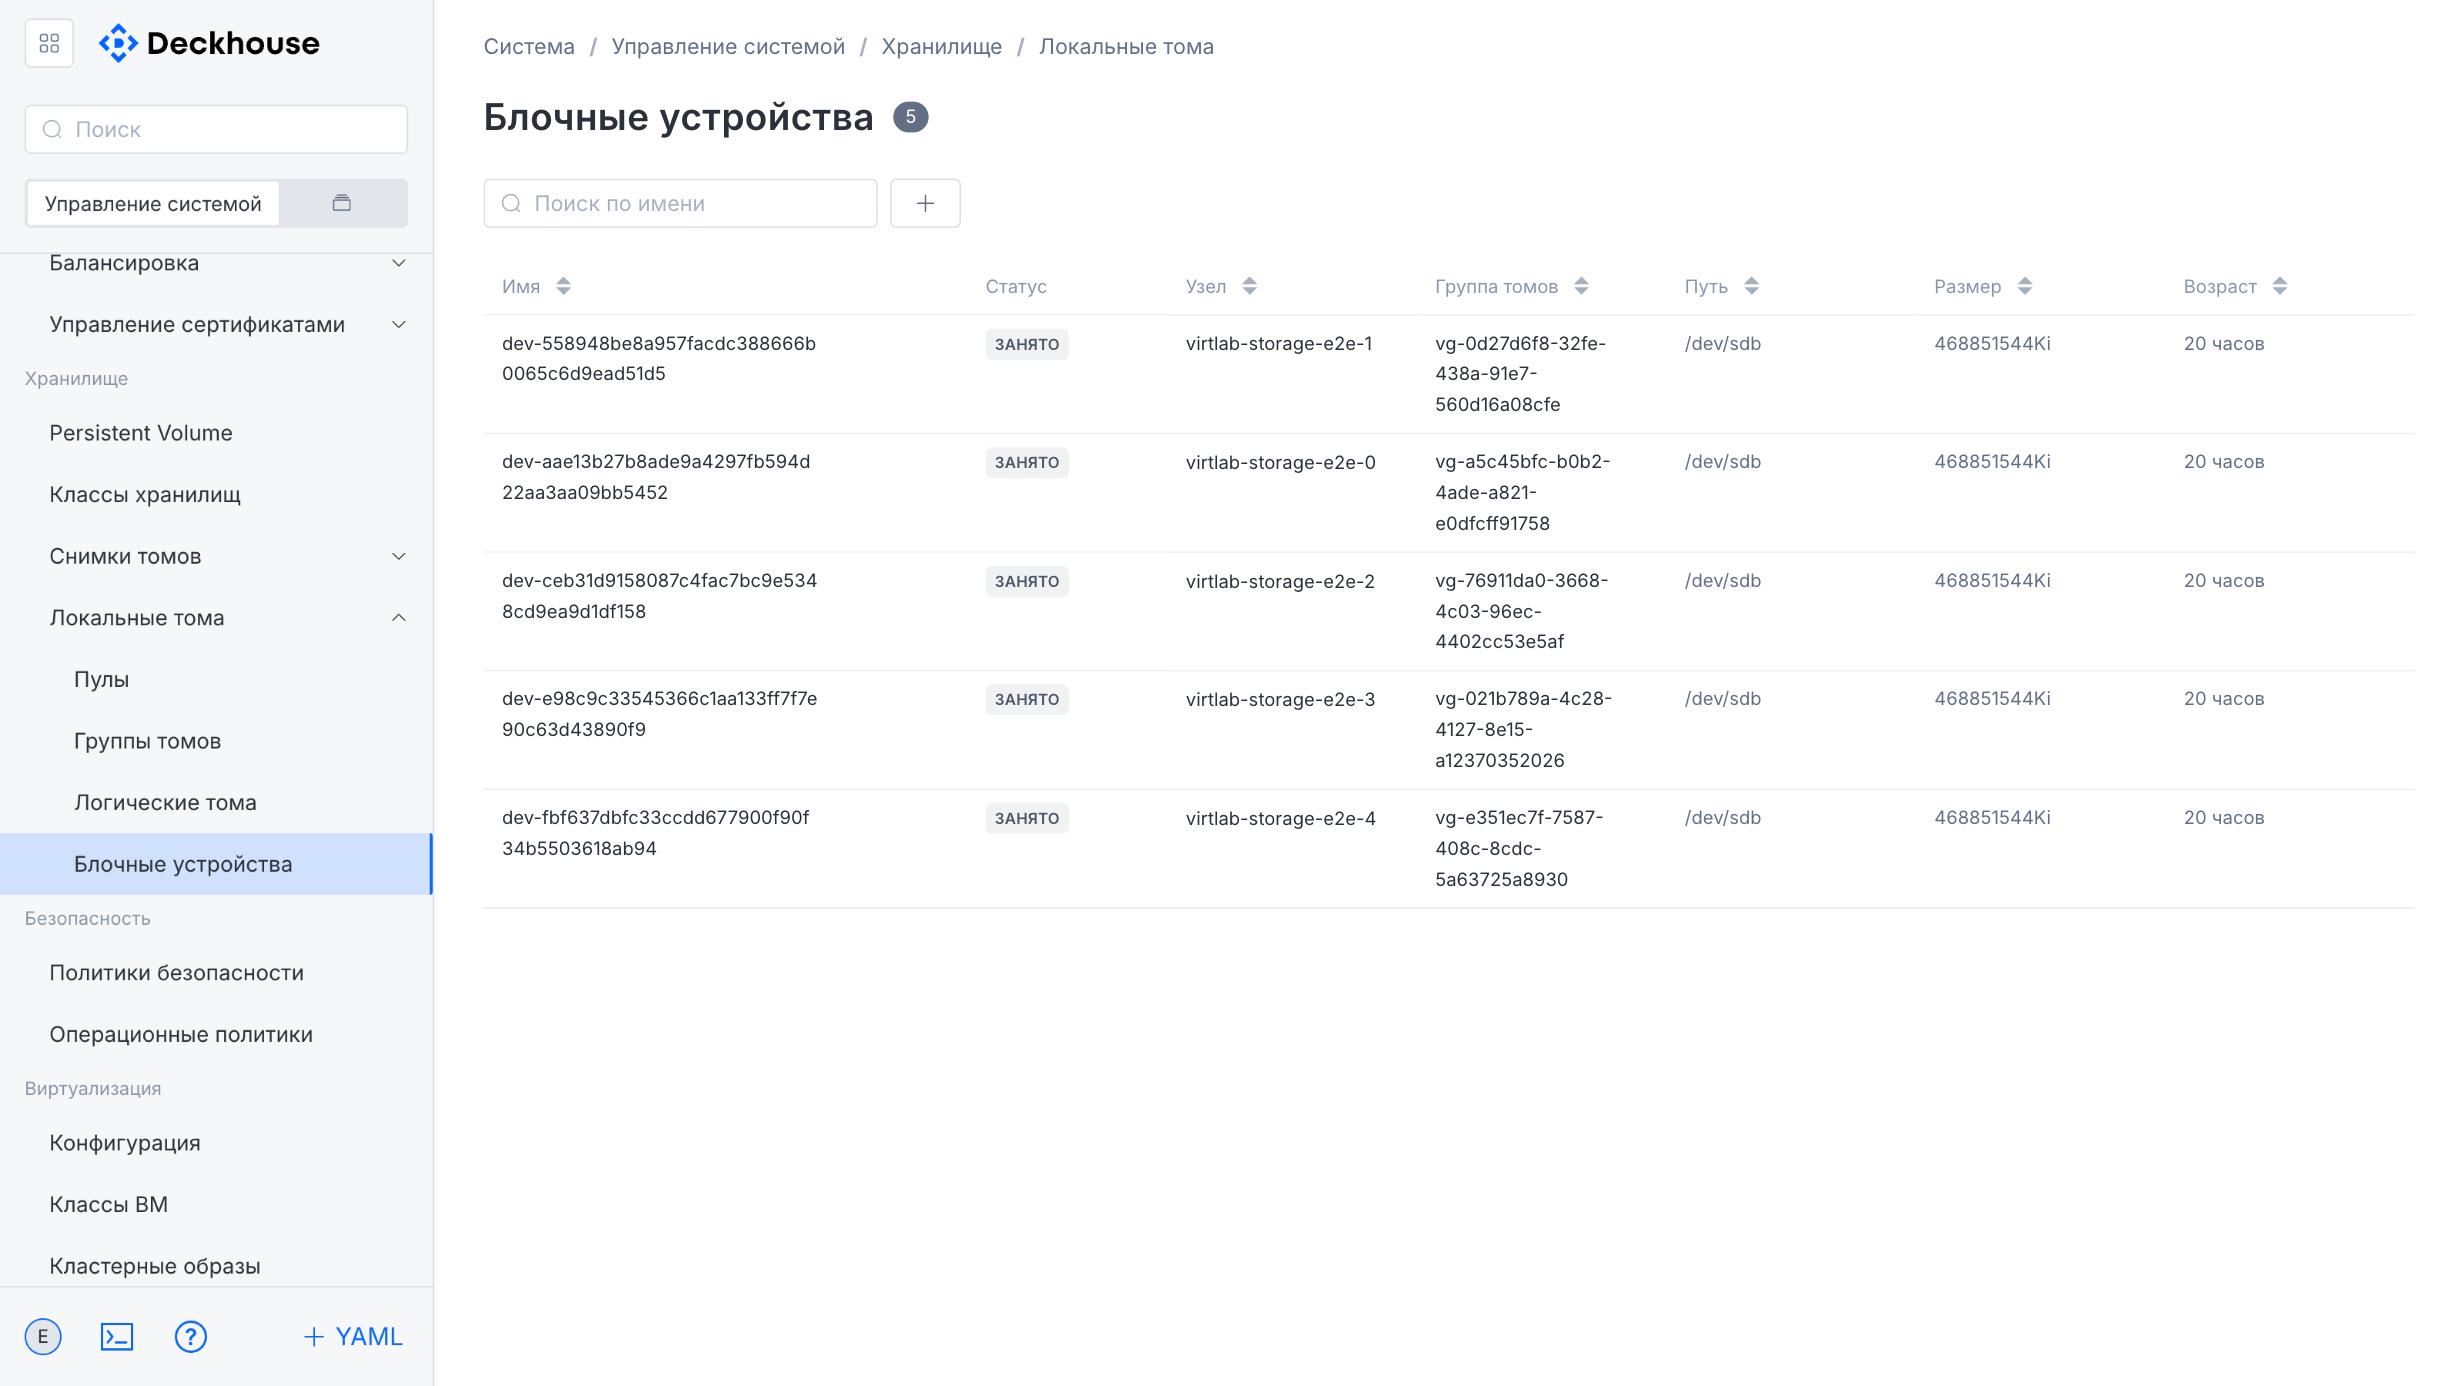
“Local volumes” subsection
This subsection is intended for managing local volumes. It contains four sections for managing pools, volume groups, logical volumes, and block devices.
Security
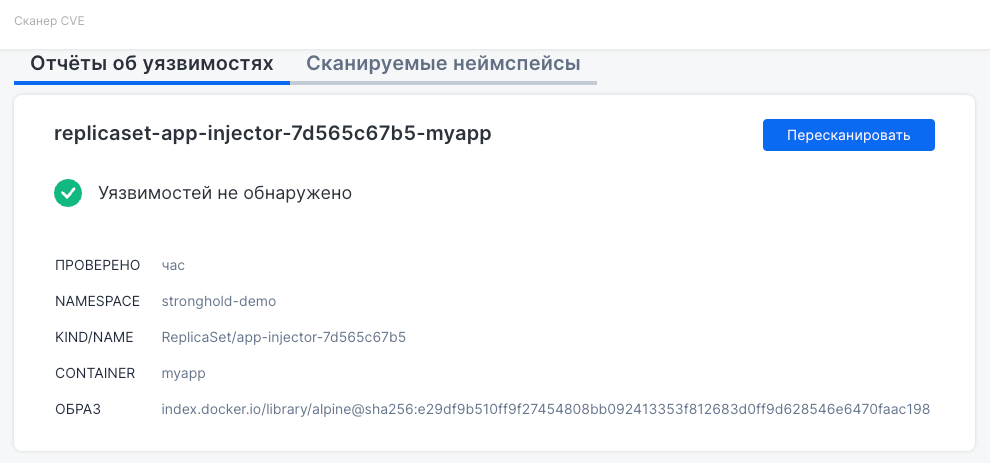
“CVE scanner” subsection
This subsection is intended for scanning container images for vulnerabilities (CVEs) in the DKP cluster.
The subsection contains the “Vulnerability reports” and “Scanned namespaces” tabs:
- “Vulnerability reports” tab displays the results of the latest scans. It provides information about the scanned object, including its name, namespace, type, and resource name, as well as the container and the image in use. If no vulnerabilities are found, a green indicator is displayed. The “Rescan” button allows you to perform a new scan.
- “Scanned namespaces” tab is intended for managing namespaces that are subject to scanning. The interface supports sorting by name and scan parameters. You can optionally hide system namespaces. The required namespaces can be selected for scanning, and scans can be started using the “Rescan” button. Reports for each object are also available for viewing.
Monitoring
“Overview” subsection
This subsection displays the state of Prometheus instances, load metrics, and a section with settings.
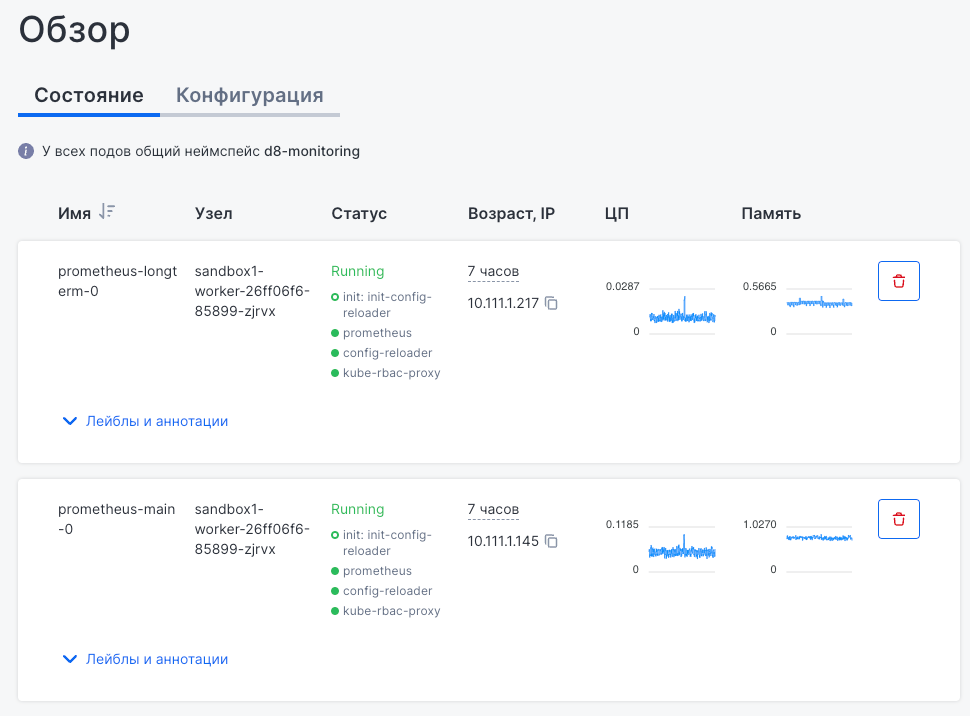
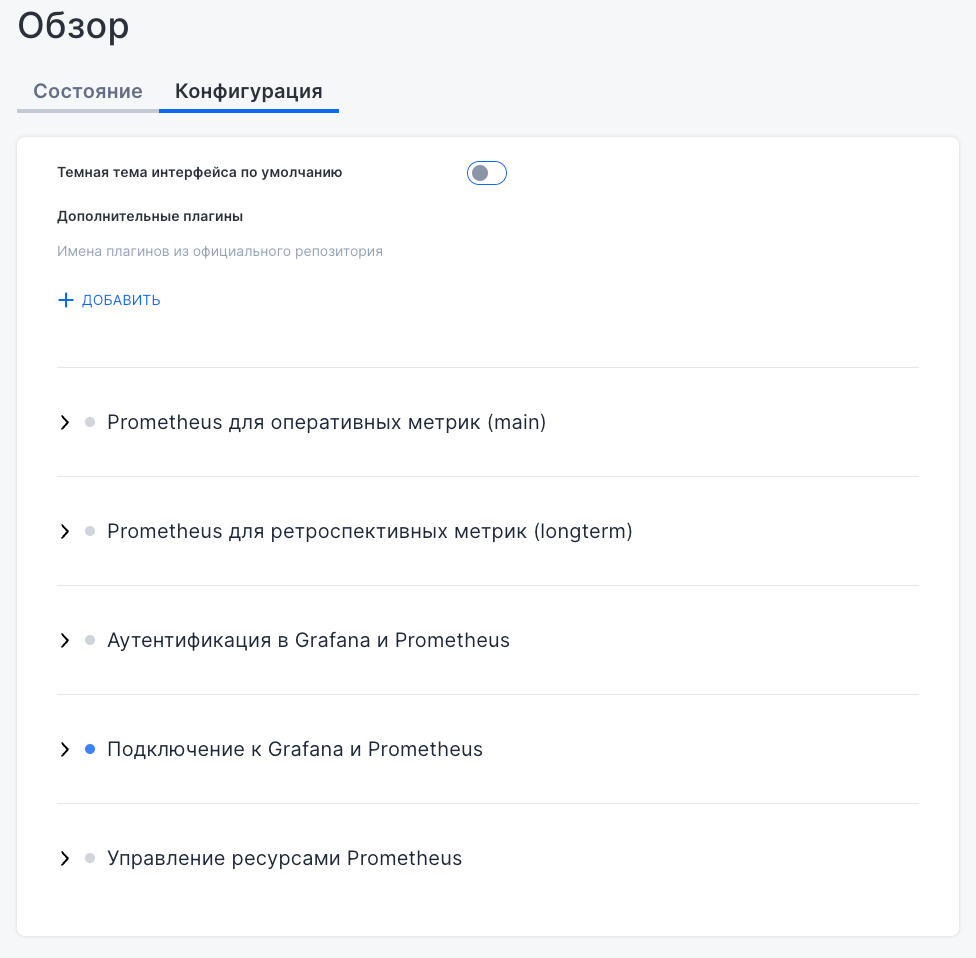
The “Overview” subsection contains the “Status” and “Configuration” tabs intended for monitoring and configuring Prometheus instances.
The “Status” tab displays a list of running pods with their names, assigned nodes, statuses, IP addresses, ages, and CPU and memory usage. Each pod includes components such as init-config-reloader, prometheus, config-reloader, and kube-rbac-proxy, which ensure its operation. The button on the right allows you to delete the selected pod.
The “Configuration” tab contains expandable sections for configuring various aspects of Prometheus operation, including real-time and retrospective metrics, authentication and Grafana integration, as well as resource management. This interface is intended for monitoring metric states in real time and for flexible integration with other services.
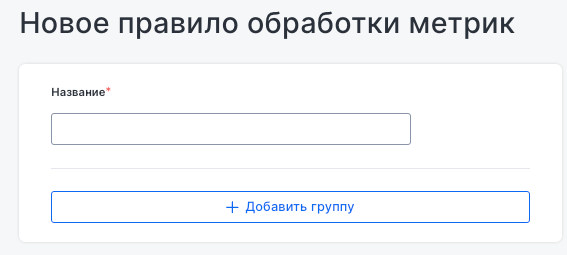
“Metric processing” subsection
This subsection allows you to create and manage metric processing rules. When adding a new rule, specify its name and processing group. This makes it possible to organize and modify incoming metrics before they are forwarded further.
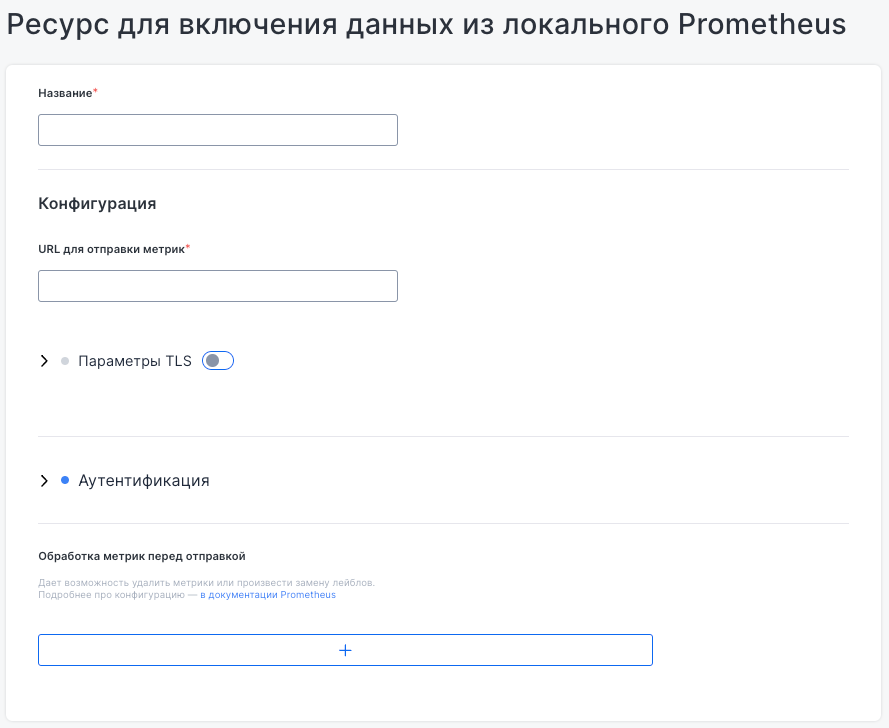
“Metric delivery” subsection
This subsection is intended for configuring data export to a local or external Prometheus server. When adding a new resource, specify the URLs for metric delivery, and configure TLS parameters, authentication, and optional metric preprocessing before delivery.
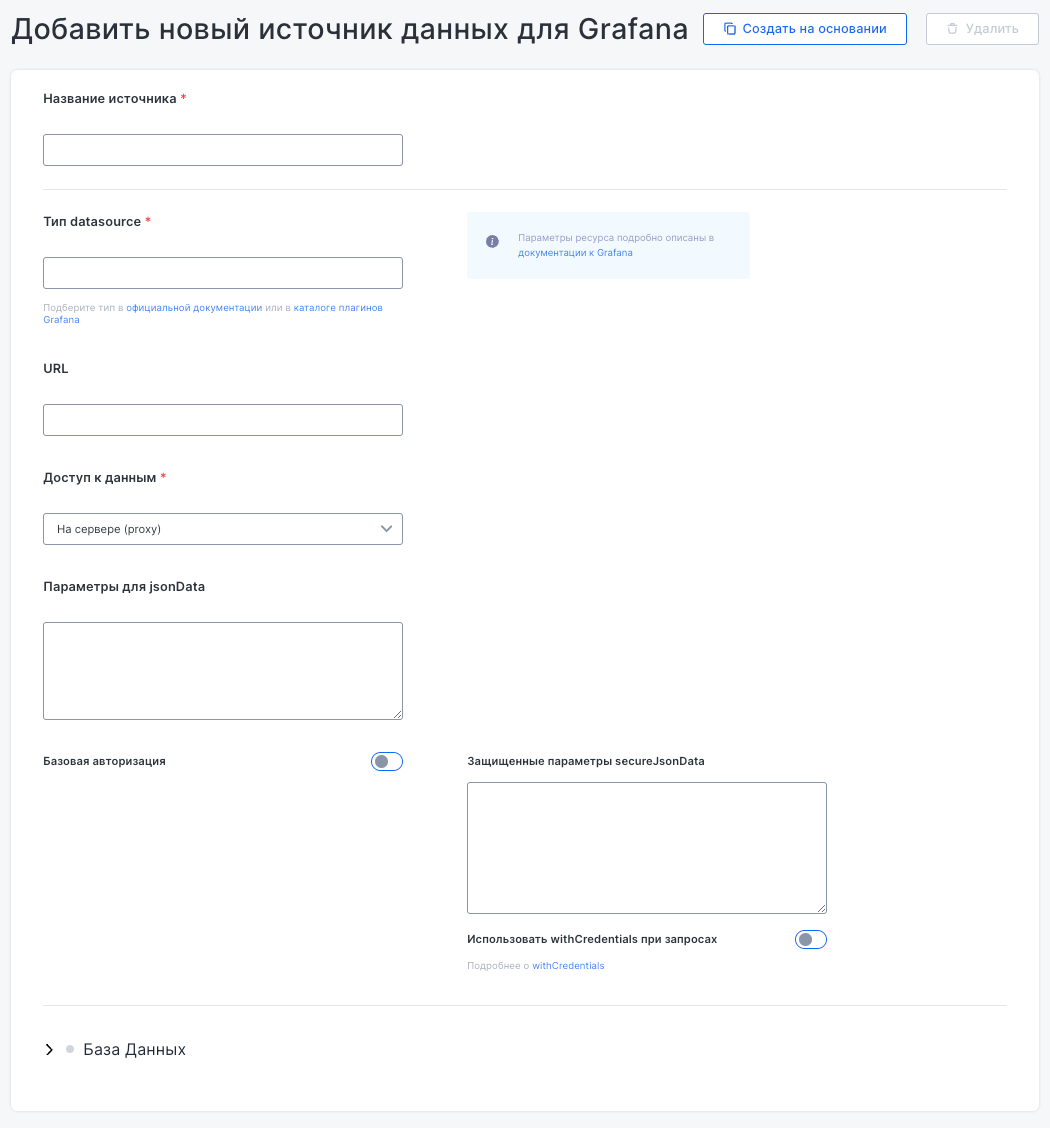
“Grafana data sources” subsection
In this subsection, you can configure Grafana integration with various data sources used in dashboards and visualize data.
To create a new data source, specify its name, type, URL, access parameters, and authentication settings.
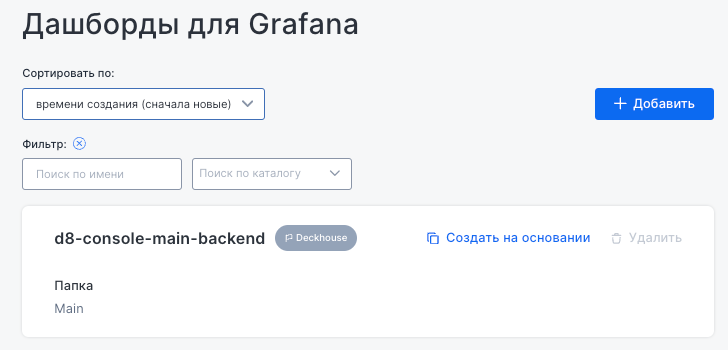
“Grafana dashboards” subsection
This subsection is intended for managing dashboards used for metric visualization.
The main interface displays a list of available dashboards. You can sort by creation time and filter by name or folder.
The dashboard row displays its name, associated folder, and the “Create from” option for creating a new dashboard based on it, as well as the “Delete” option.
To add a new dashboard:
- Click the “Add” button.
- Specify the new dashboard name and the folder in which it will be stored (if the folder does not exist, it will be created automatically).
- Enter a JSON manifest containing the dashboard configuration description. It is important that the manifest does not contain a local ID (except for the UID), otherwise the dashboard may not be displayed correctly in Grafana.
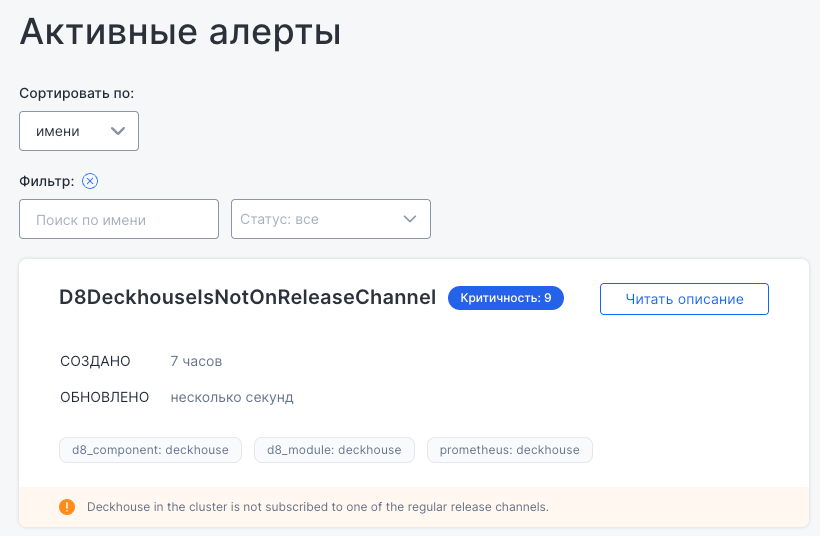
“Active alerts” subsection
This subsection displays a list of current monitoring system alerts. Alerts can be sorted by name and status.
The alert row displays the alert name, severity level, creation time, and last update time. Related components and modules are also displayed to help identify the source of the issue.
To get detailed information about an alert, click “Read description”. At the bottom, an explanation of the alert trigger reason is displayed.
A list of all monitoring system alerts available in DKP is provided on a separate documentation page.
Logging
This section is intended for configuring log sources and managing log delivery.
“Log delivery” subsection
This subsection is intended for managing logging and configuring log delivery to various storage systems.
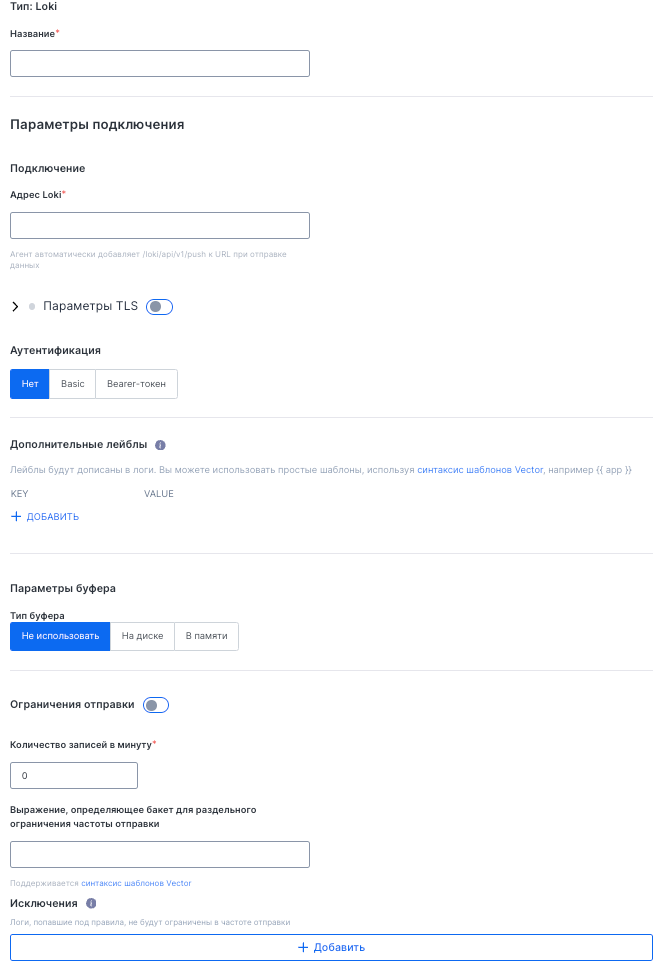
To configure log delivery:
- Click the “Add” button.
- Select one of the target storage systems:
- Loki
- ElasticSearch
- Logstash
- Vector
- Kafka
- Splunk
- Specify the storage system name and connection address.
- If necessary, specify additional settings:
- TLS parameters for a secure connection.
- Authentication (“Basic” or “Bearer token”).
- Additional labels for filtering and organizing logs.
- Buffer parameters that define how logs are stored before delivery (on disk or in memory).
- Delivery limits that allow you to configure the log record delivery rate.
- Exclusions that allow you to filter specific logs.
“Log collection” subsection
This subsection is intended for configuring log sources that can then be delivered to target storage systems. You can sort and filter existing log collection rules and add new sources.
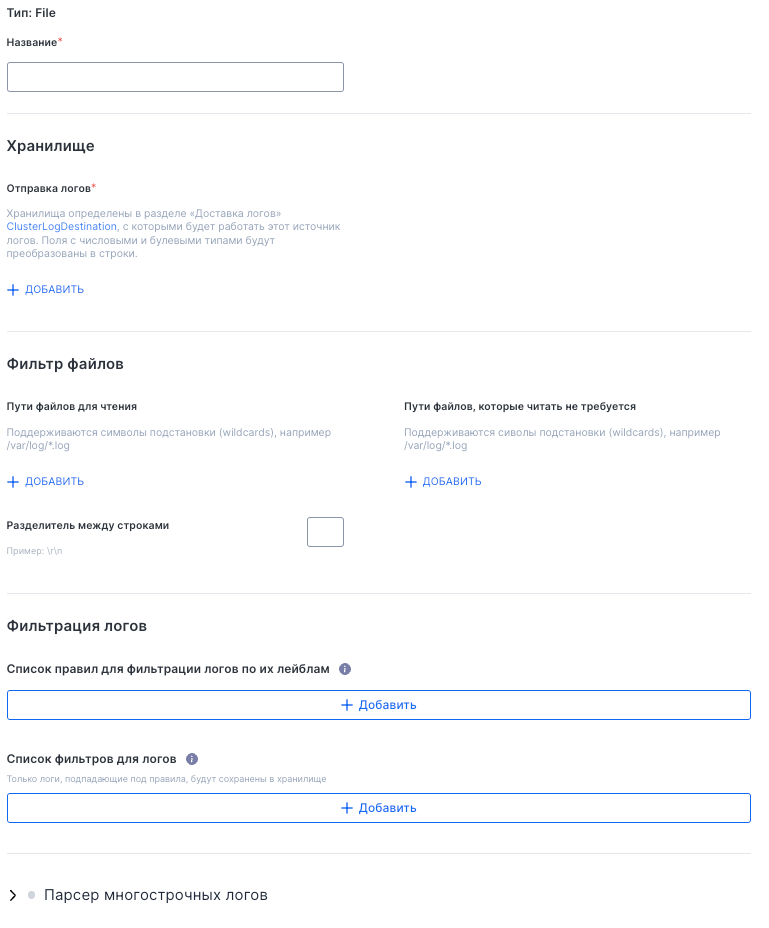
To configure collection sources:
- Click the “Add” button.
- Select one of the sources:
- File (collecting logs from the file system)
- KubernetesPods (collecting logs from Kubernetes pods)
- Specify the name and configure the parameters:
- “Storage”: Specify where the collected logs will be delivered.
- “File filters”: Specify the paths to log files that should or should not be read. Wildcards are supported.
- “Line delimiter” (optional): Specify the character separating records in the file;
- “Log filtering” (optional): Add label filtering rules and filters to keep only the required records.
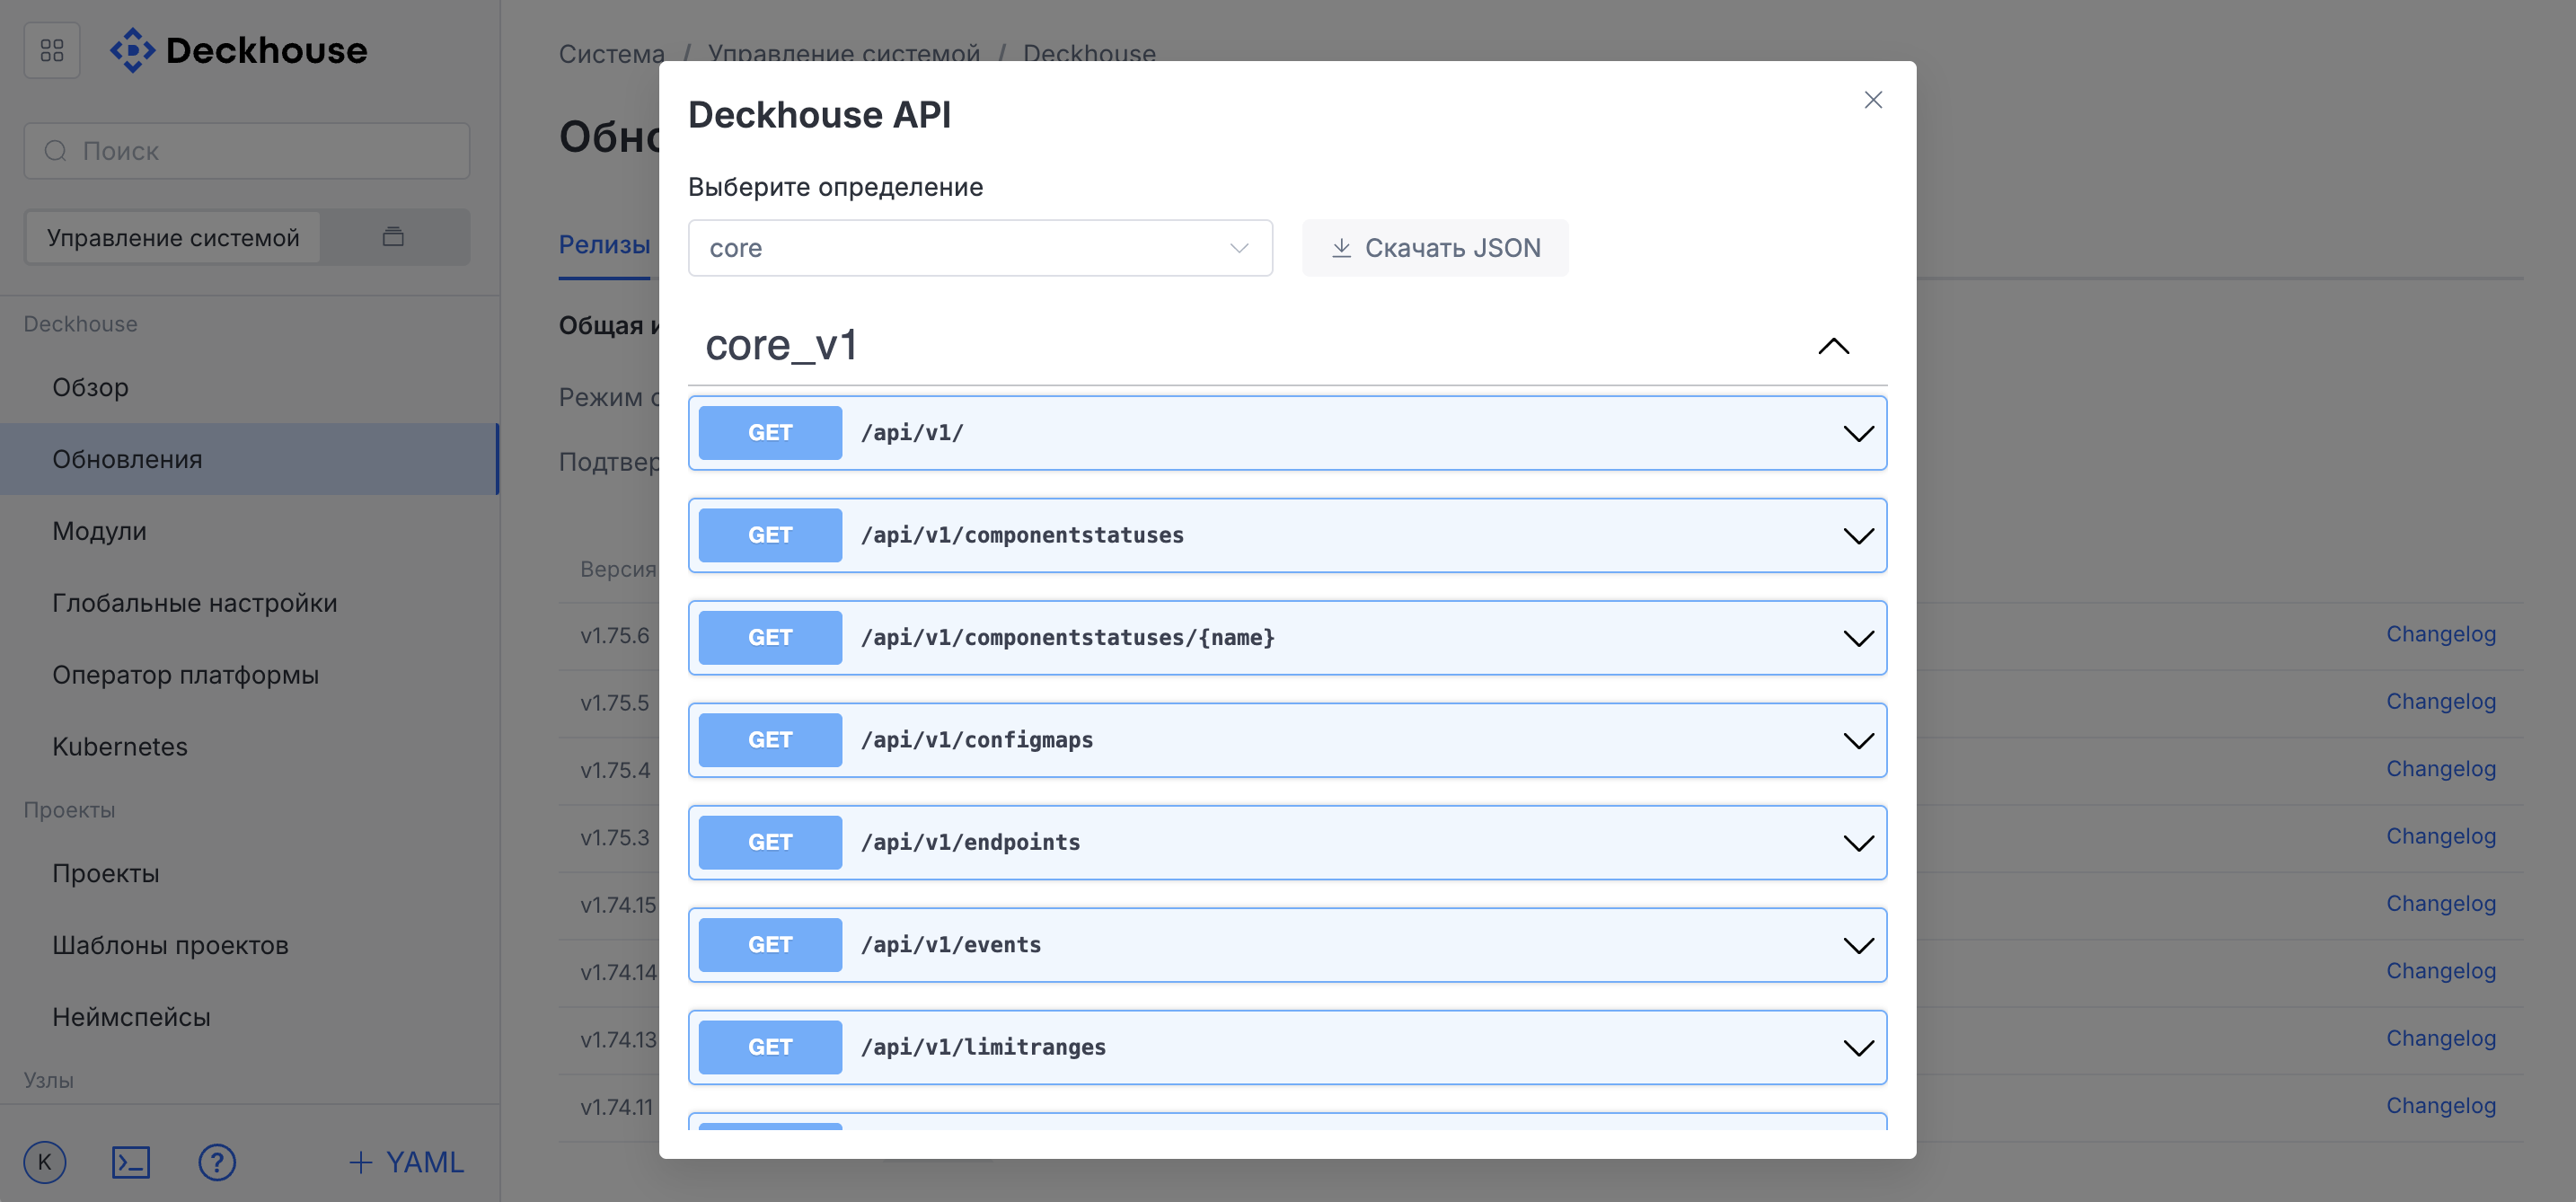
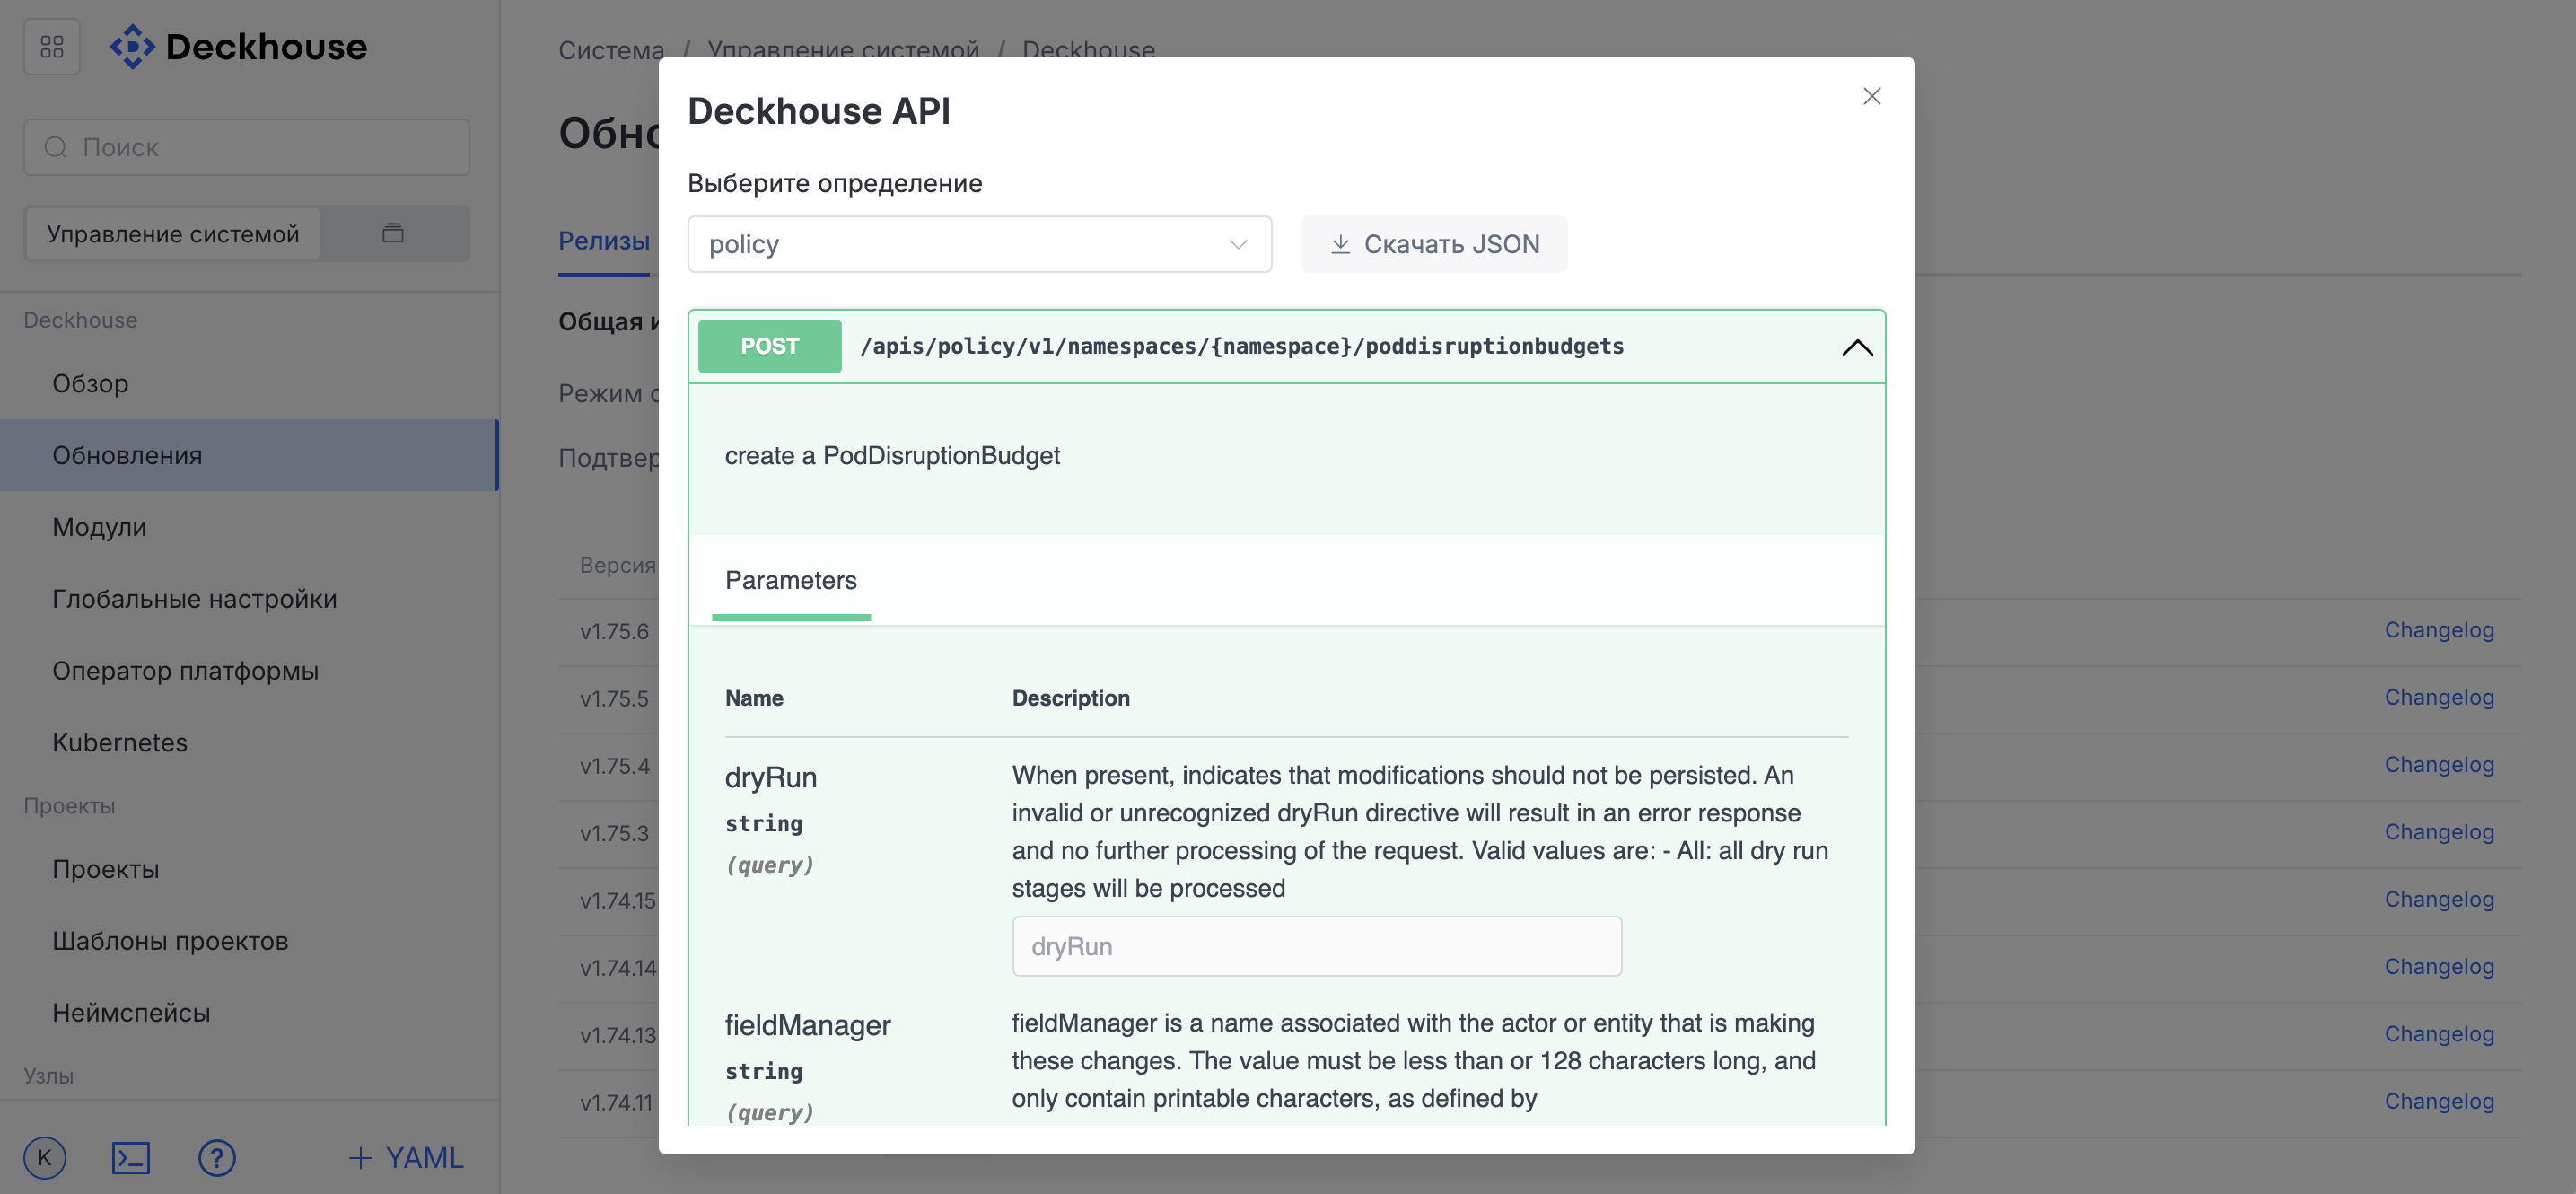
Viewing API information
To view API information in Swagger format, click the question mark button in the lower-left corner of the interface in the drop-down user menu.