The web interface for cluster network stack visualization is intended for operational diagnostics and analysis of network interactions. This interface enables tracking of communications between pods, services, and external resources, analyzing network activity and pinpointing network issues. The interface is implemented by the cilium-hubble module.
Accessing the web interface
To access the web interface for visualizing the cluster network stack, open the URL hubble.<CLUSTER_NAME_TEMPLATE>, where <CLUSTER_NAME_TEMPLATE> is the string matching the cluster’s DNS name template, as specified by the global parameter modules.publicDomainTemplate.
When you navigate to hubble.<CLUSTER_NAME_TEMPLATE>, you will see a namespace selection screen to choose which namespace’s network stack will be displayed.
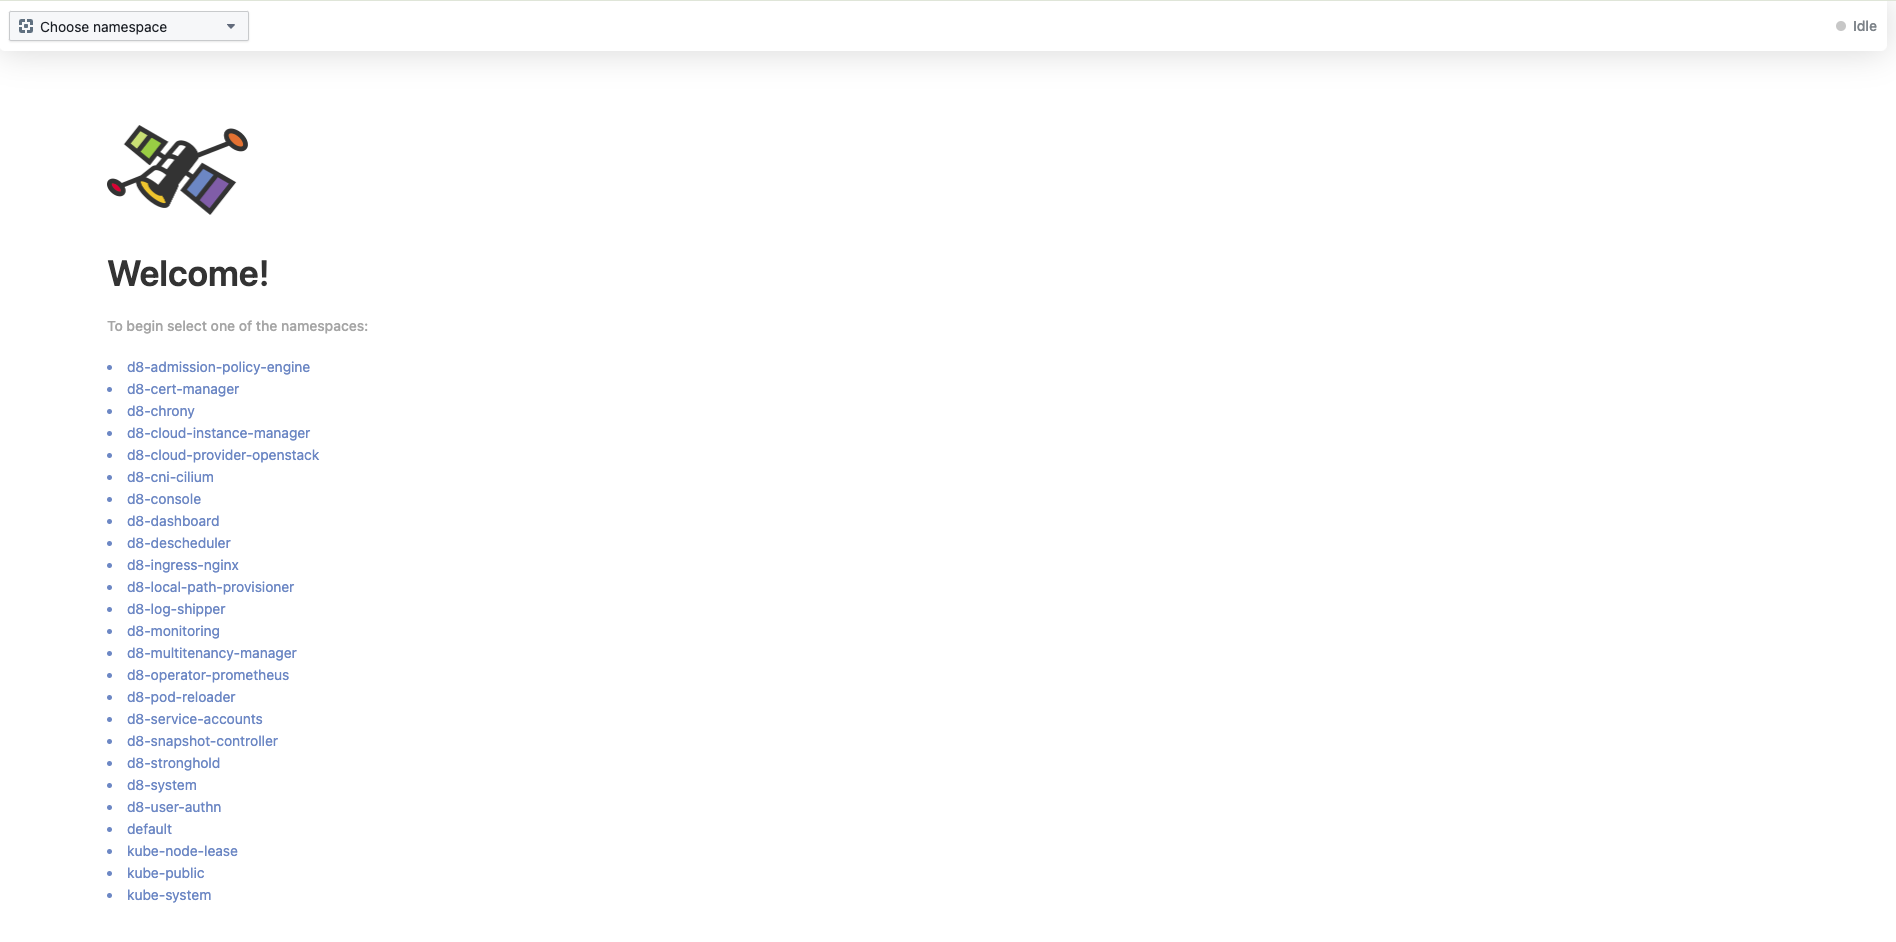
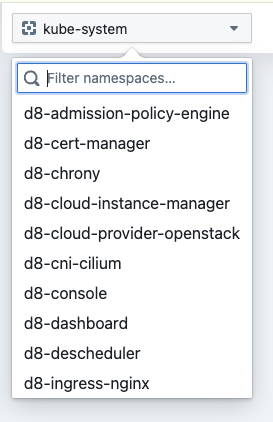
Select a namespace using the dropdown in the top-left corner or by clicking the desired namespace name in the list at the center of the screen.
After selecting a namespace, you will see the network stack visualization and analysis tools. The interface consists of the following parts:
- Top panel with filters and a brief cluster summary (number of flows and number of nodes). For more details on filtering what is displayed, see the section Filtering data for display.
- Network flow diagram. For more information on working with the visual flow diagram, see Working with the network flow diagram.
- Network flows and events table. For details on using the table, see Working with the network flows and events table.
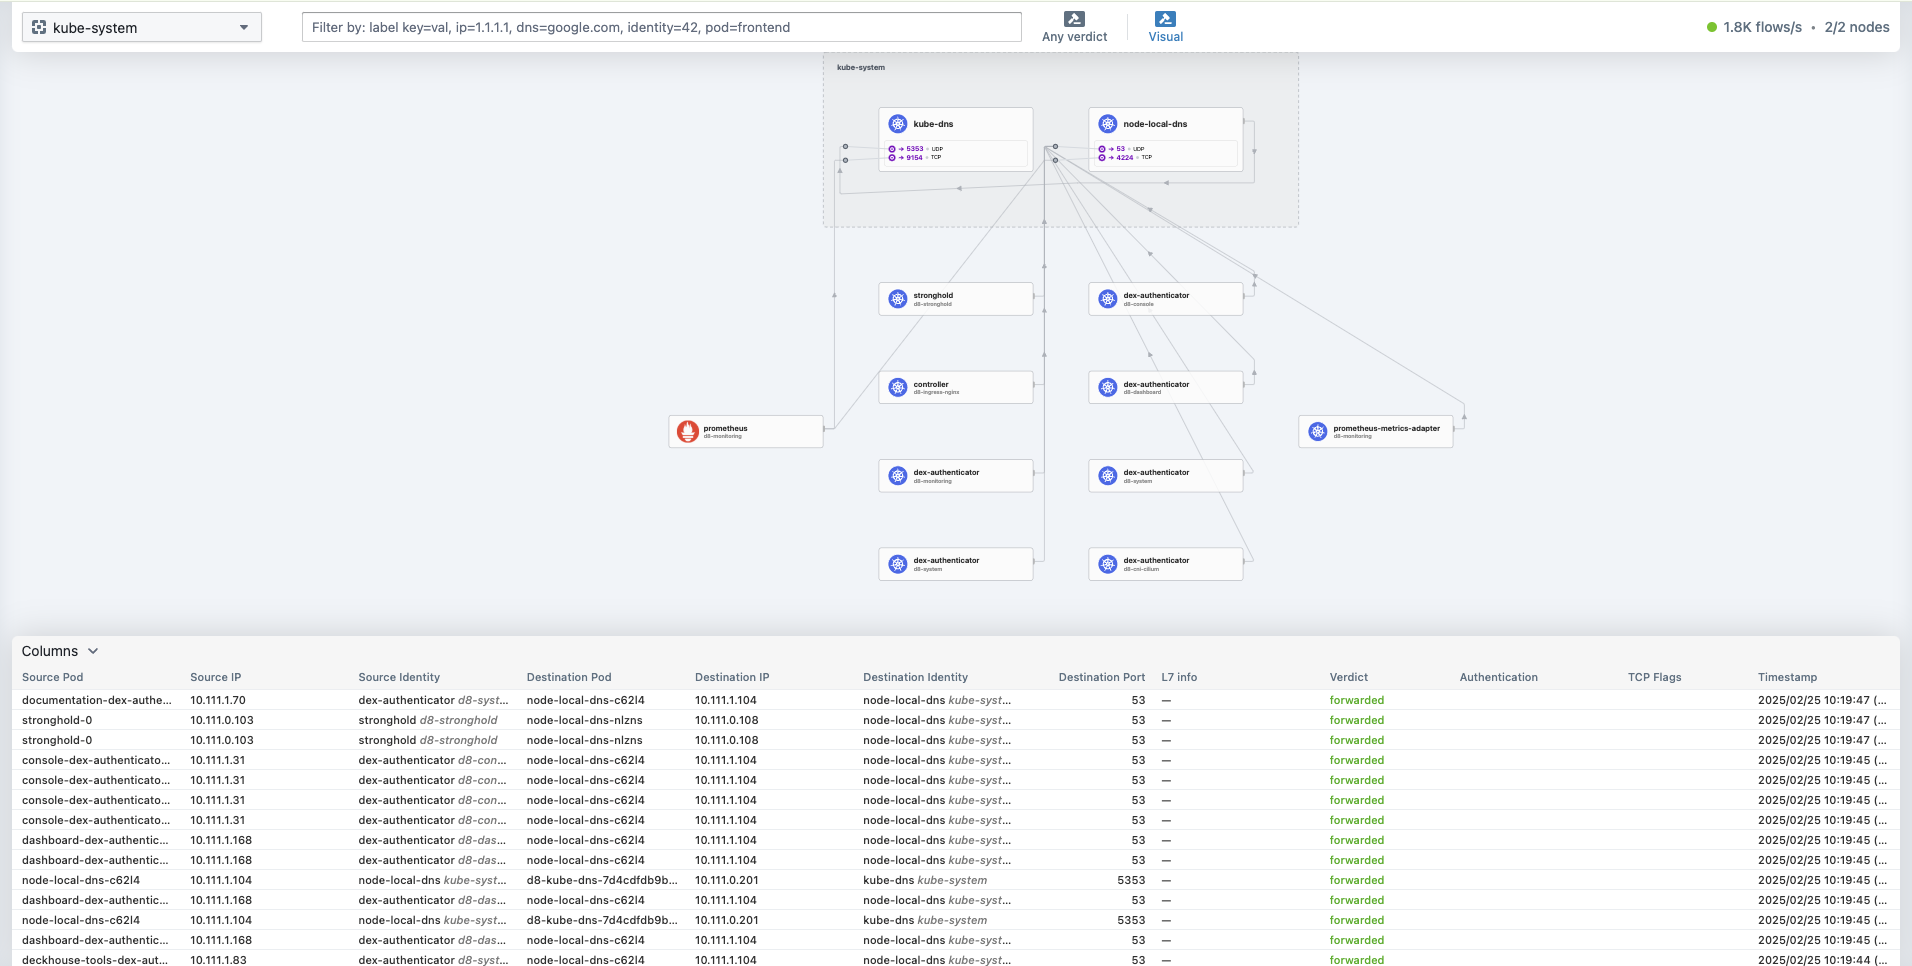
Data in the diagram and the network flows table is displayed in real time.
Filtering data for display
To filter the displayed information about the network stack and flows, use the top panel with filters. This panel contains:
-
Namespace selector (dropdown on the left side of the panel).
-
Resource selector (input field in the center of the panel) to choose which namespace resources’ flows to display.

-
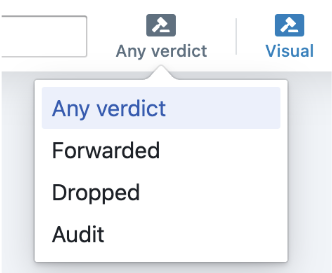
Flow verdict selector, based on the decision (“verdict”) made by Cilium for each flow.
-
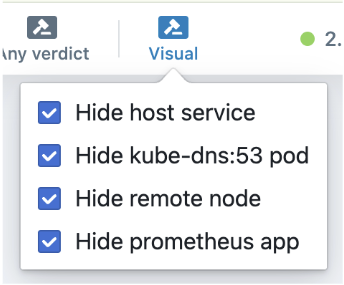
Diagram element selector for choosing which elements in the namespace to show on the diagram.
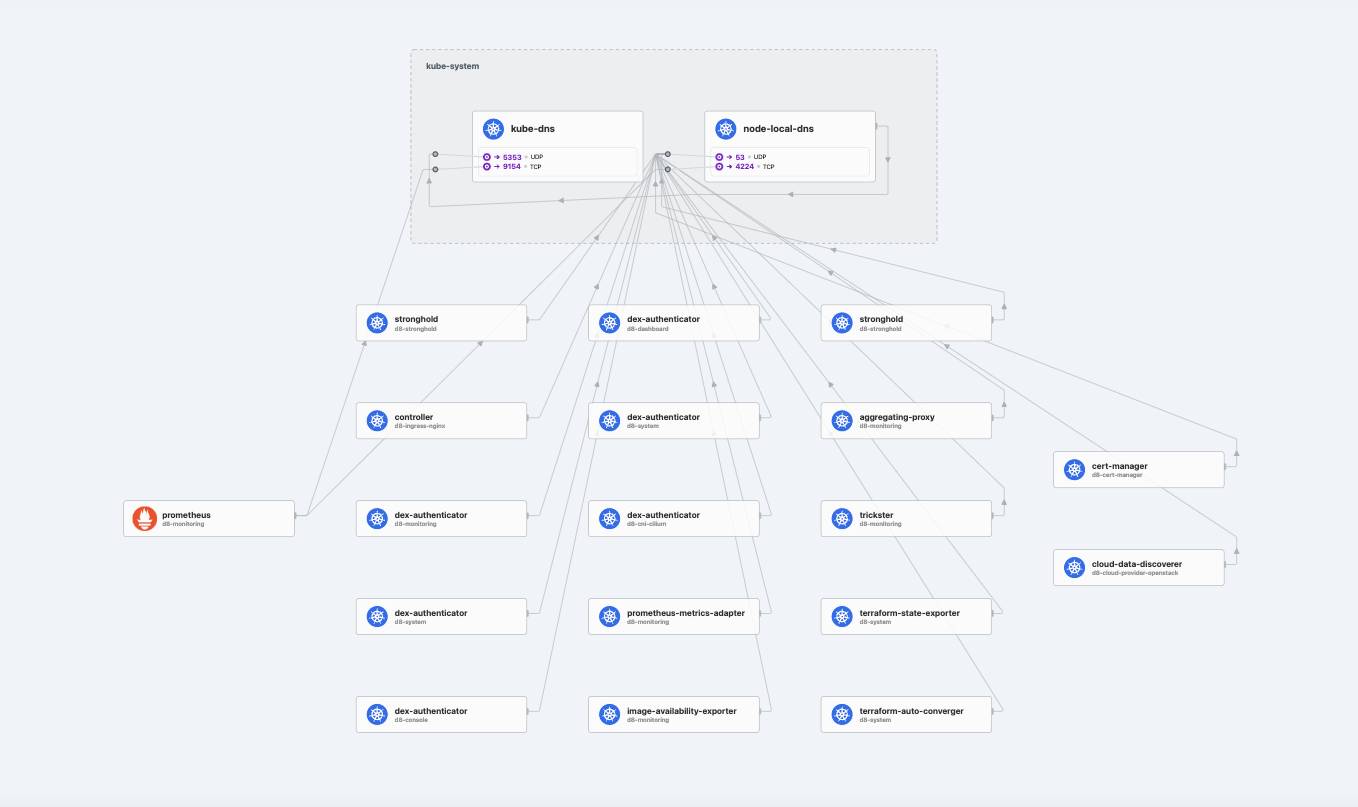
Working with the network flow diagram
The network flow diagram for the selected namespace appears in the middle of the screen, showing the network stack visualization and analysis tools. The diagram displays the resources of the chosen namespace inside a rectangle labeled with that namespace’s name, as well as external elements they interact with.
To view detailed information (labels, network interactions, etc.) for a specific resource on the diagram, click on that resource.
Working with the network flows and events table
Each row in the table contains the following information about a network flow:
- Source Pod (pod name of the flow source)
- Source IP (IP address of the source pod)
- Source Identity (entity identifier for the source)
- Destination Pod (pod name of the flow destination)
- Destination IP (IP address of the destination pod)
- Destination Identity (entity identifier for the destination)
- Destination Port (destination port number)
- L7 Info (application-layer information, if the flow uses HTTP)
- Verdict (the decision made by Cilium for the flow)
- Authentication (authentication results for the flow, if applicable)
- TCP Flags (TCP flags associated with the flow)
- Timestamp (time when the flow occurred)
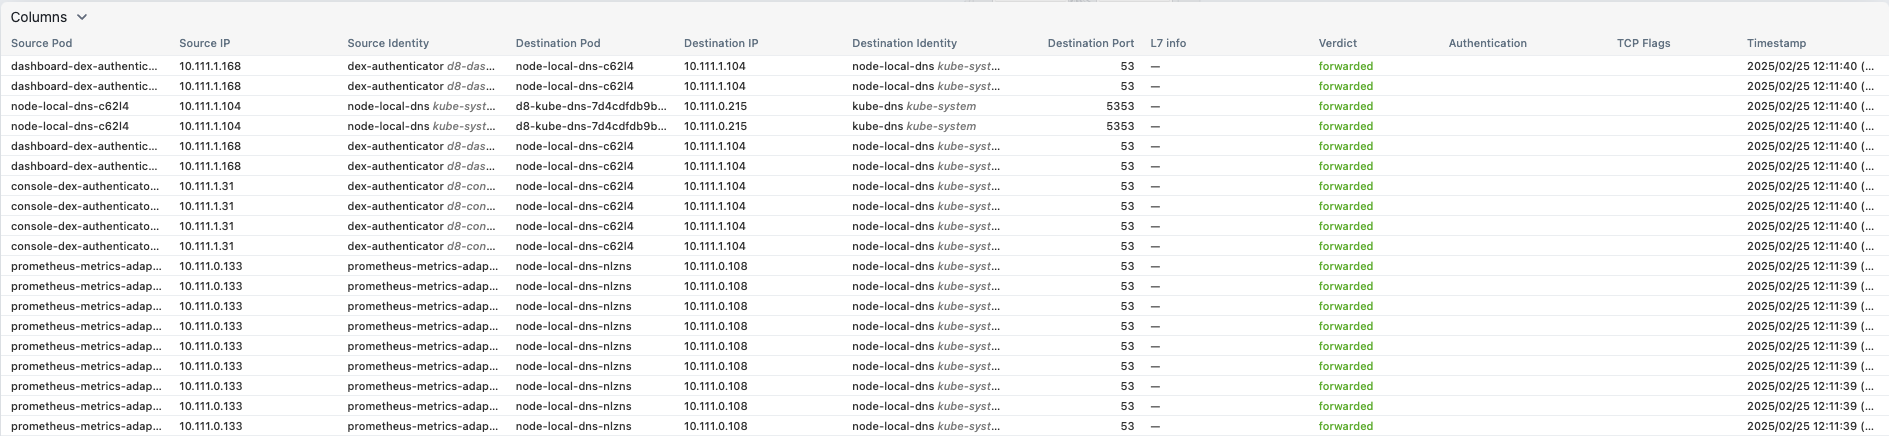
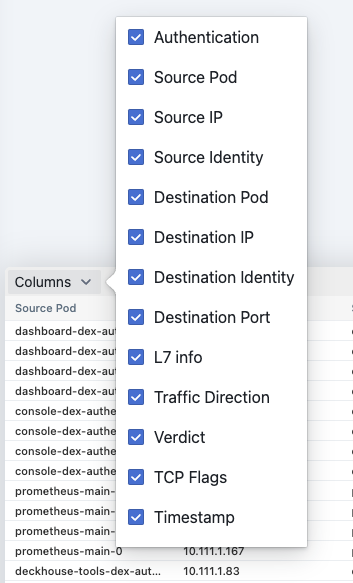
Configuring the column set
To configure which columns are shown in the table, click the Columns button in the top-left corner of the table and select the columns you need.
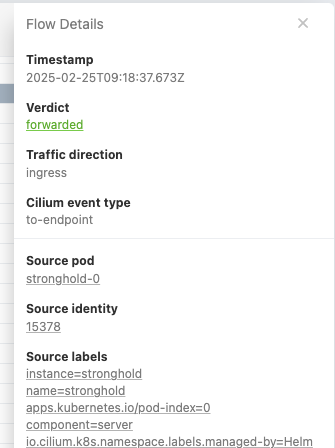
Viewing row details
To view detailed information for a specific row in text form, click anywhere within that row. The information will appear on the right side of the table. These details are shown regardless of which columns are currently selected for display.