Monitoring system web UI
Grafana is used as the web UI for the monitoring system.
Main page
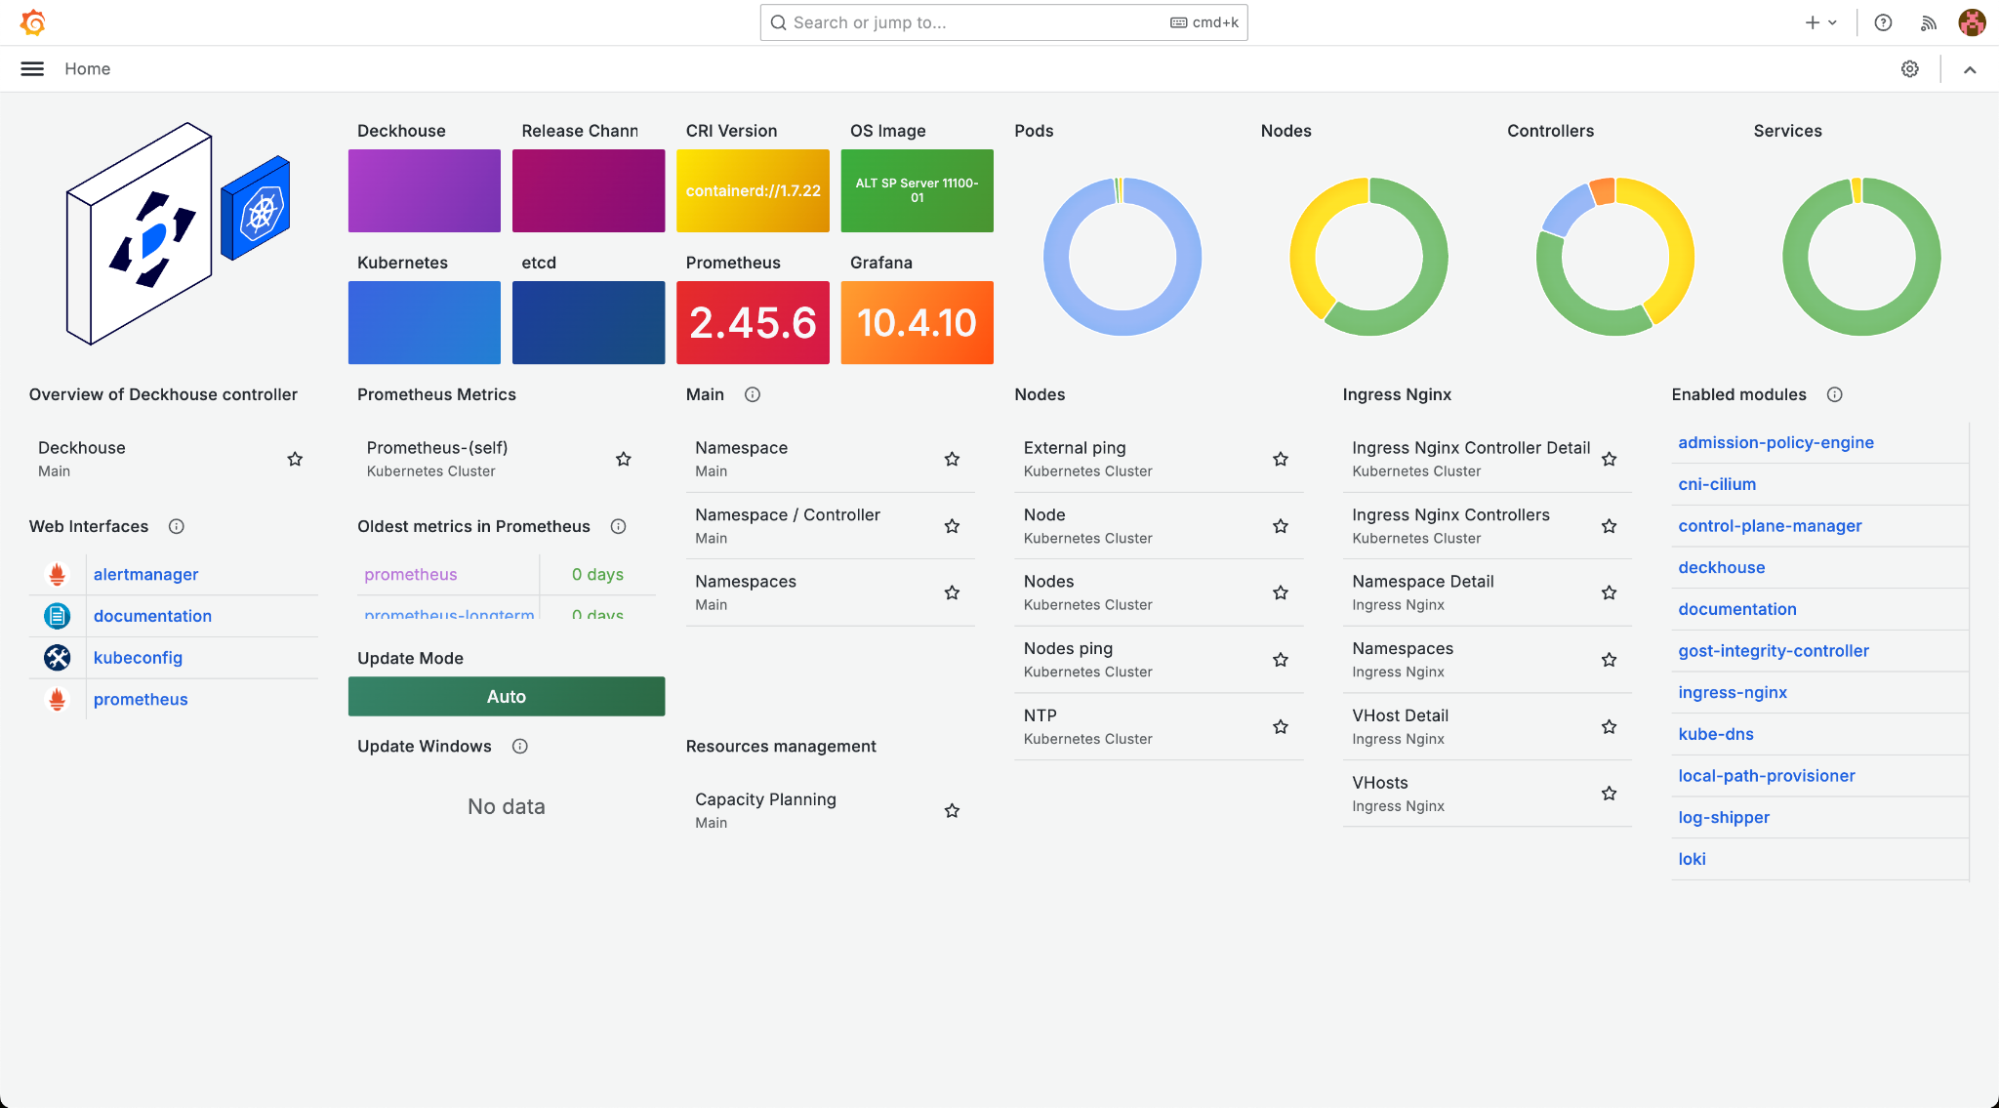
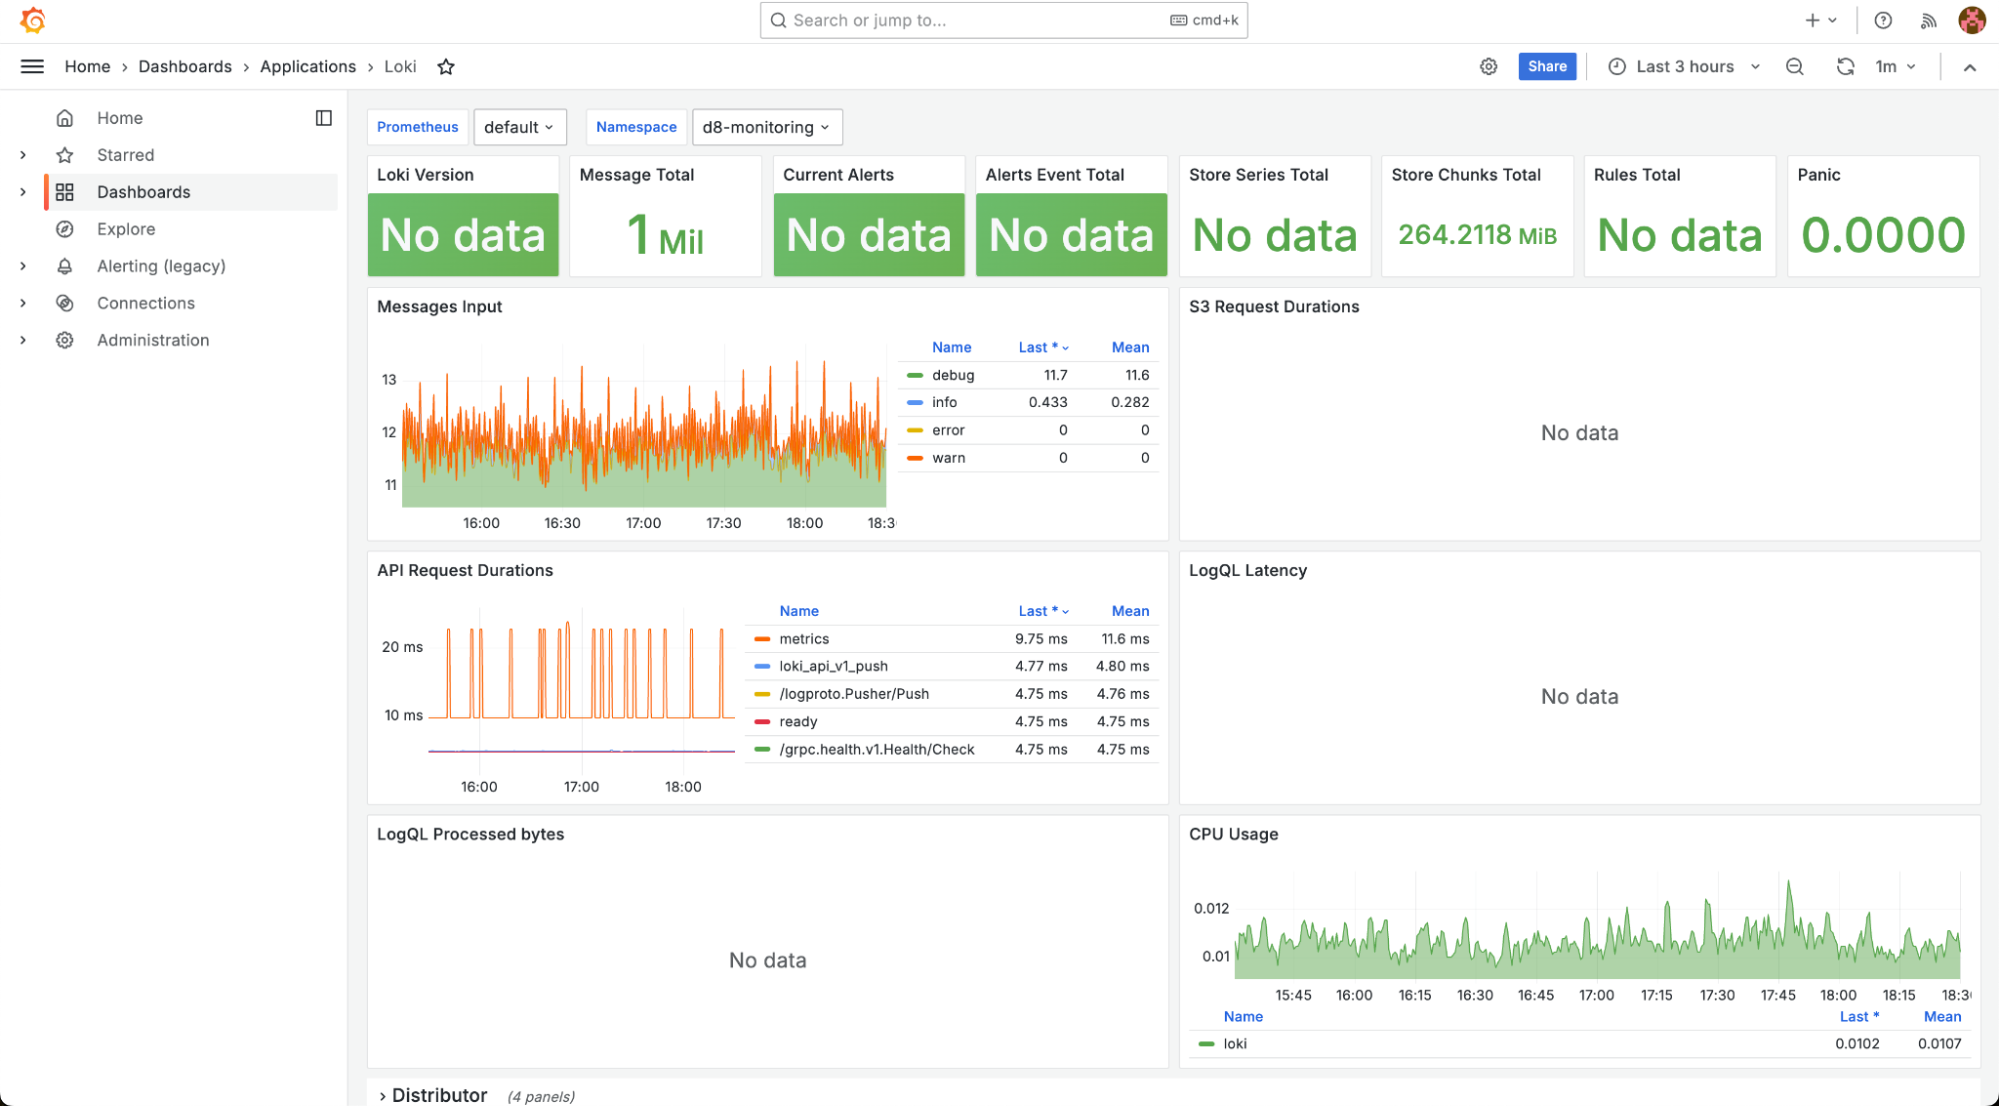
The main page of Grafana displays key information about the cluster and its main components.
In the top left corner, you’ll find details about the main cluster components:
the containerd version, the Linux distribution the cluster is running on,
and the versions of Grafana, Prometheus, and other components.
The top right corner features convenient graphical indicators for key metrics including the number of nodes in the cluster, the number of running Pods, and other cluster entities.
For more detailed information, hover the mouse cursor over any element to display a tooltip.
Below the component info blocks, there are quick links to dashboards for specific cluster components, such as node monitoring, system resource usage, and network interaction statistics.
On the left side, you’ll find a section with links to the cluster’s available web interfaces, as well as a block showing the cluster update method and the scheduled update windows (if configured).
In the top left corner of the main page is a button that opens the side menu, which contains links to Grafana’s core sections.
Clicking the Dashboards tab opens a list of all available Deckhouse dashboards, grouped by category.
These dashboards have a nested structure and are grouped by purpose: cluster applications (Applications), network interaction (Ingress Nginx), cluster parameters (Kubernetes Cluster), Main, and Security.
Working with dashboards
A dashboard is a page with tables and graphs that display information about a selected cluster component.
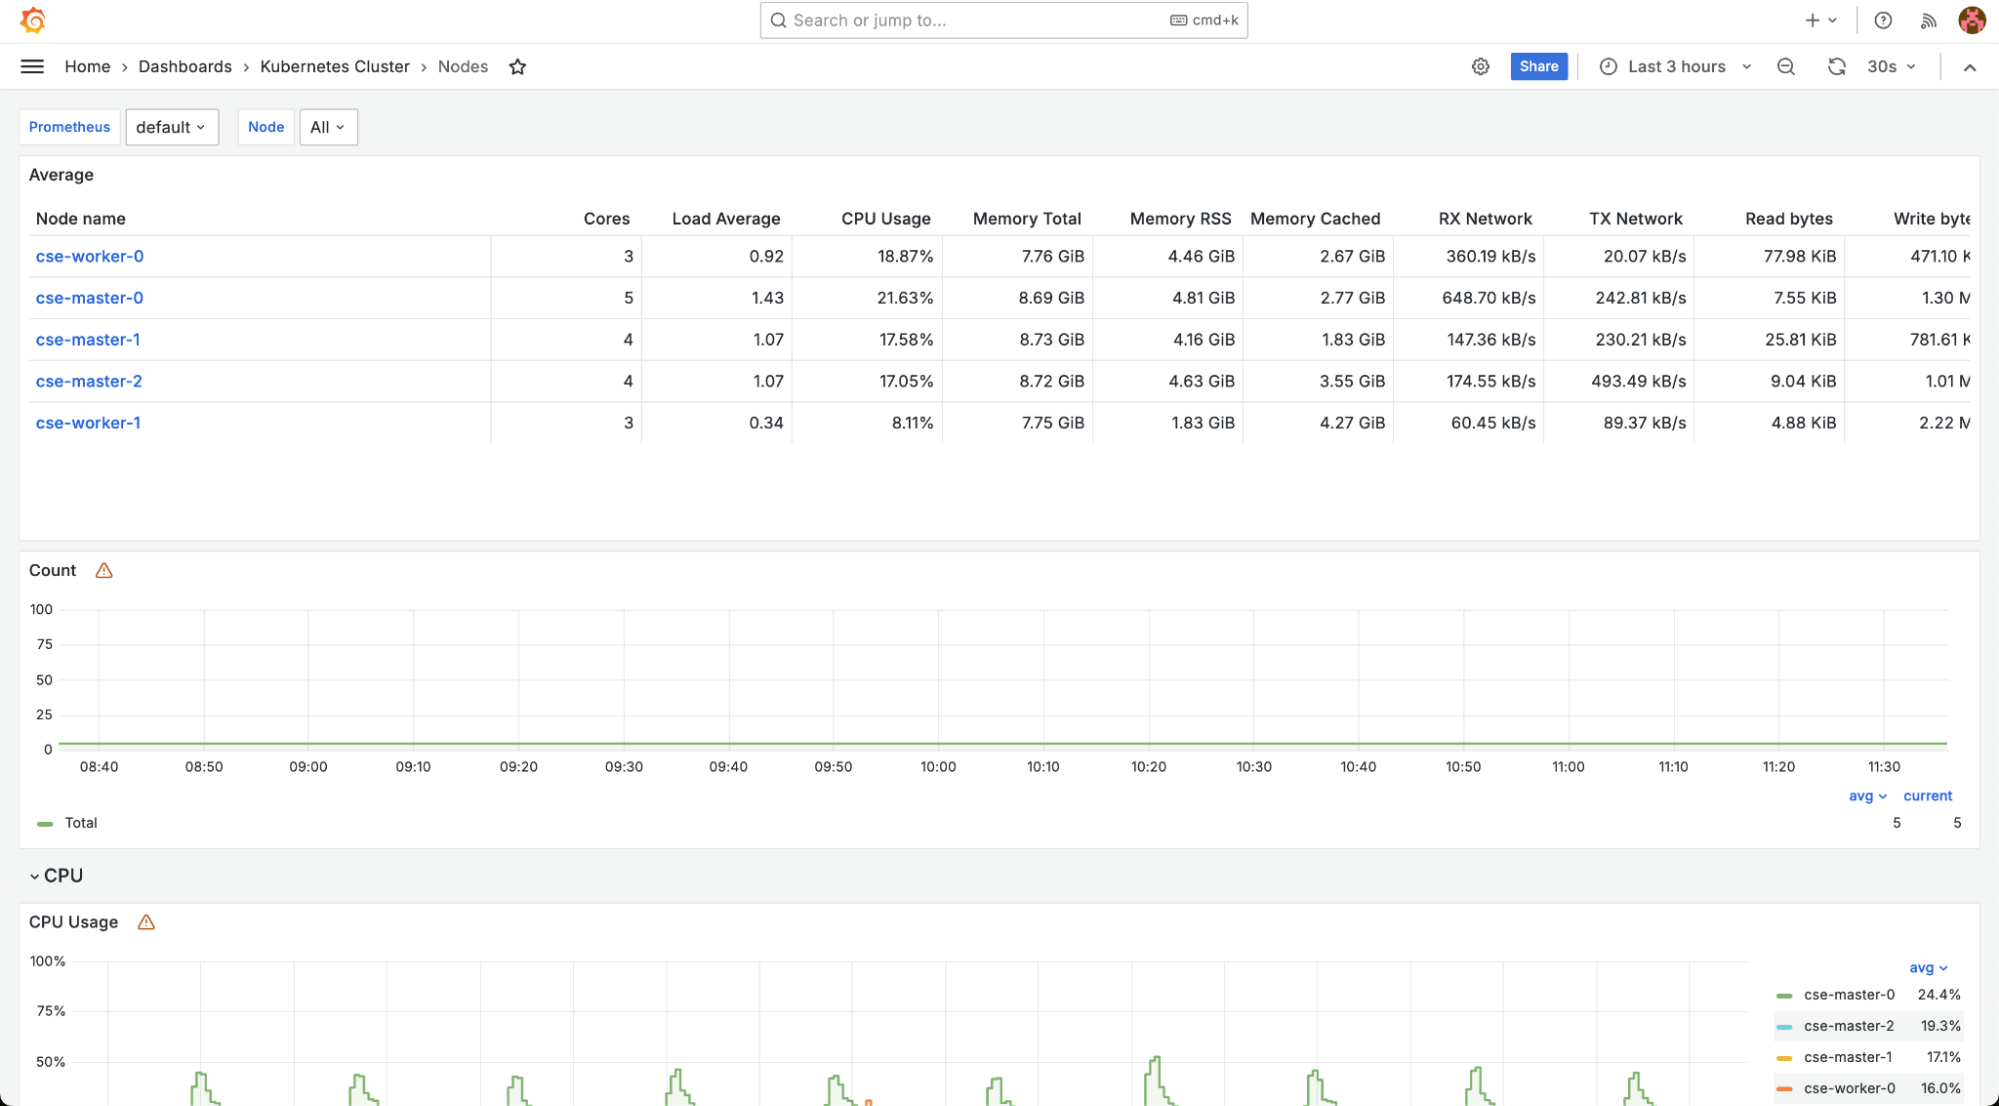
Data filtering
At the top of the page, below the title and the quick link to the parent category, you can find a filter block. This block lets you customize the displayed data by excluding irrelevant information or focusing on a specific component.
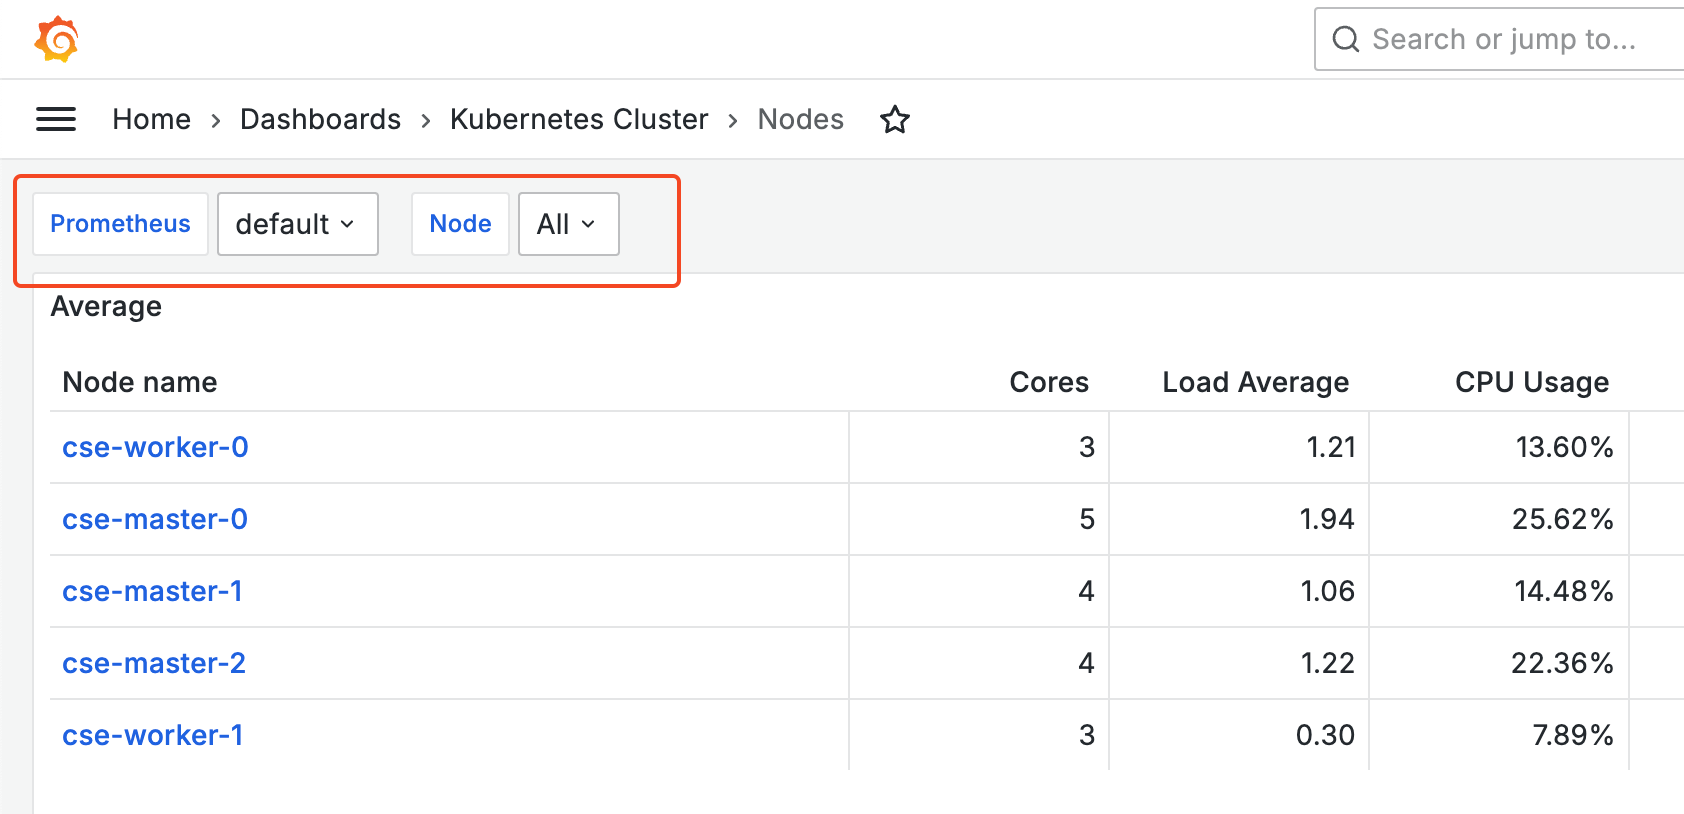
For example, in the dashboard showing cluster nodes, you can use the filter to display only one of the three nodes, excluding the others.
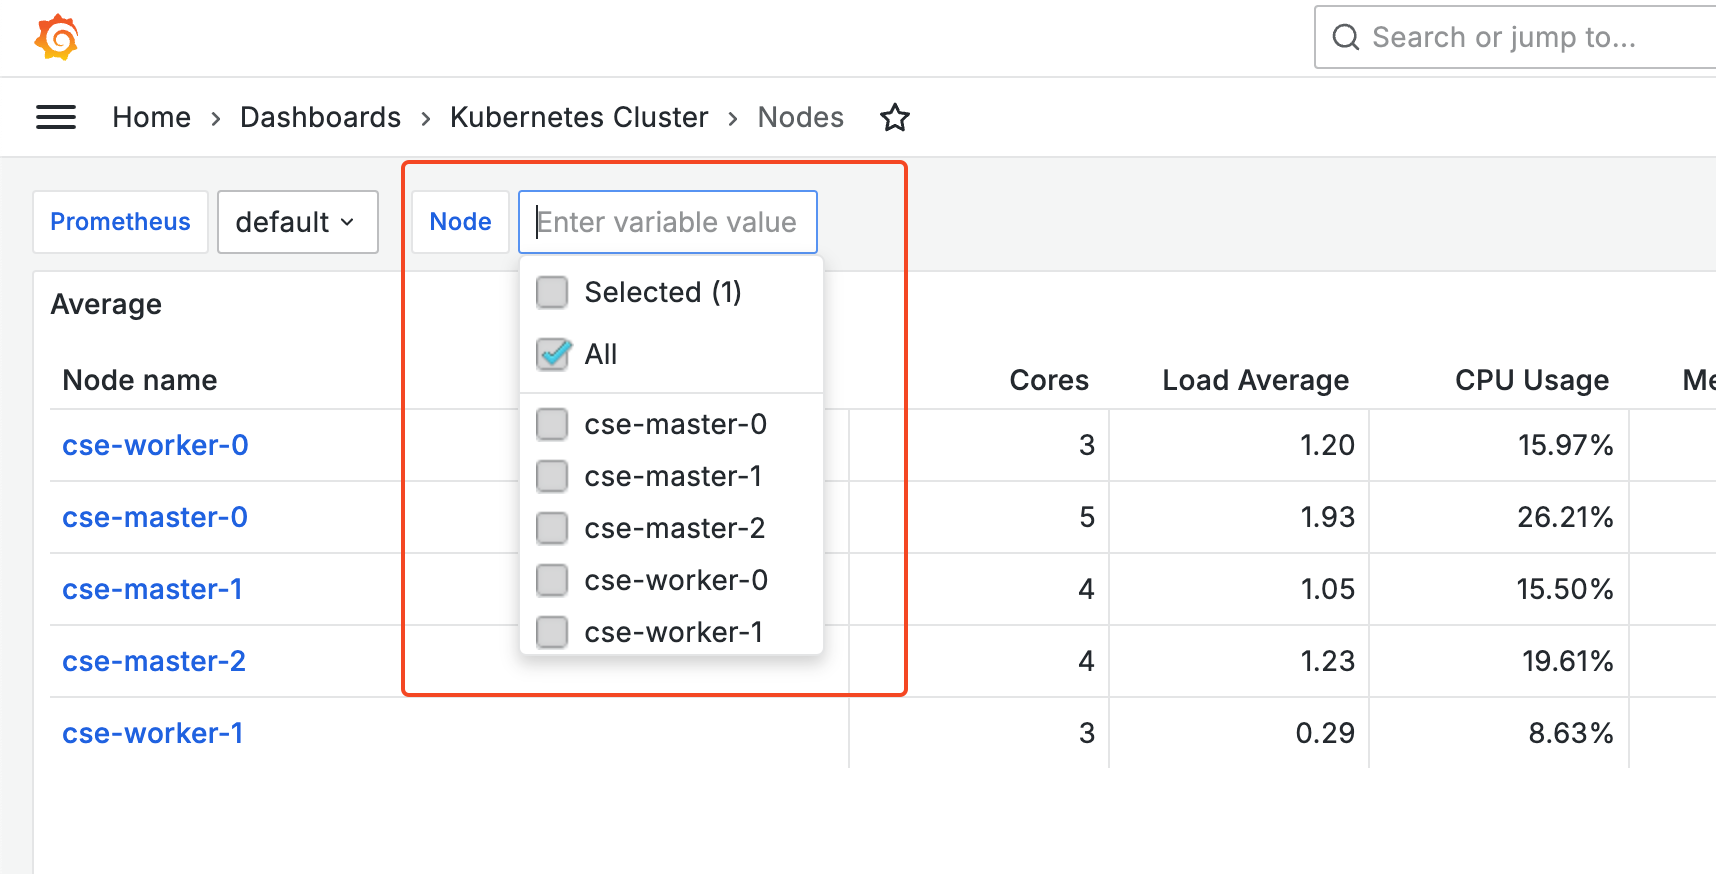
Once a filter is selected, the dashboard will update immediately to show data that matches the chosen filter parameters.
Working with data
Each chart on a dashboard can be viewed in more detail. To do this, hover the mouse cursor over the top right corner of the chart block, click the three-dot menu button, and select View.
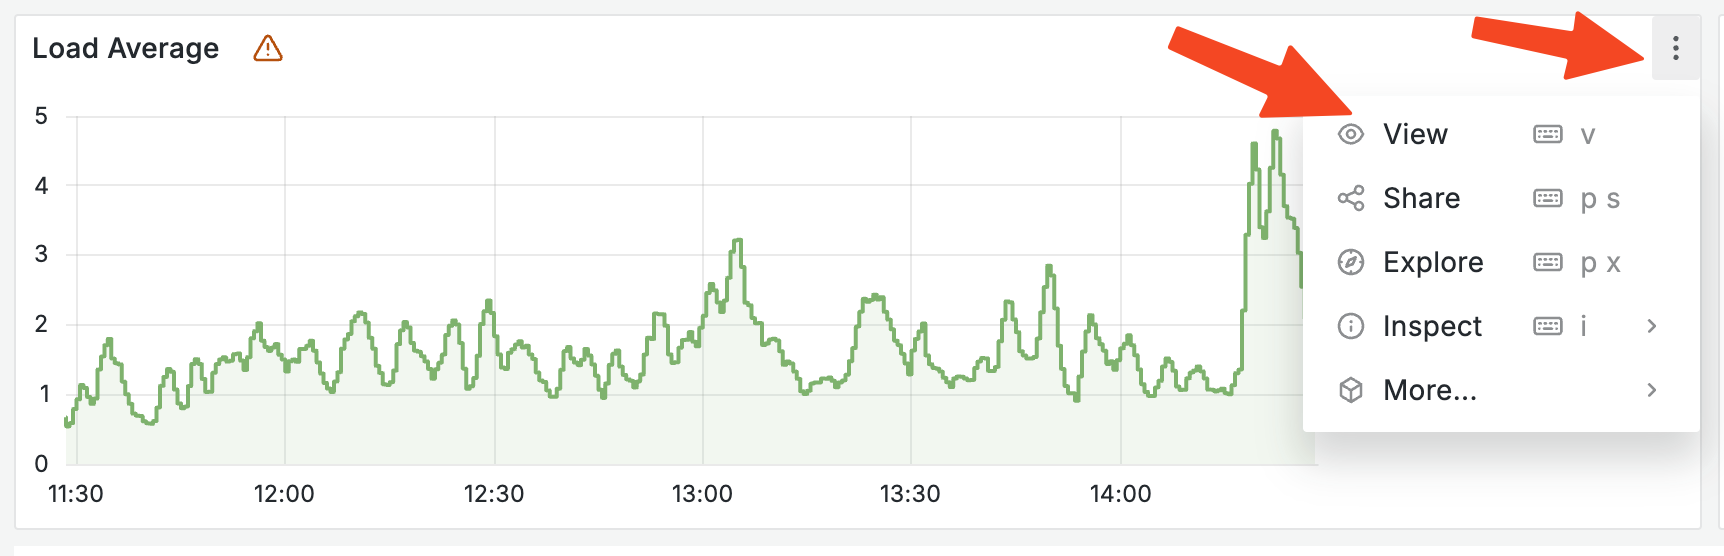
The selected chart will expand to full-screen view.
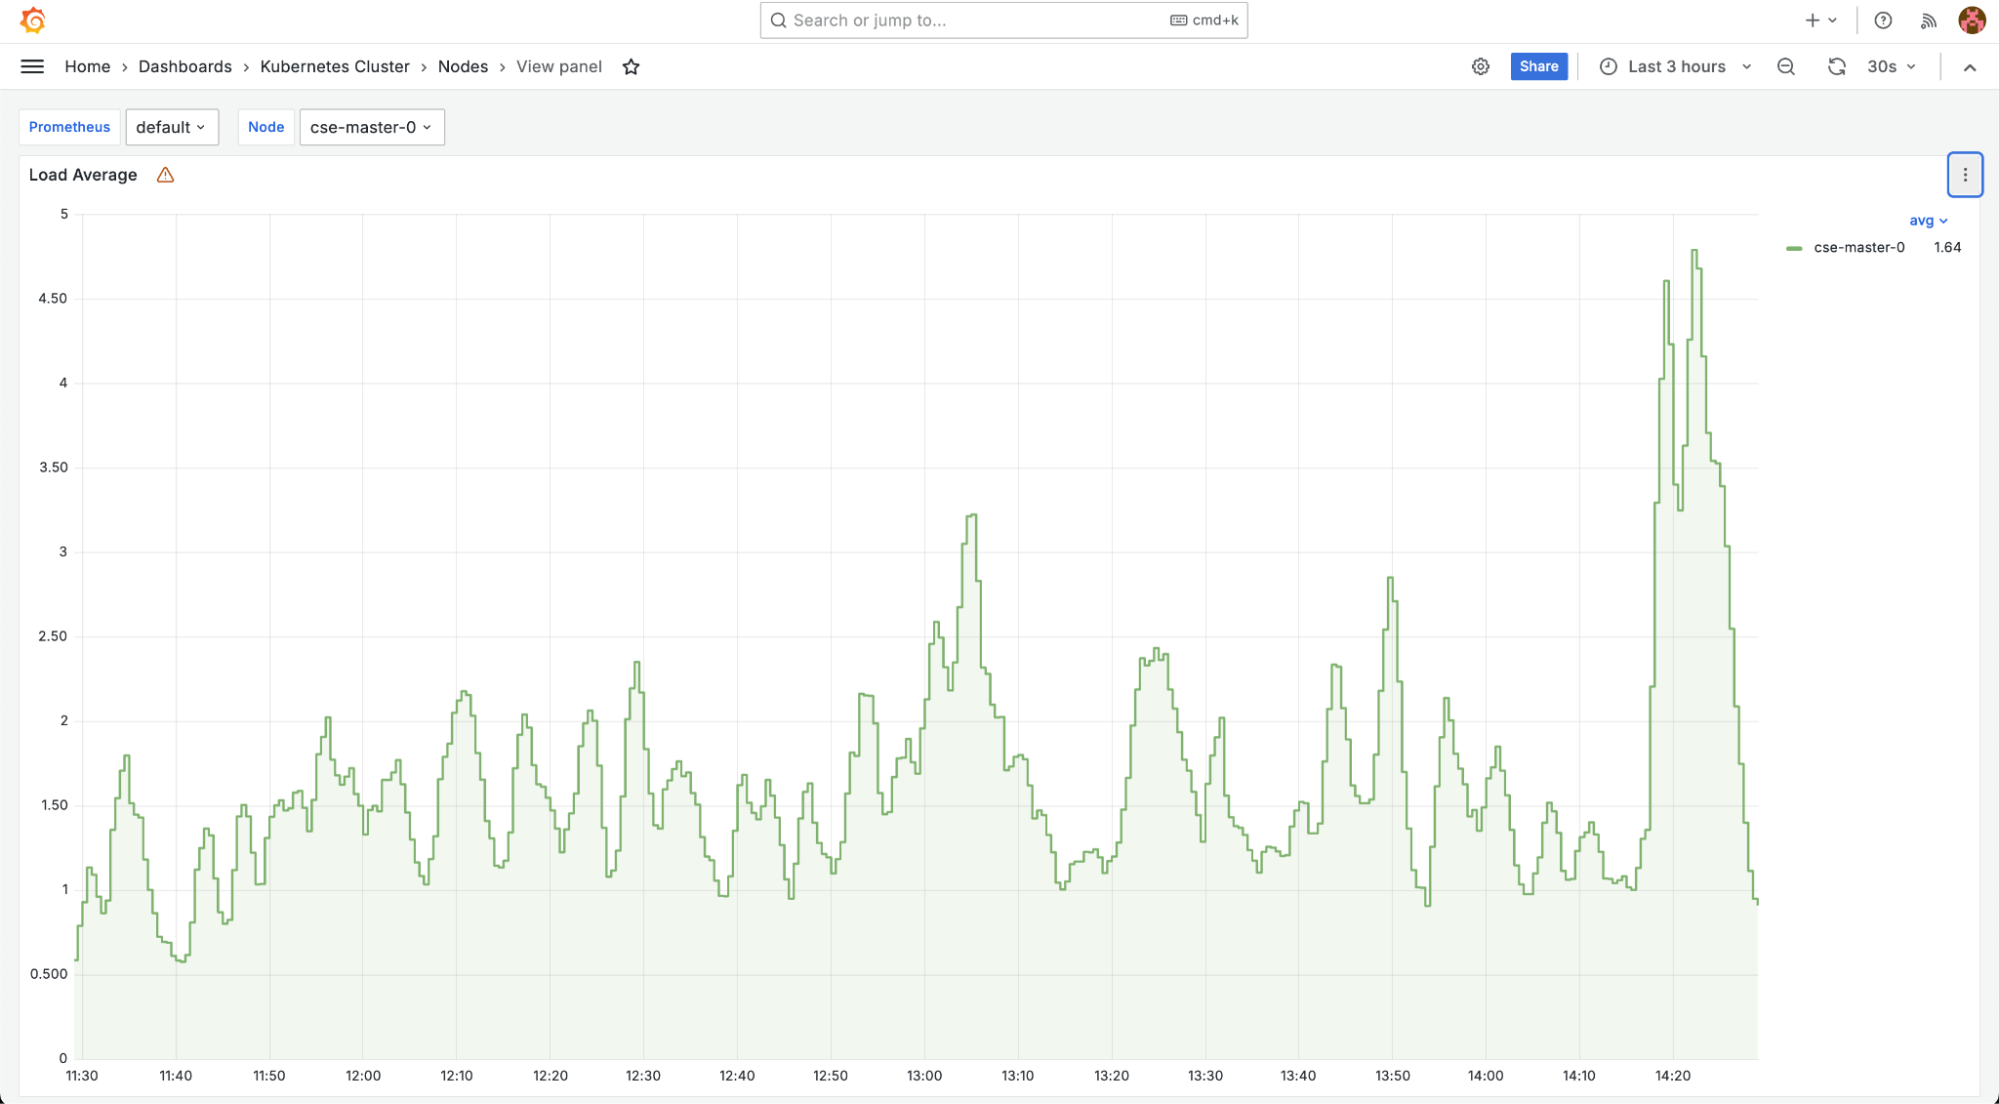
Here you can explore detailed data for a specific point in time. Hover over the graph. A red horizontal line will appear, and a tooltip will display the timestamp and value at that moment:
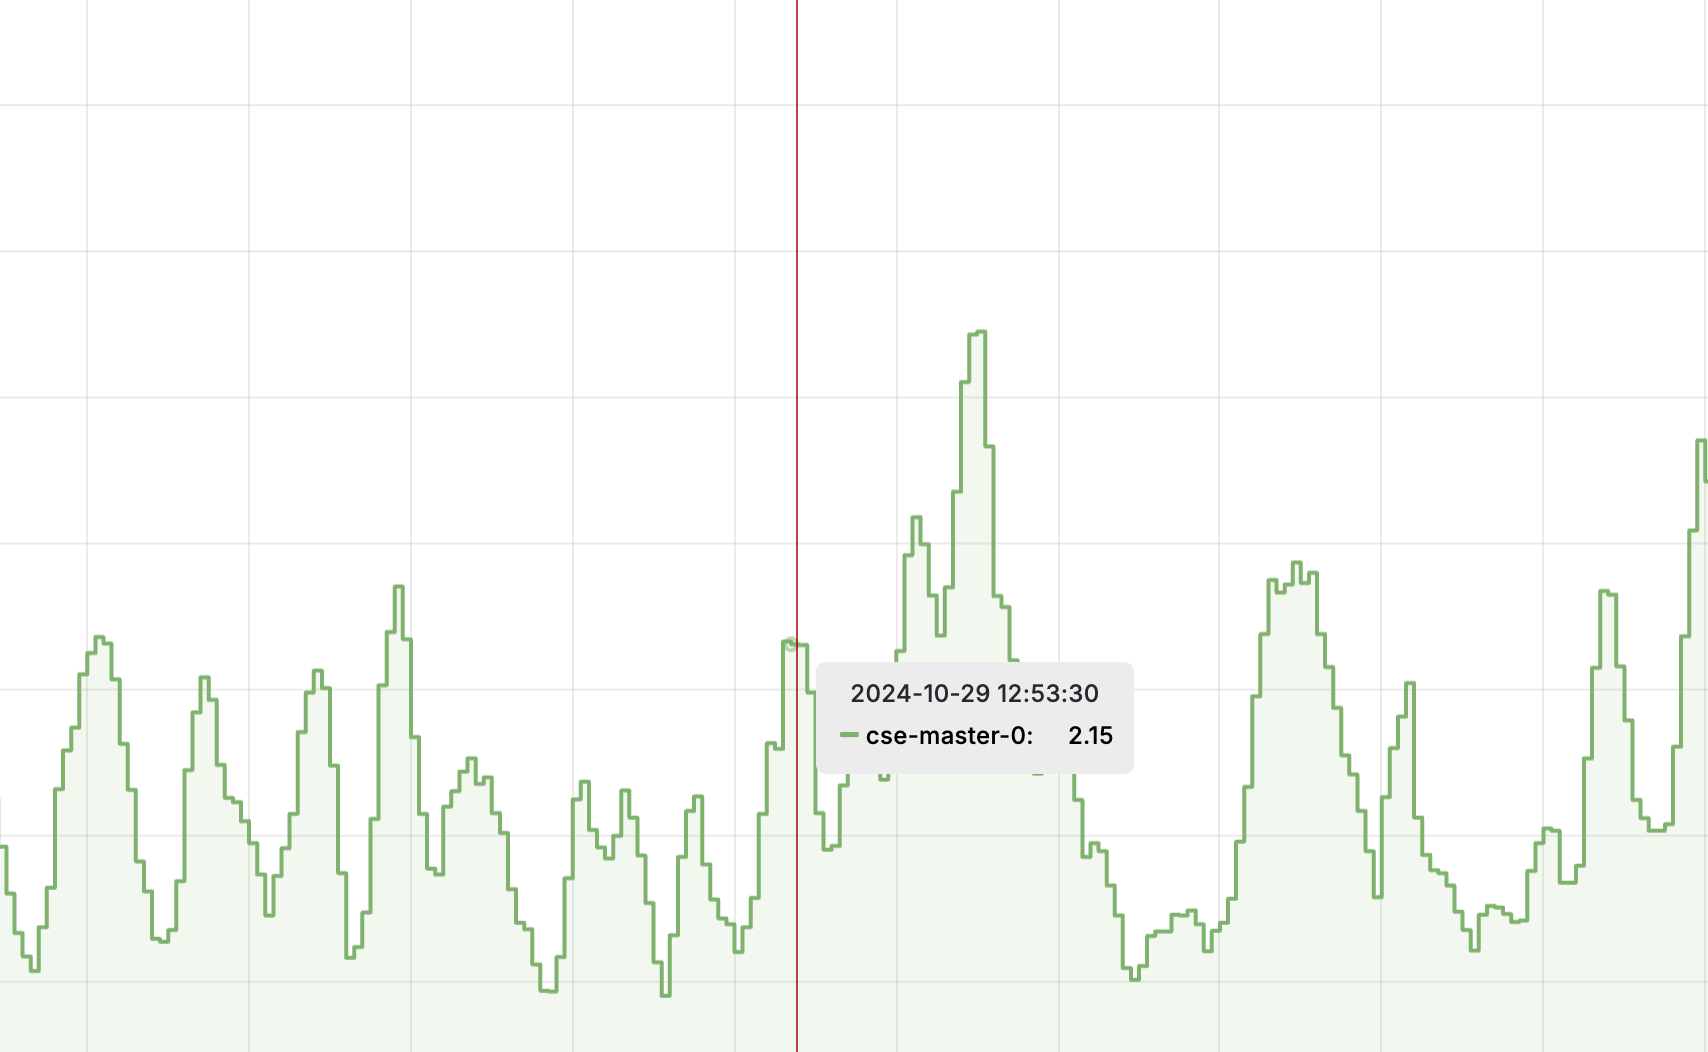
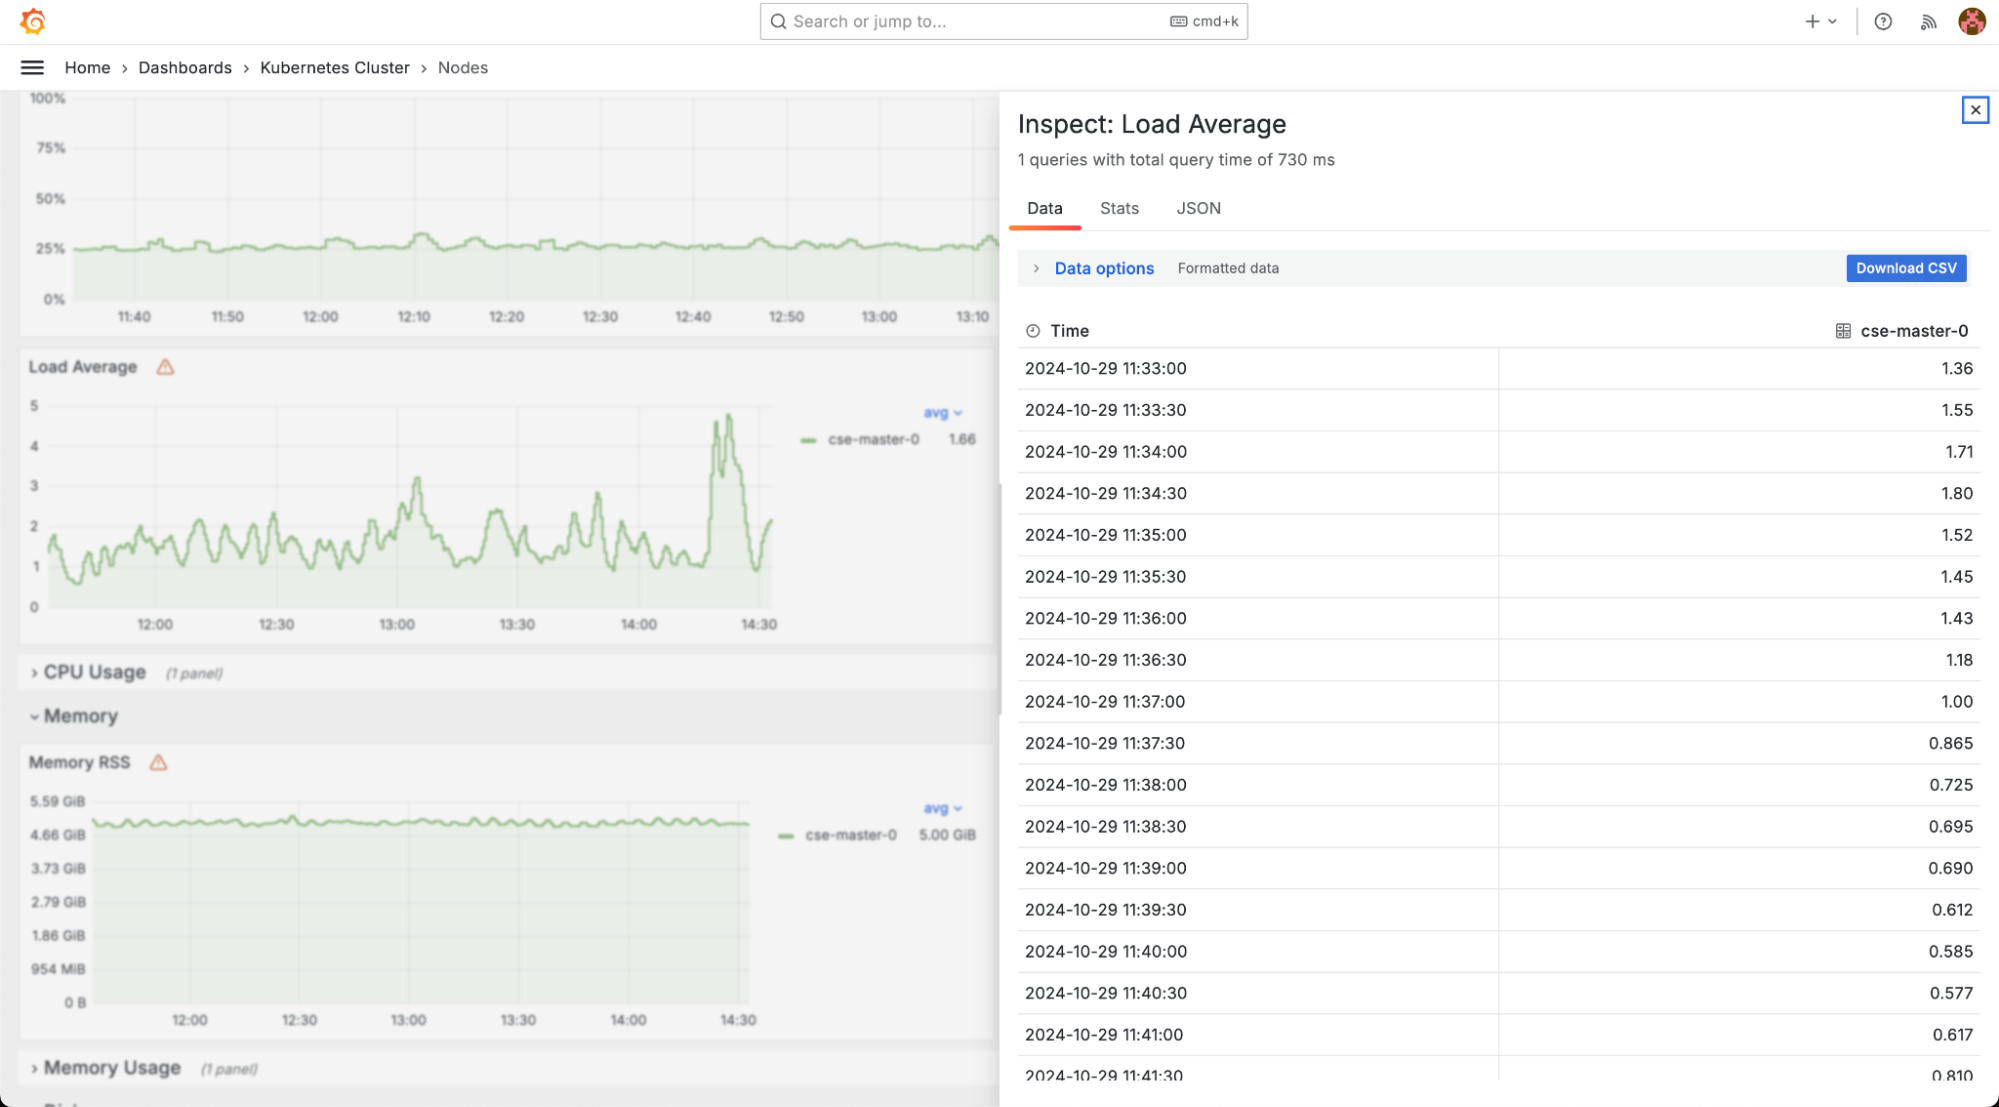
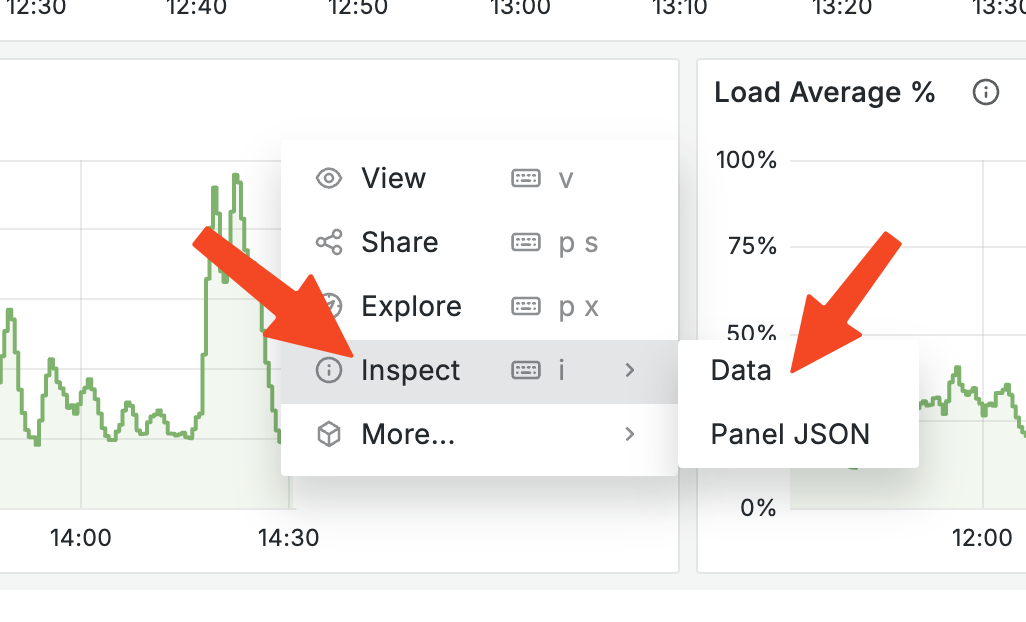
To return to the previous page, press Esc. To view the raw data behind the graph, click the three-dot menu in the top-right corner of the chart block and select Inspect, then choose the Data tab that corresponds to the query.
A panel with detailed record content will open on the right side of the page.
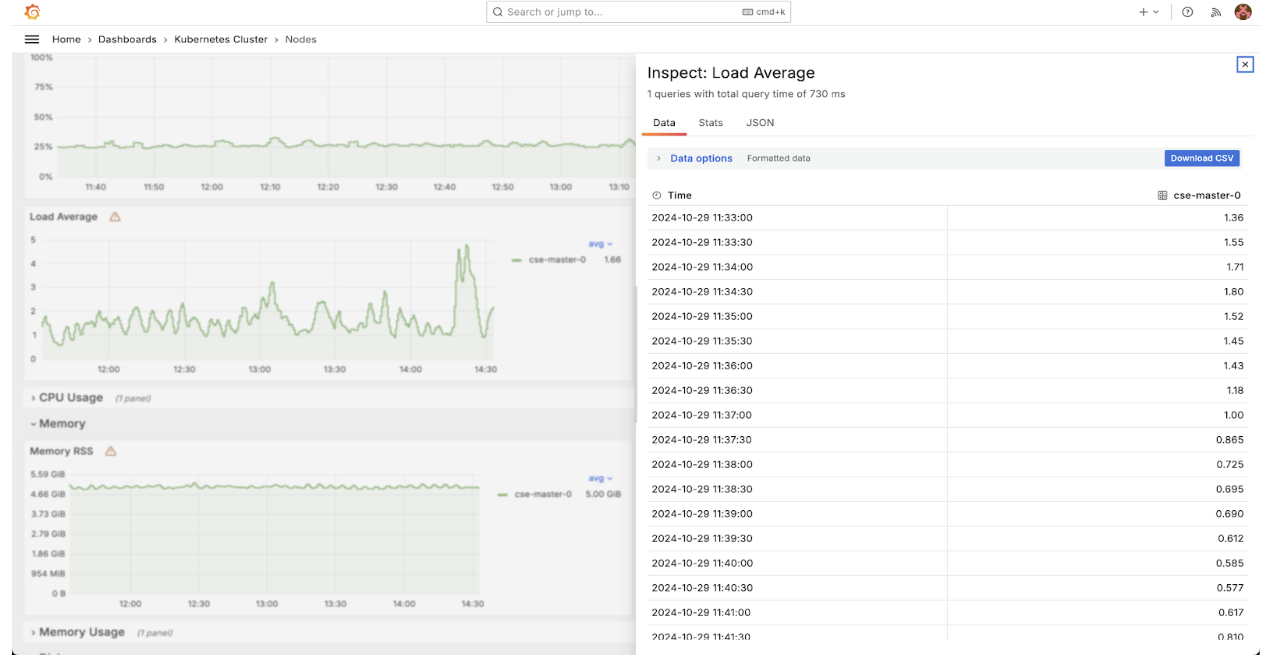
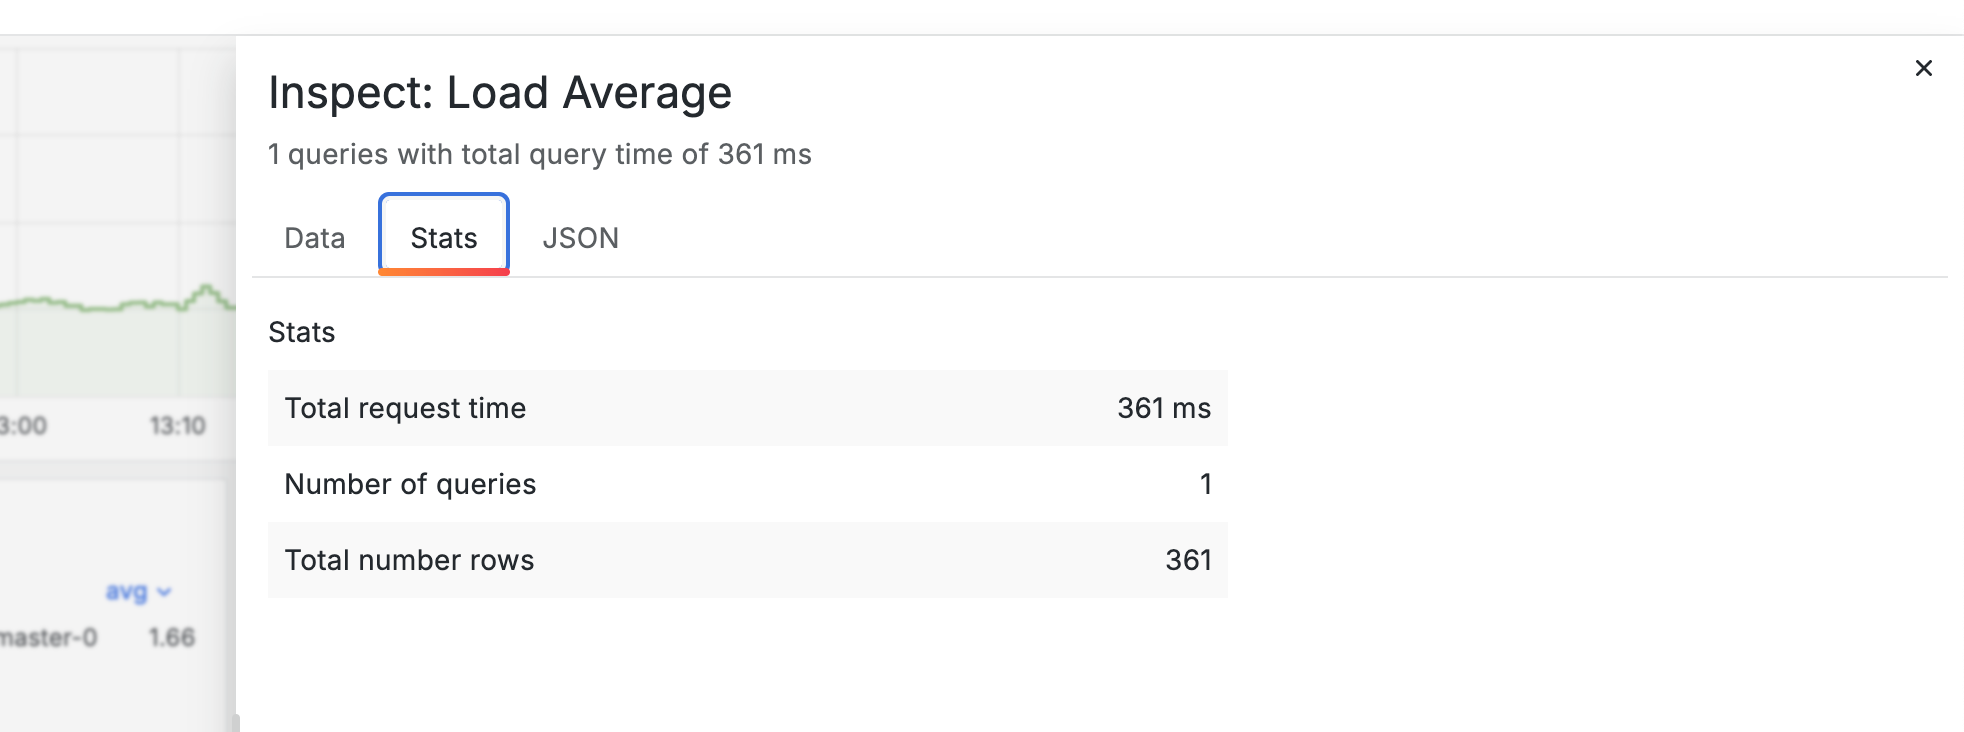
The panel displays all the data used to build the graph. You can also download it as a CSV file and view basic statistics (such as the total number of records) by switching to the Stats tab in the data panel.
Dashboard descriptions
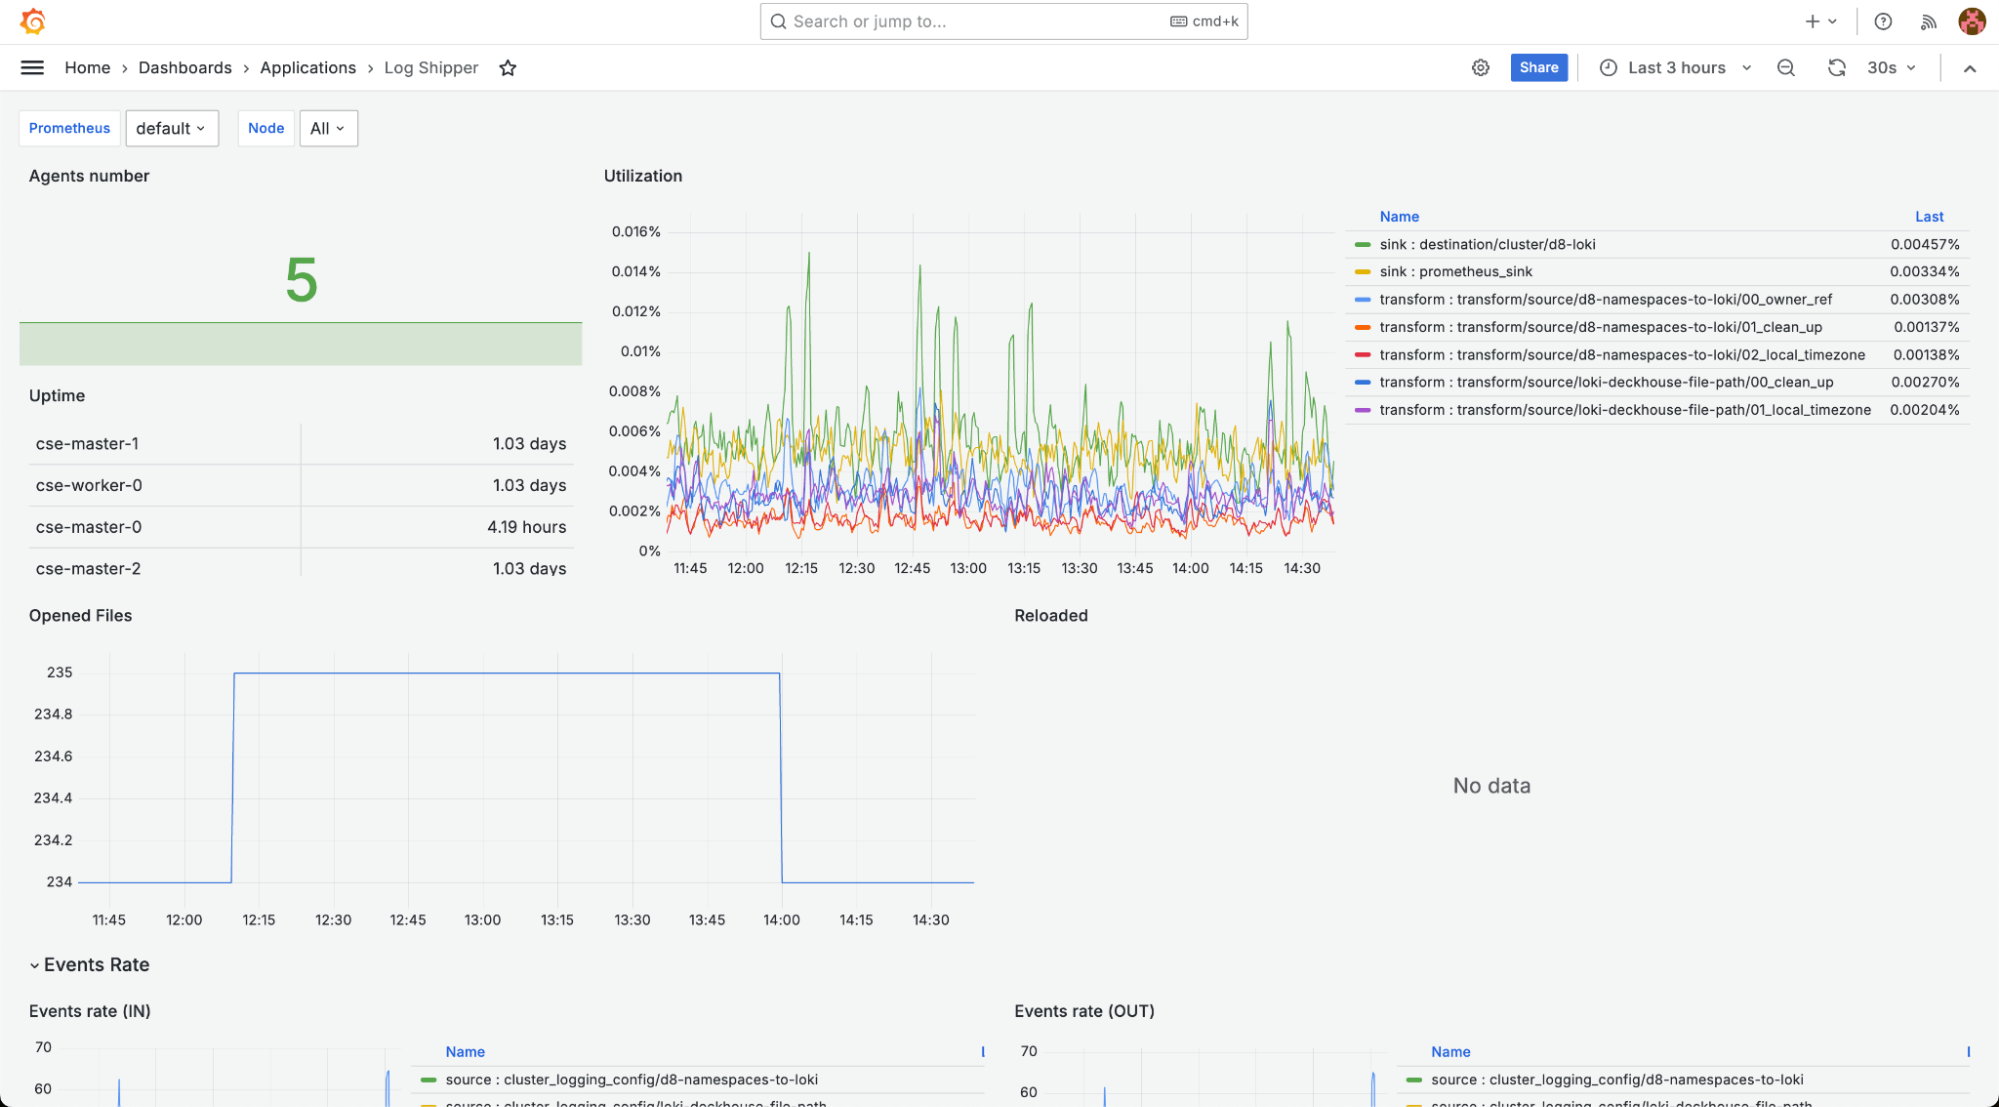
“Applications – Log Shipper” dashboard shows the status of the log-shipper module, including the number of agents running on nodes and their load.
“Applications – Loki” dashboard shows the status of the loki module.
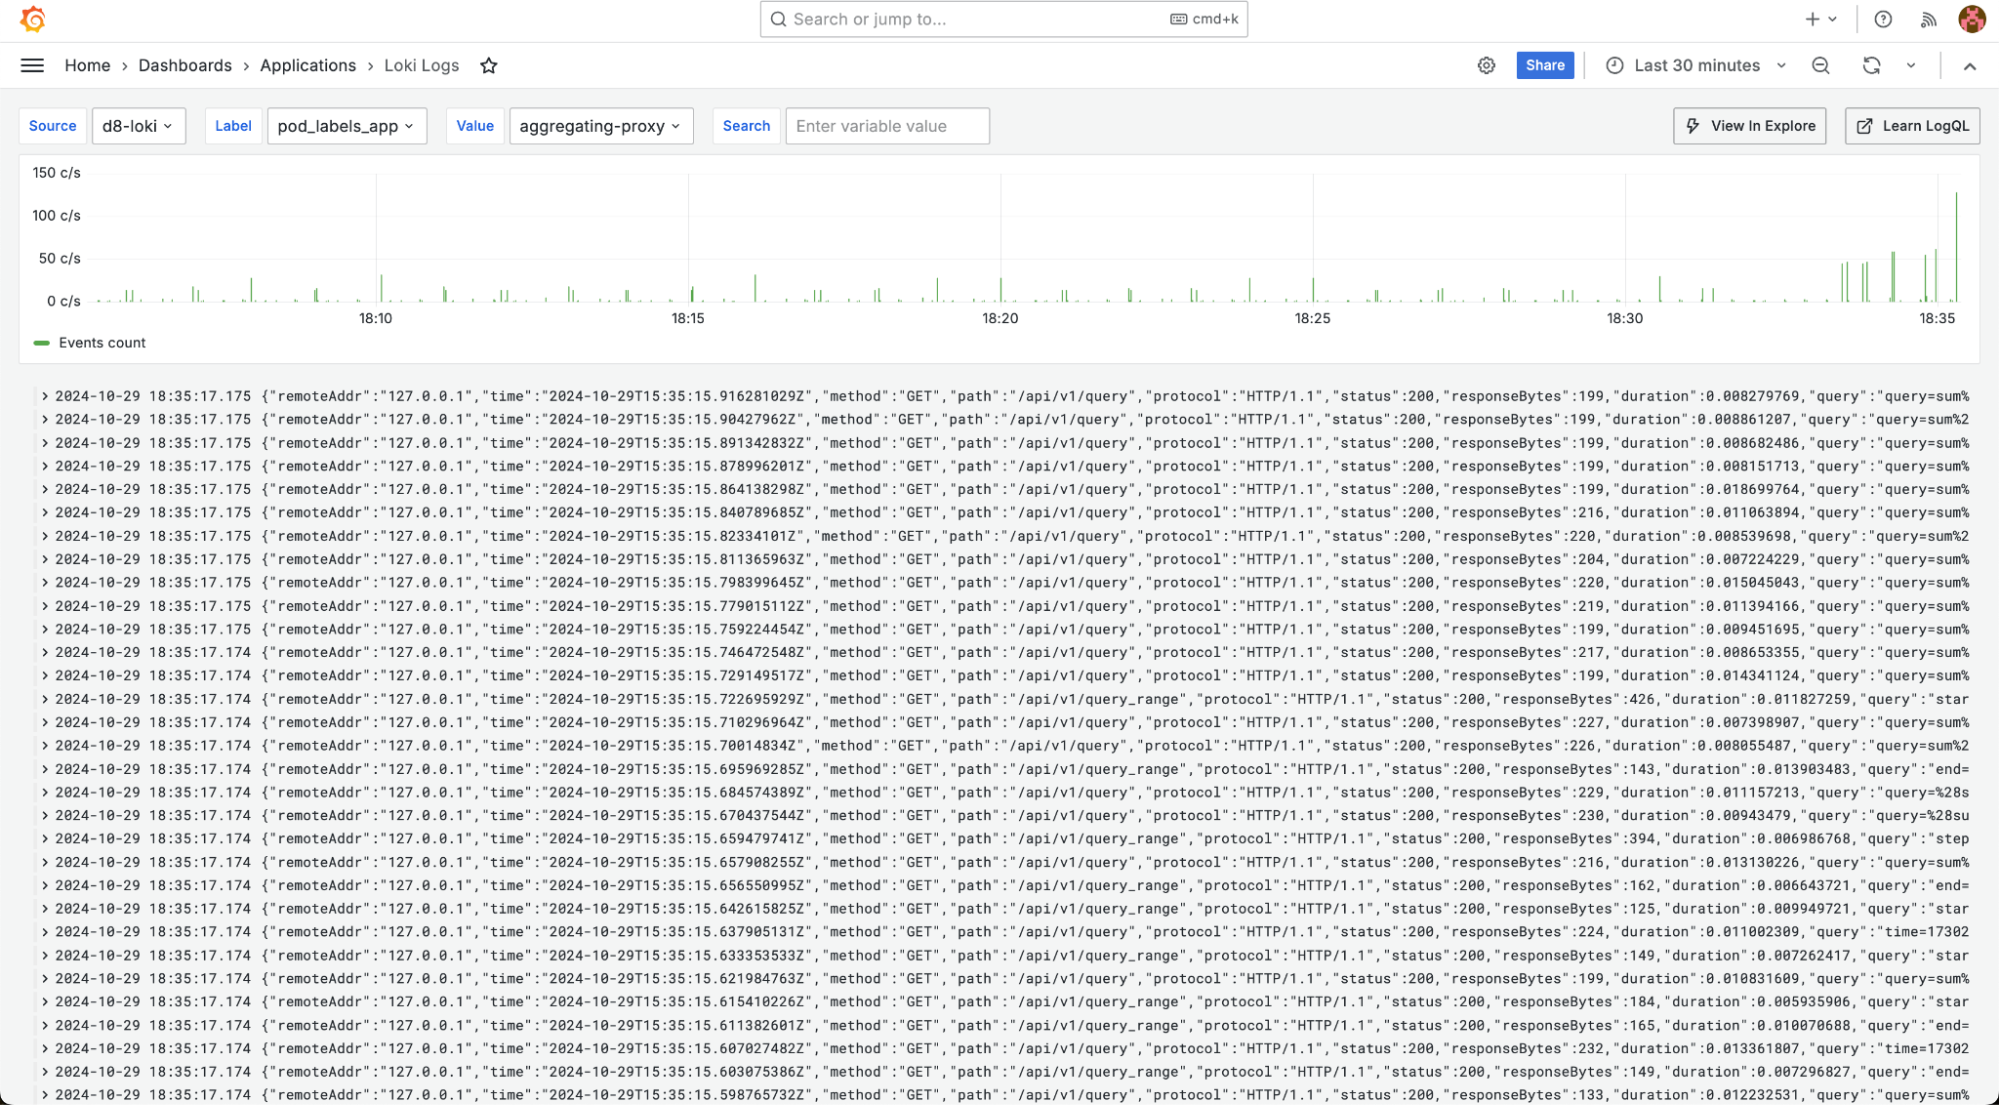
“Applications – Loki Logs” dashboard displays logs from the loki module.
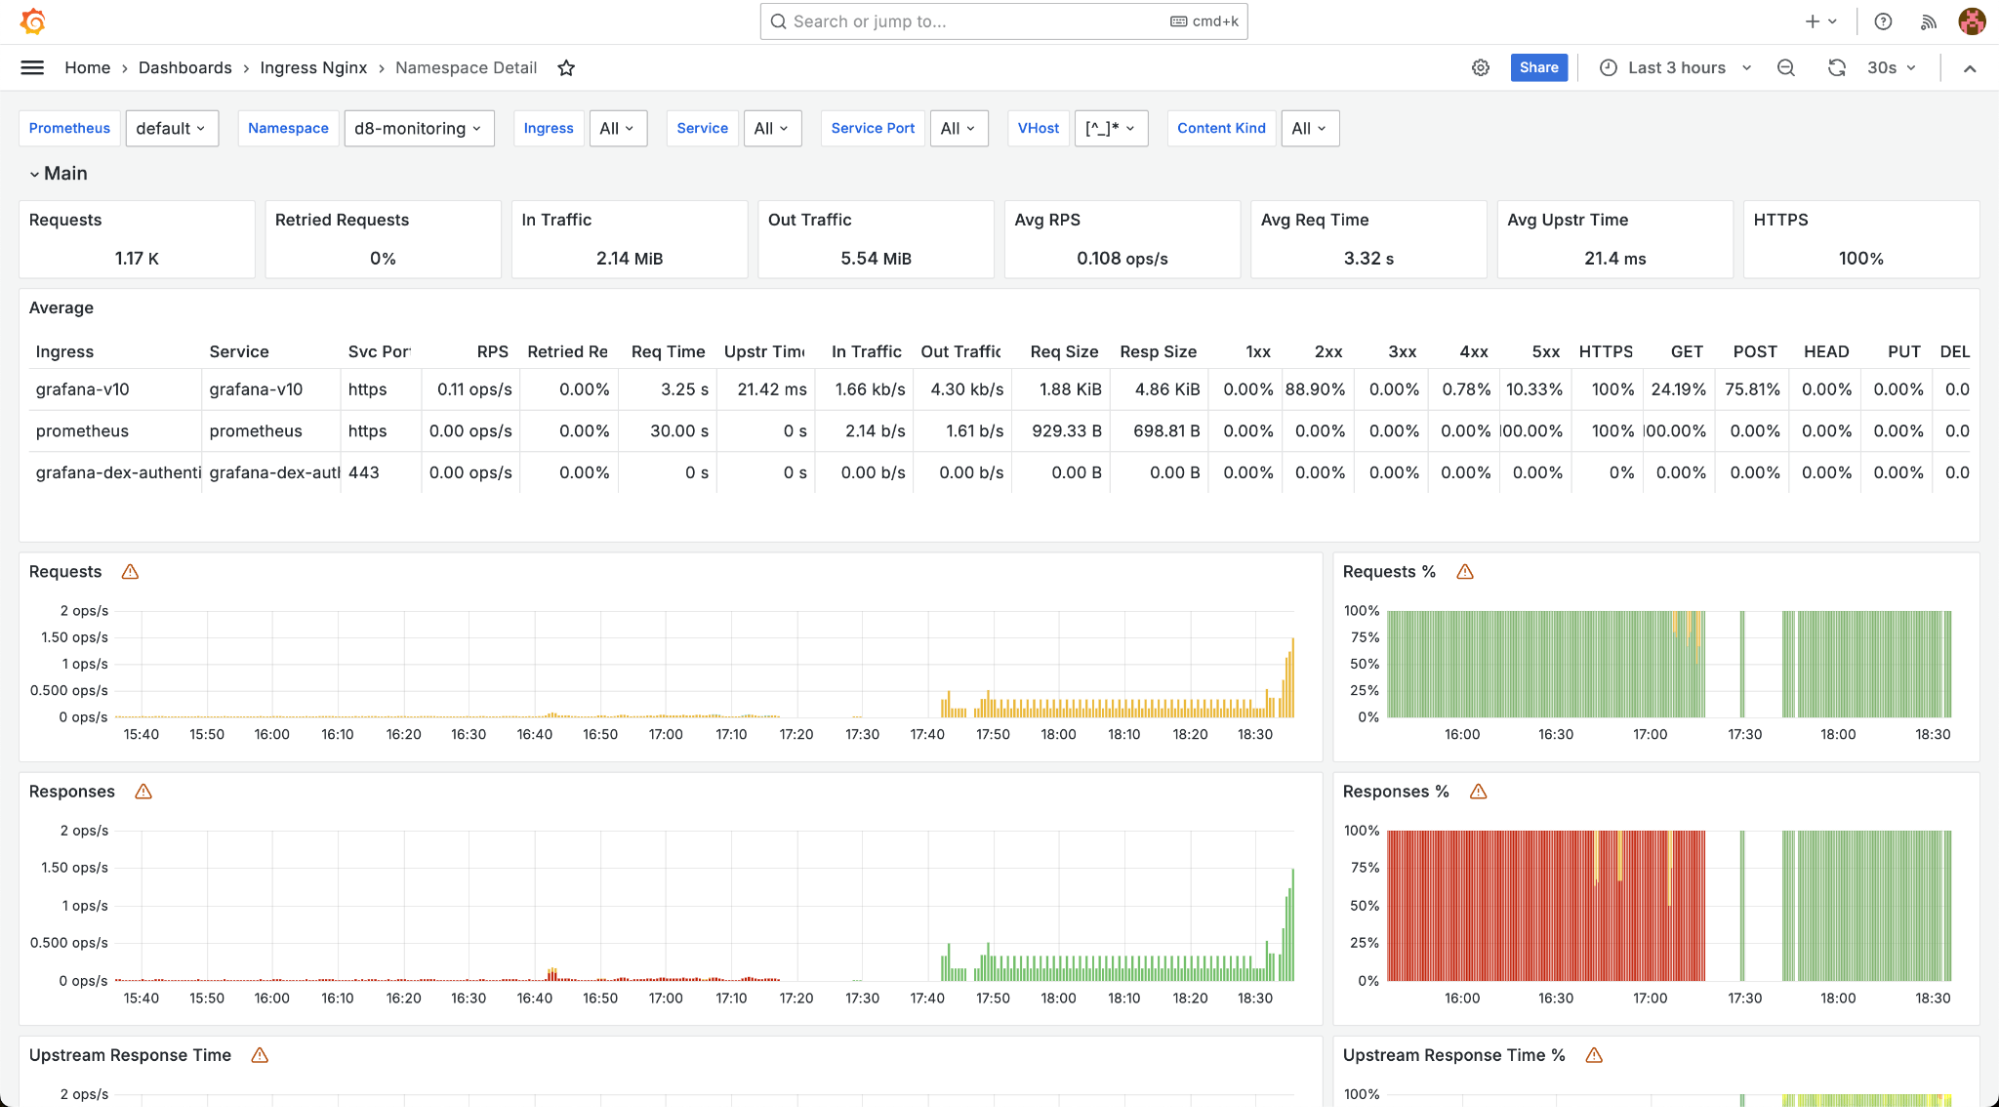
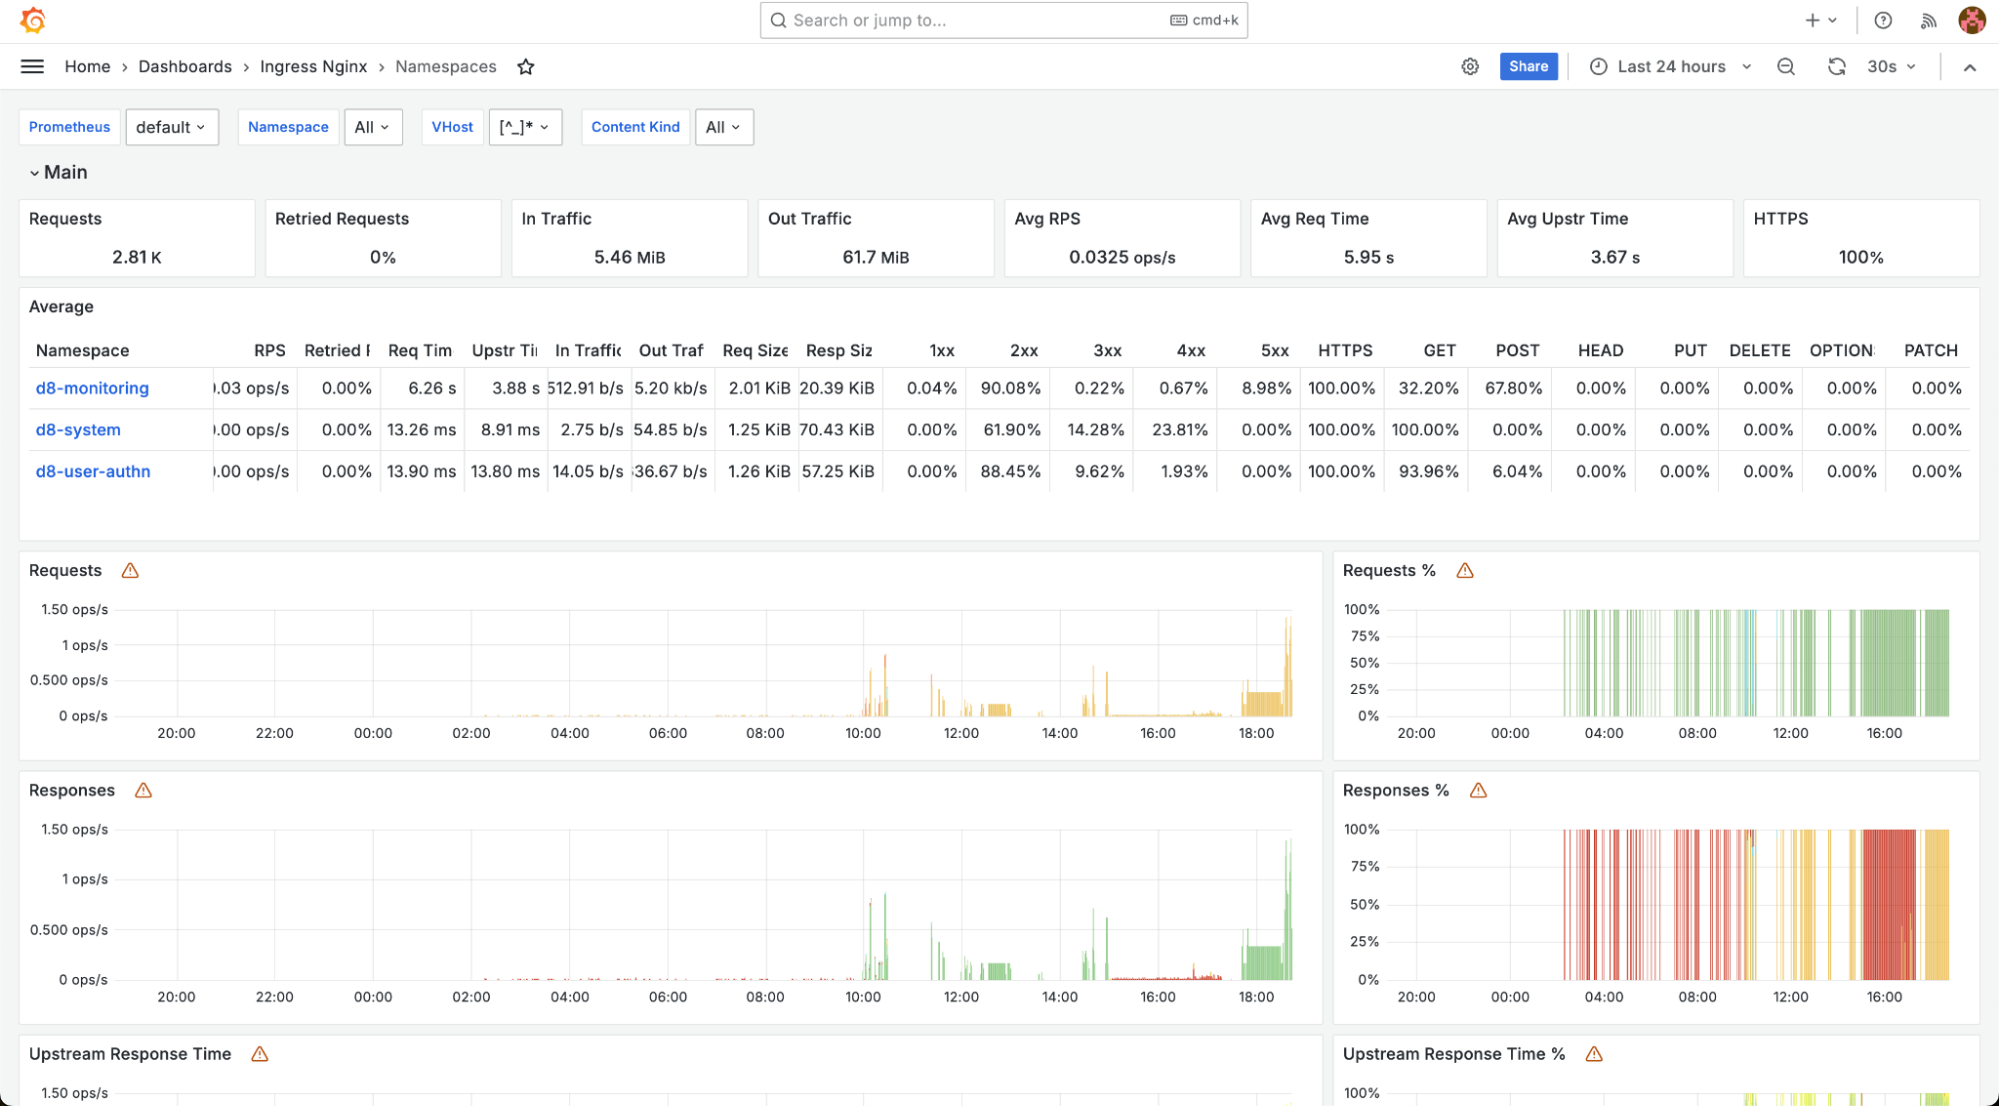
The Ingress Nginx group contains dashboards related to Ingress controllers:
-
“Namespace Detail” displays a breakdown of components within a specific namespace. You can filter by namespace, Ingress, Service, and other parameters.
-
“Namespaces” shows Ingress controller data grouped by cluster namespaces. Filters allow you to select a specific namespace, virtual hosts, and content types.
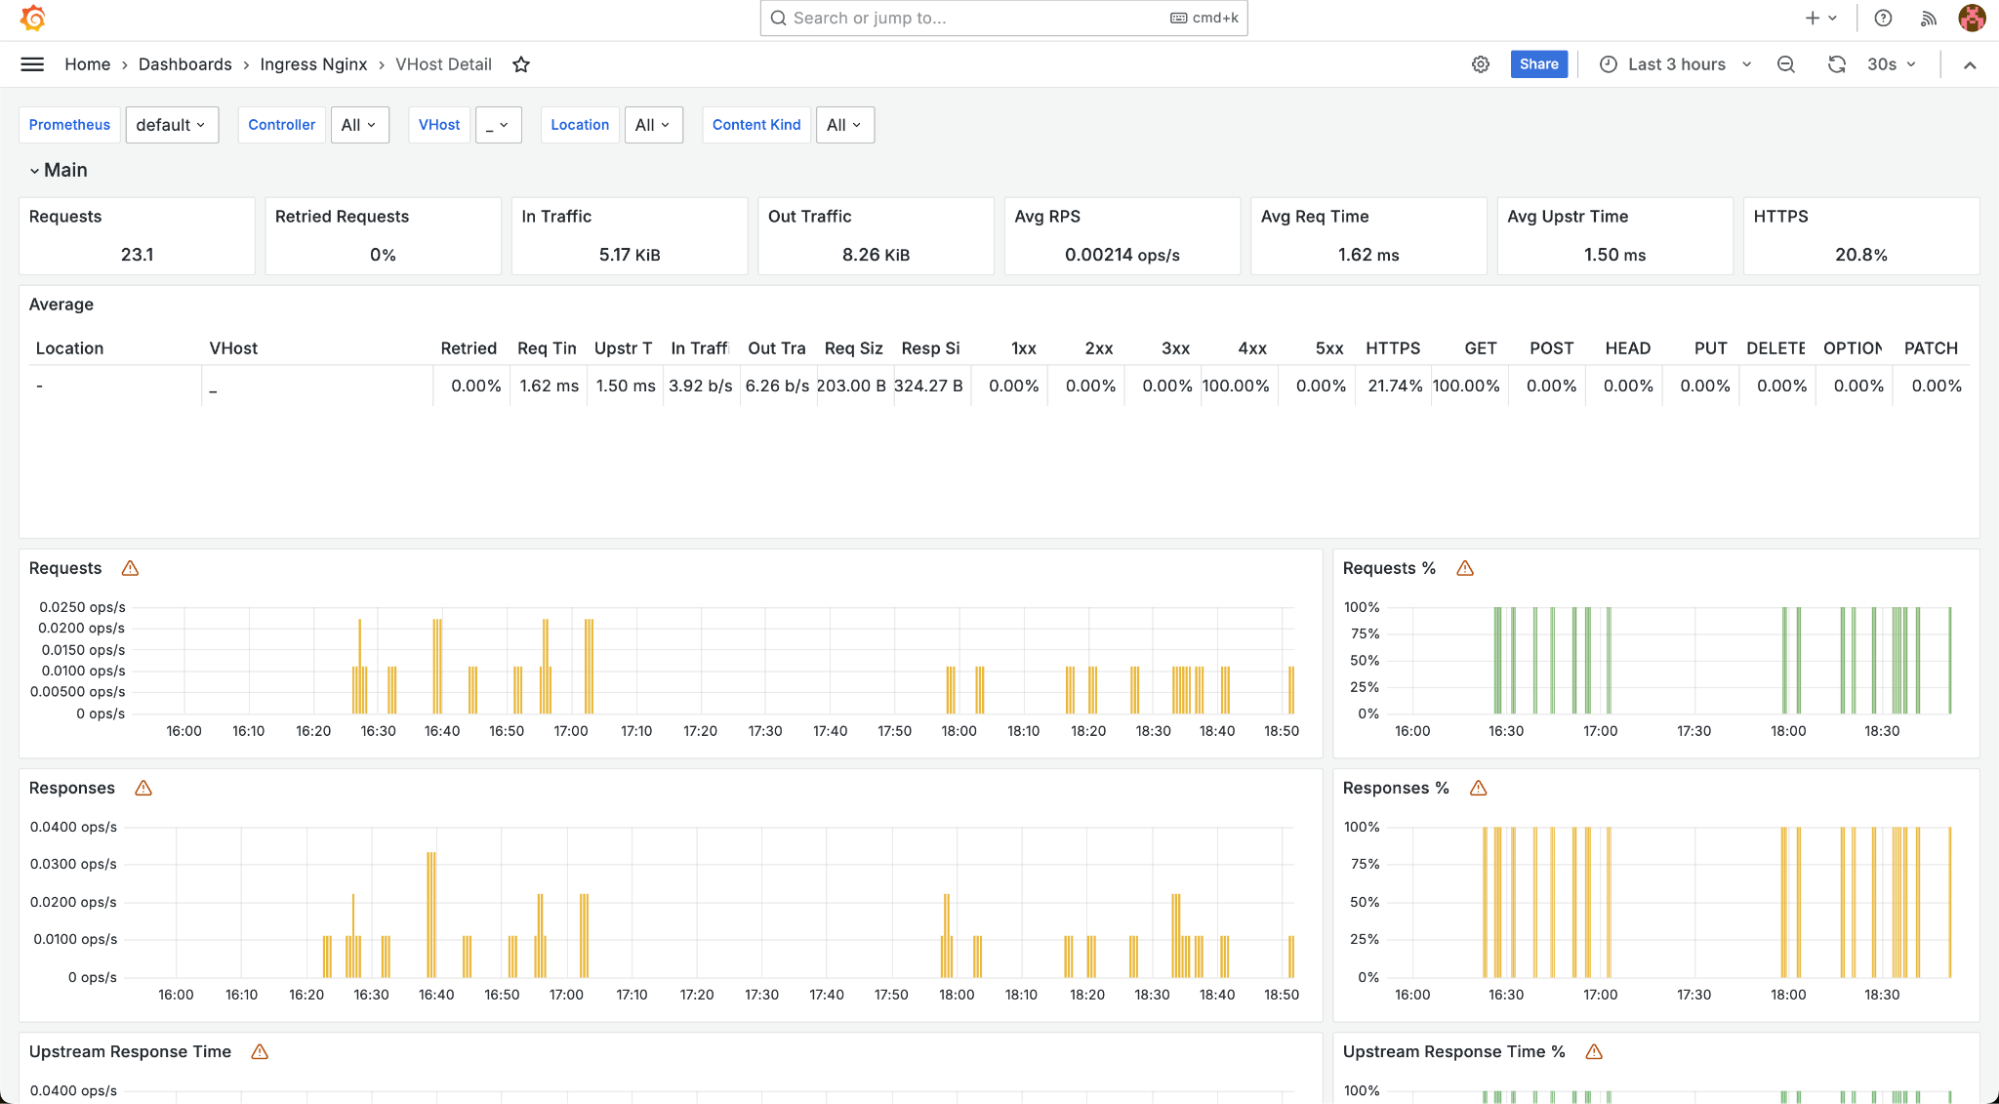
-
“VHost Detail” shows detailed information on the Ingress controller by virtual hosts.
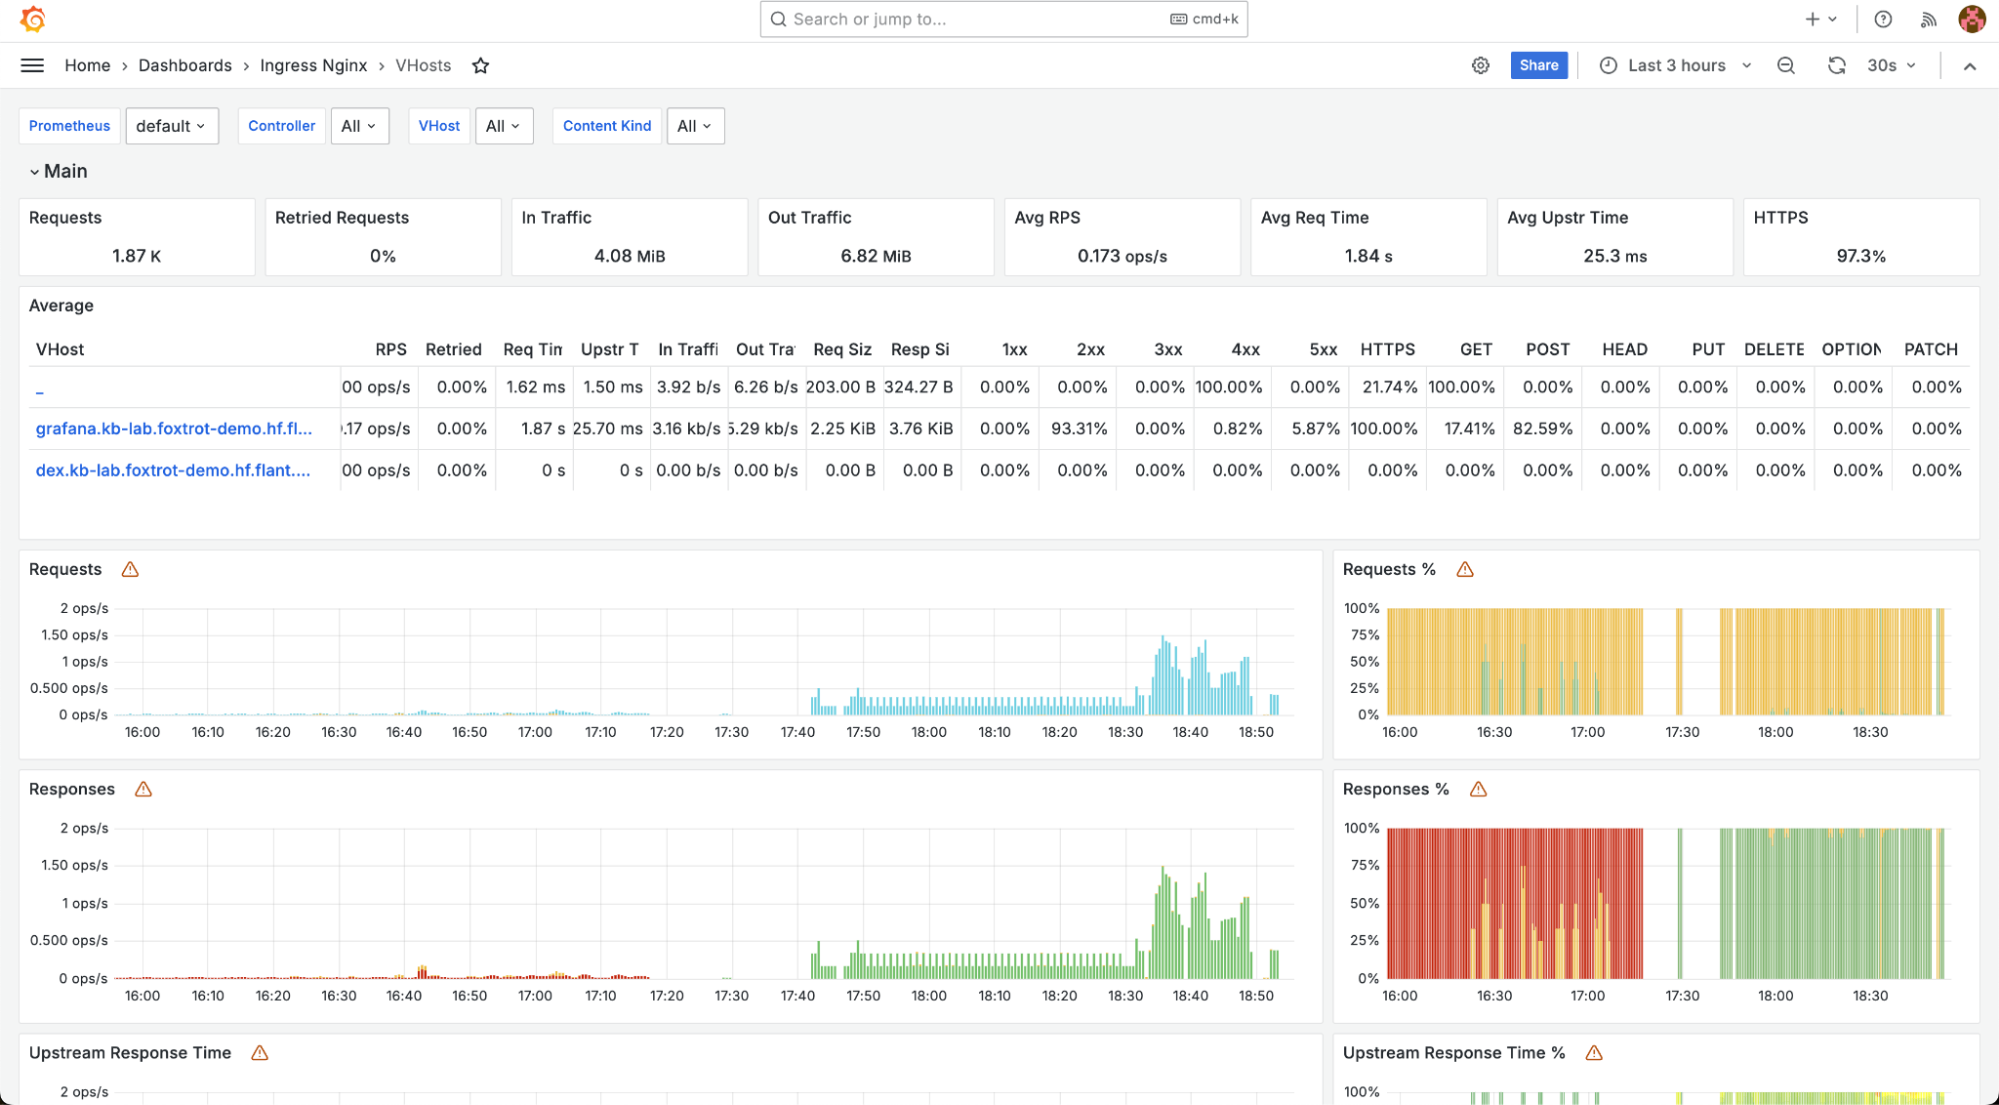
-
“VHost” displays summary data on the Ingress controller by virtual hosts. You can filter by a specific virtual host.
The Kubernetes Cluster group contains dashboards related to the Kubernetes cluster:
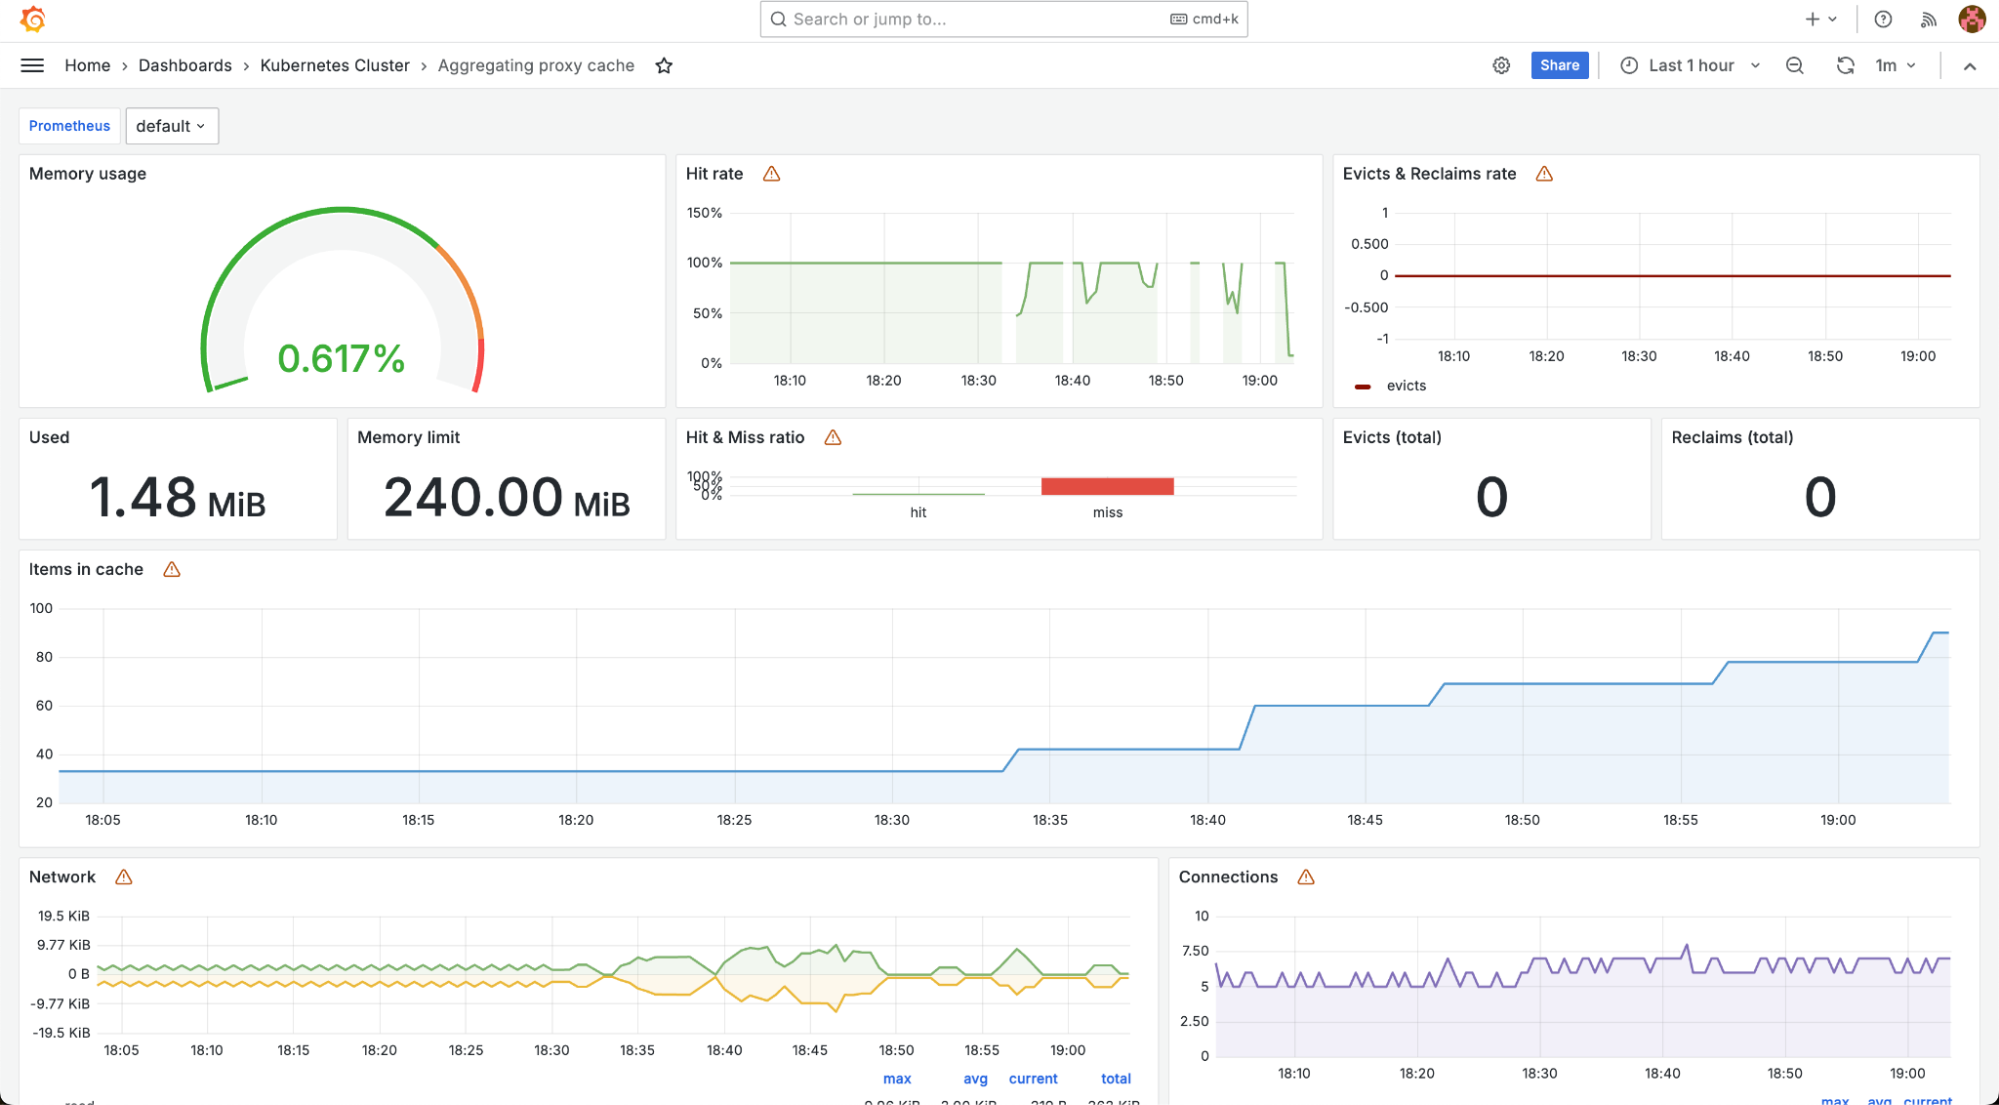
-
“Aggregating Proxy Cache” displays a summary of the resources consumed by the proxy server.
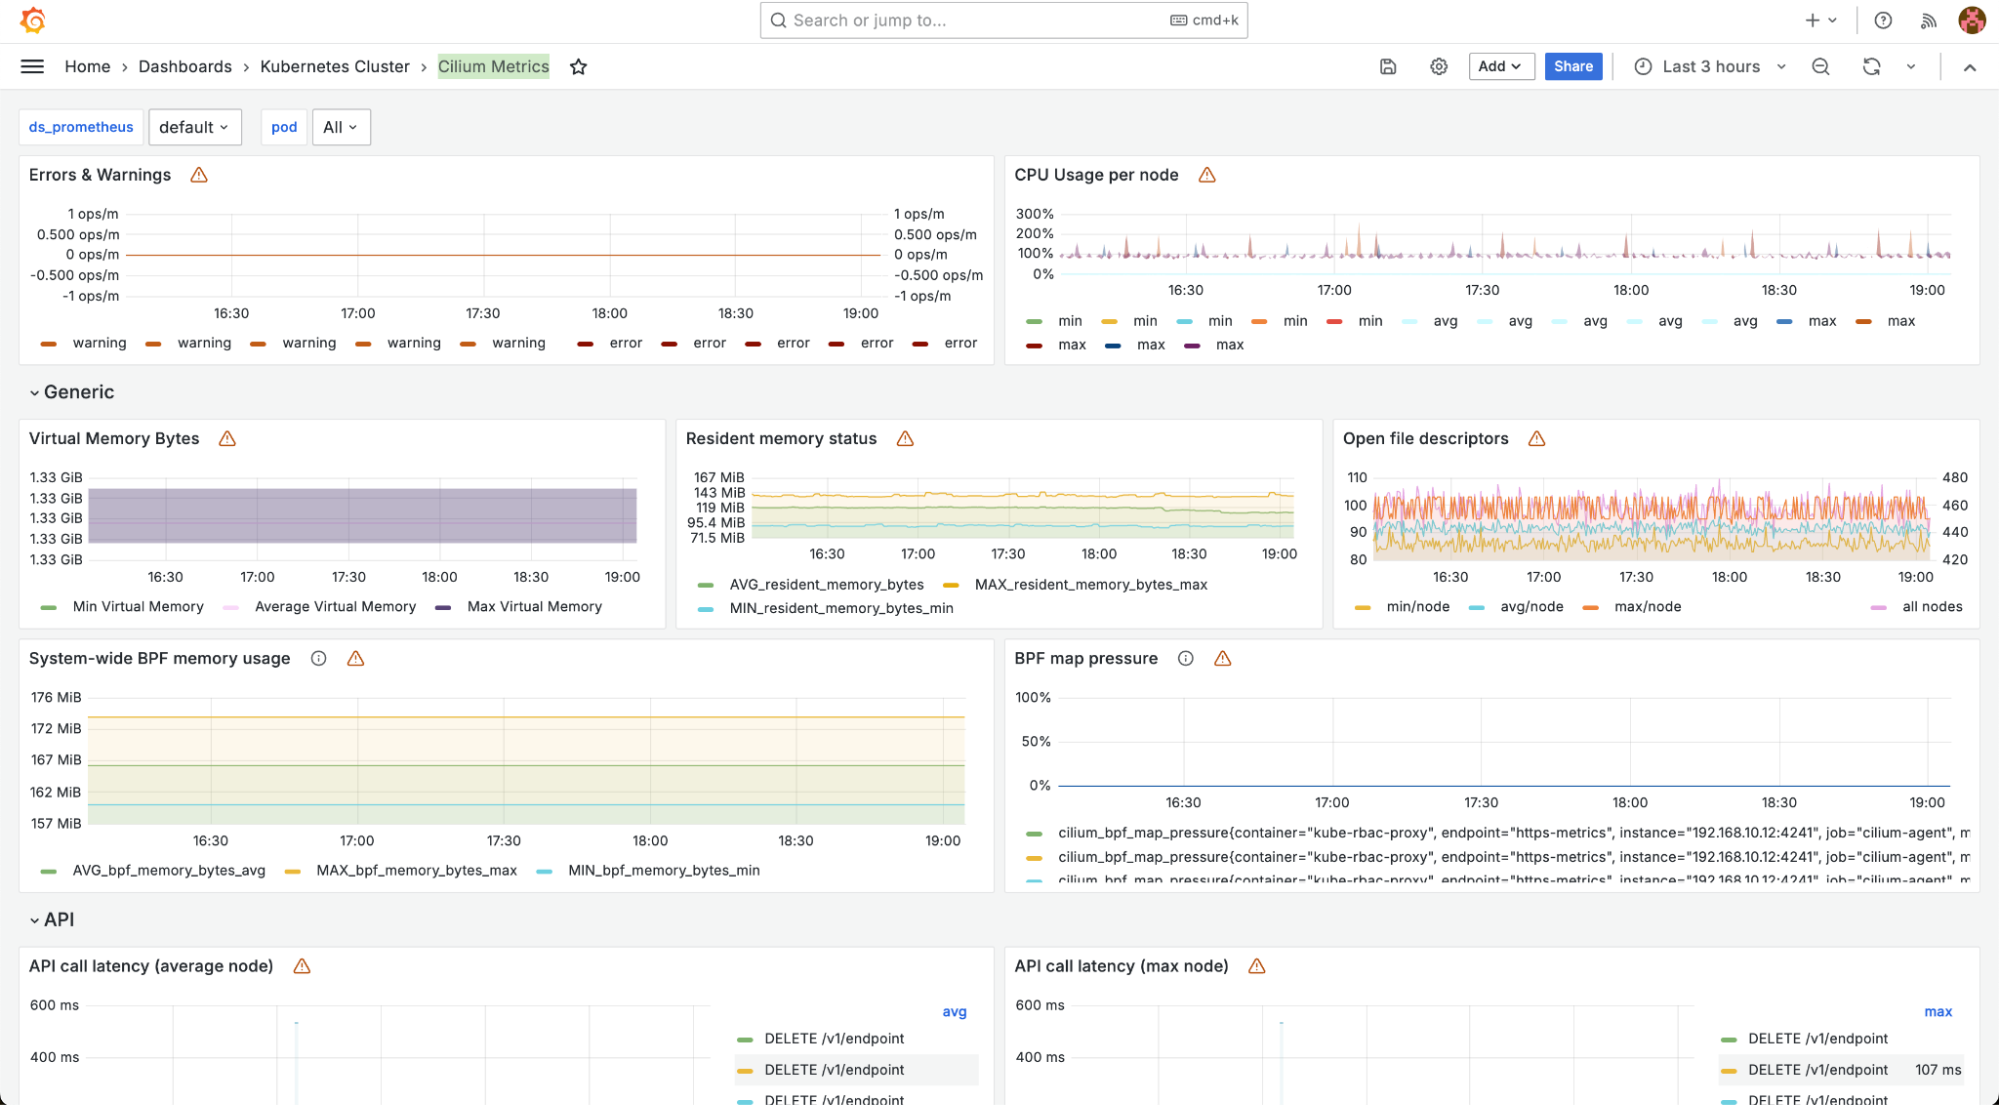
-
“Cilium Metrics” displays metrics from the cni-cilium module.
-
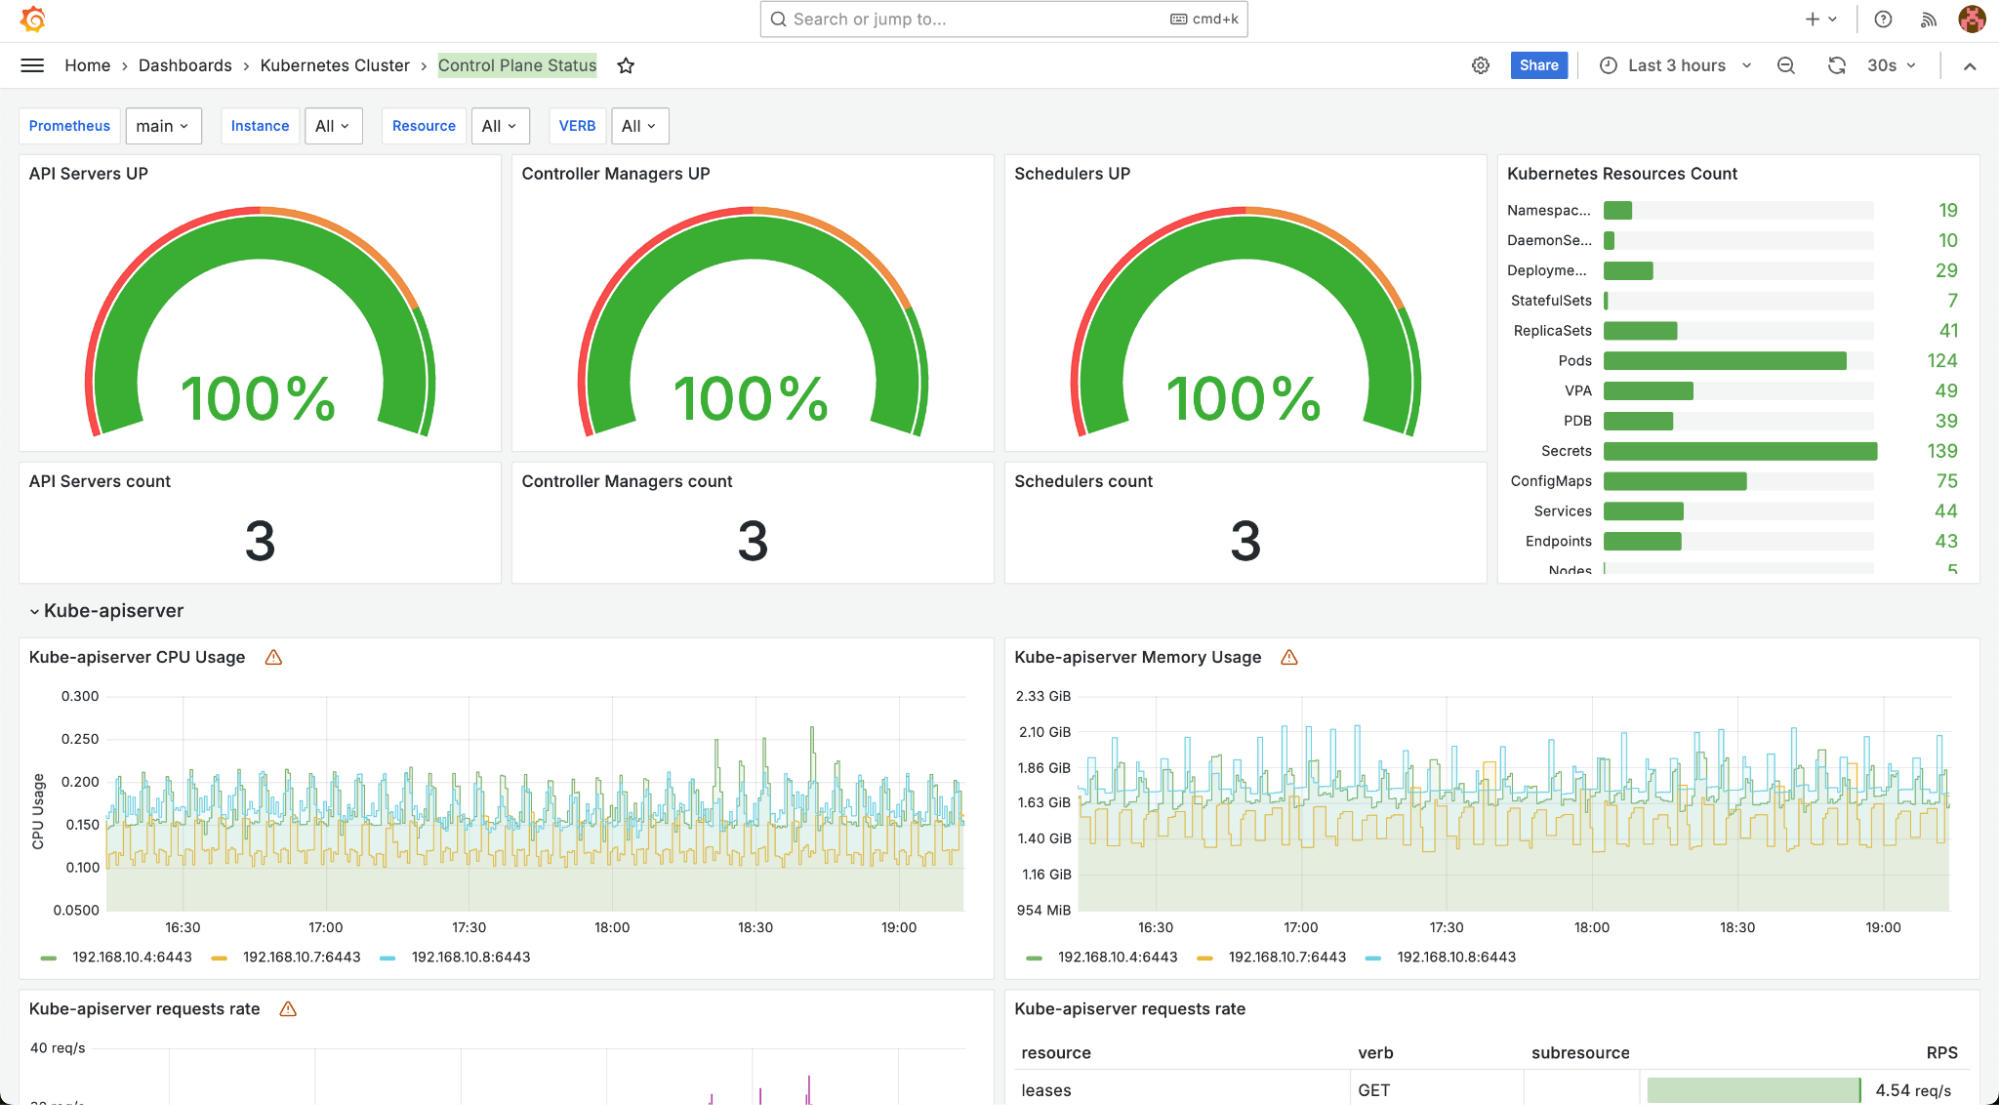
“Control Plane Status” shows the status of the cluster control plane.
-
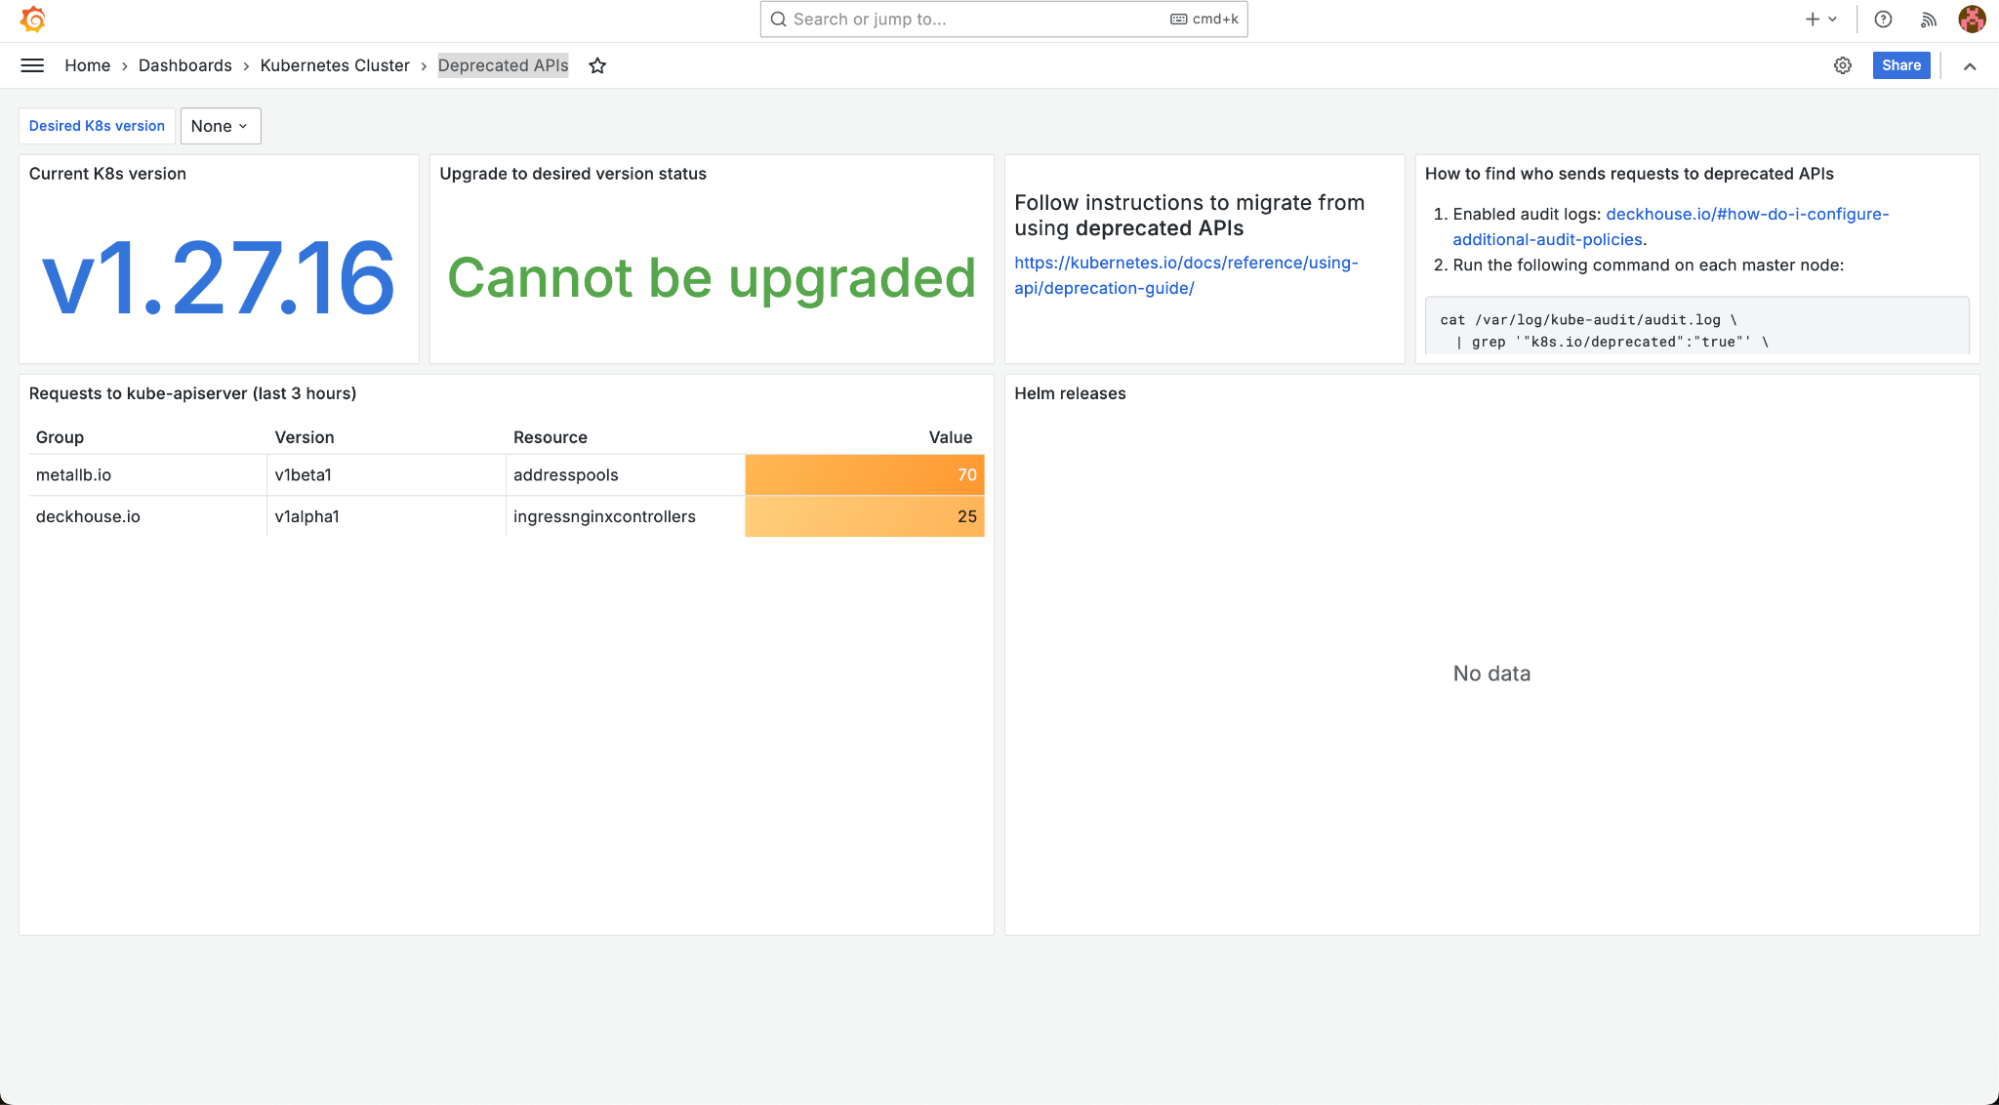
“Deprecated APIs” displays the state of Kubernetes APIs that are currently deprecated. The dashboard also includes migration instructions and requests made to these API endpoints.
-
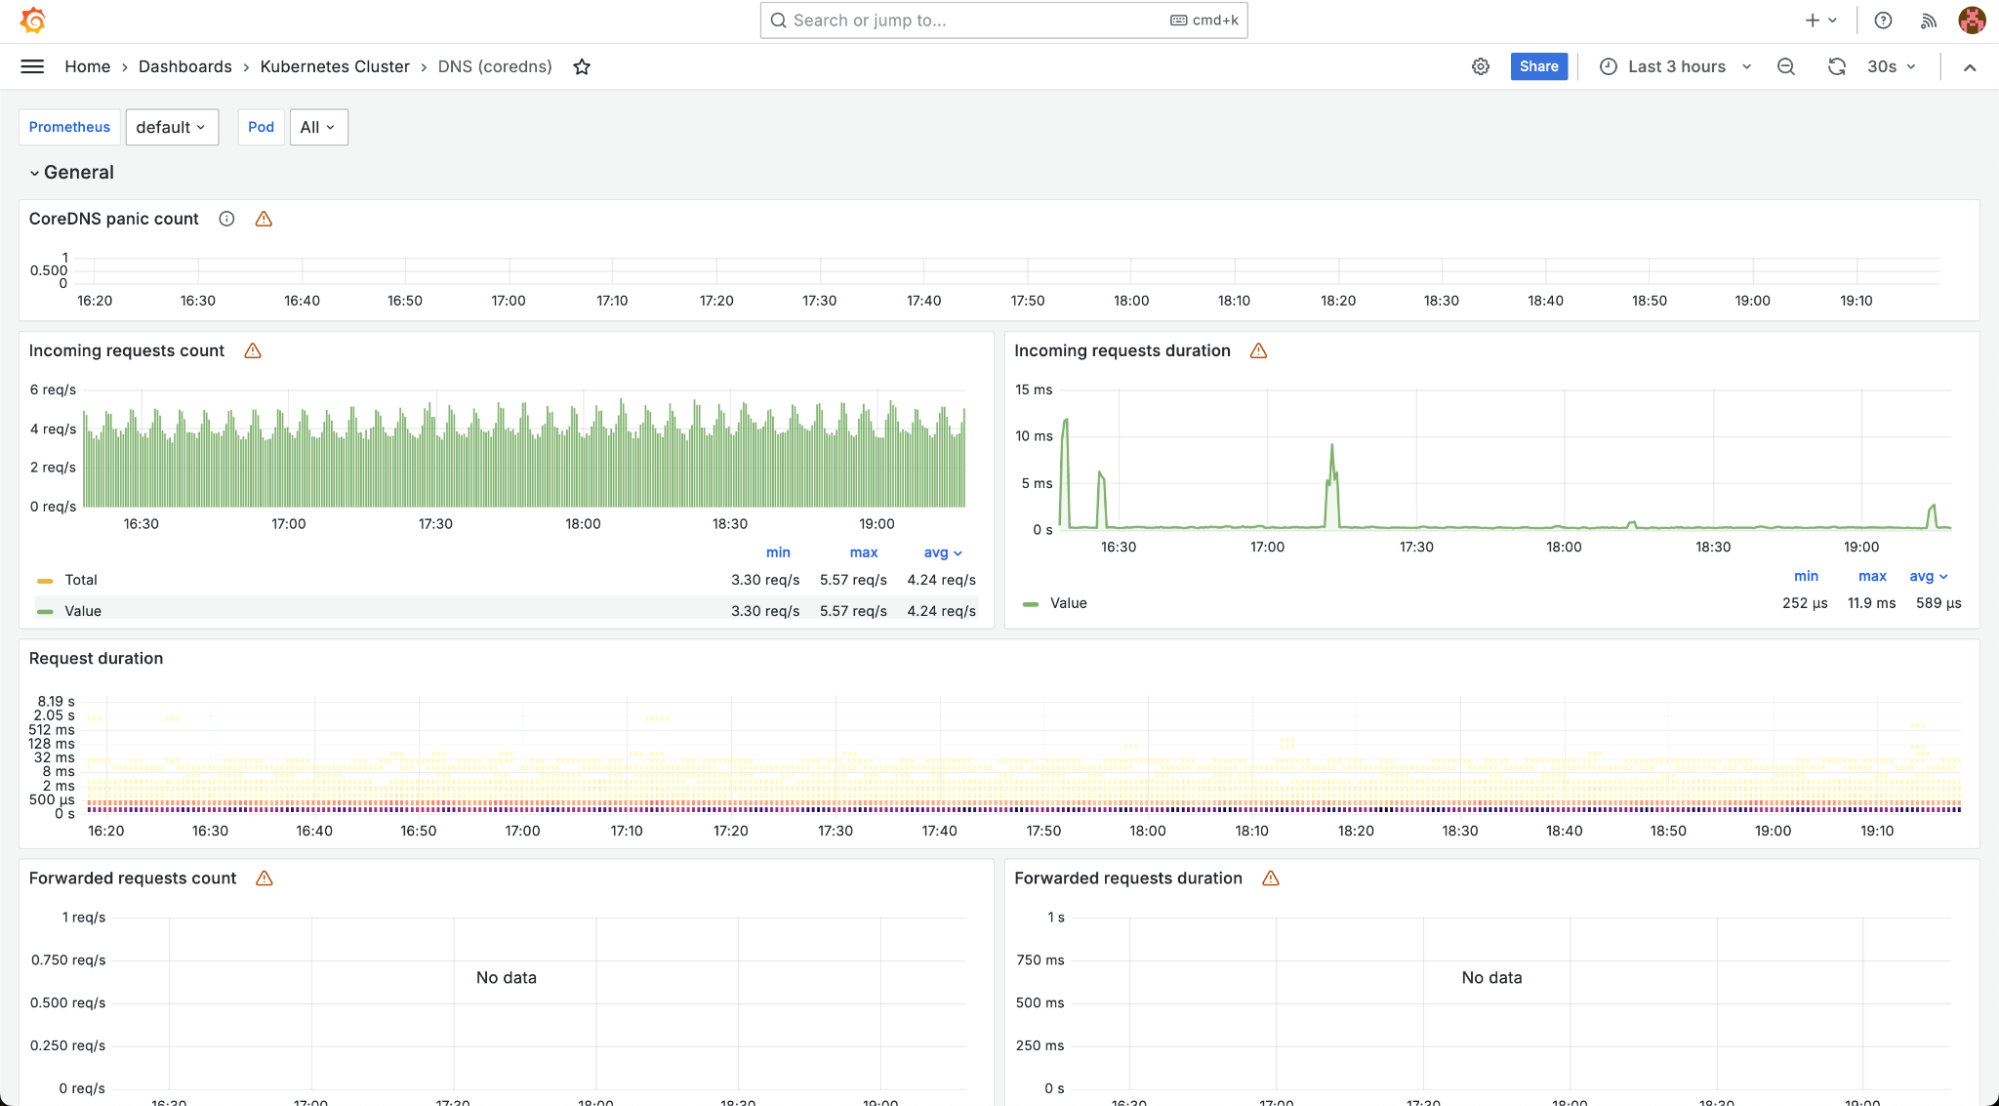
“DNS (coredns)” dashboard displays data on the operation of the CoreDNS component.
-
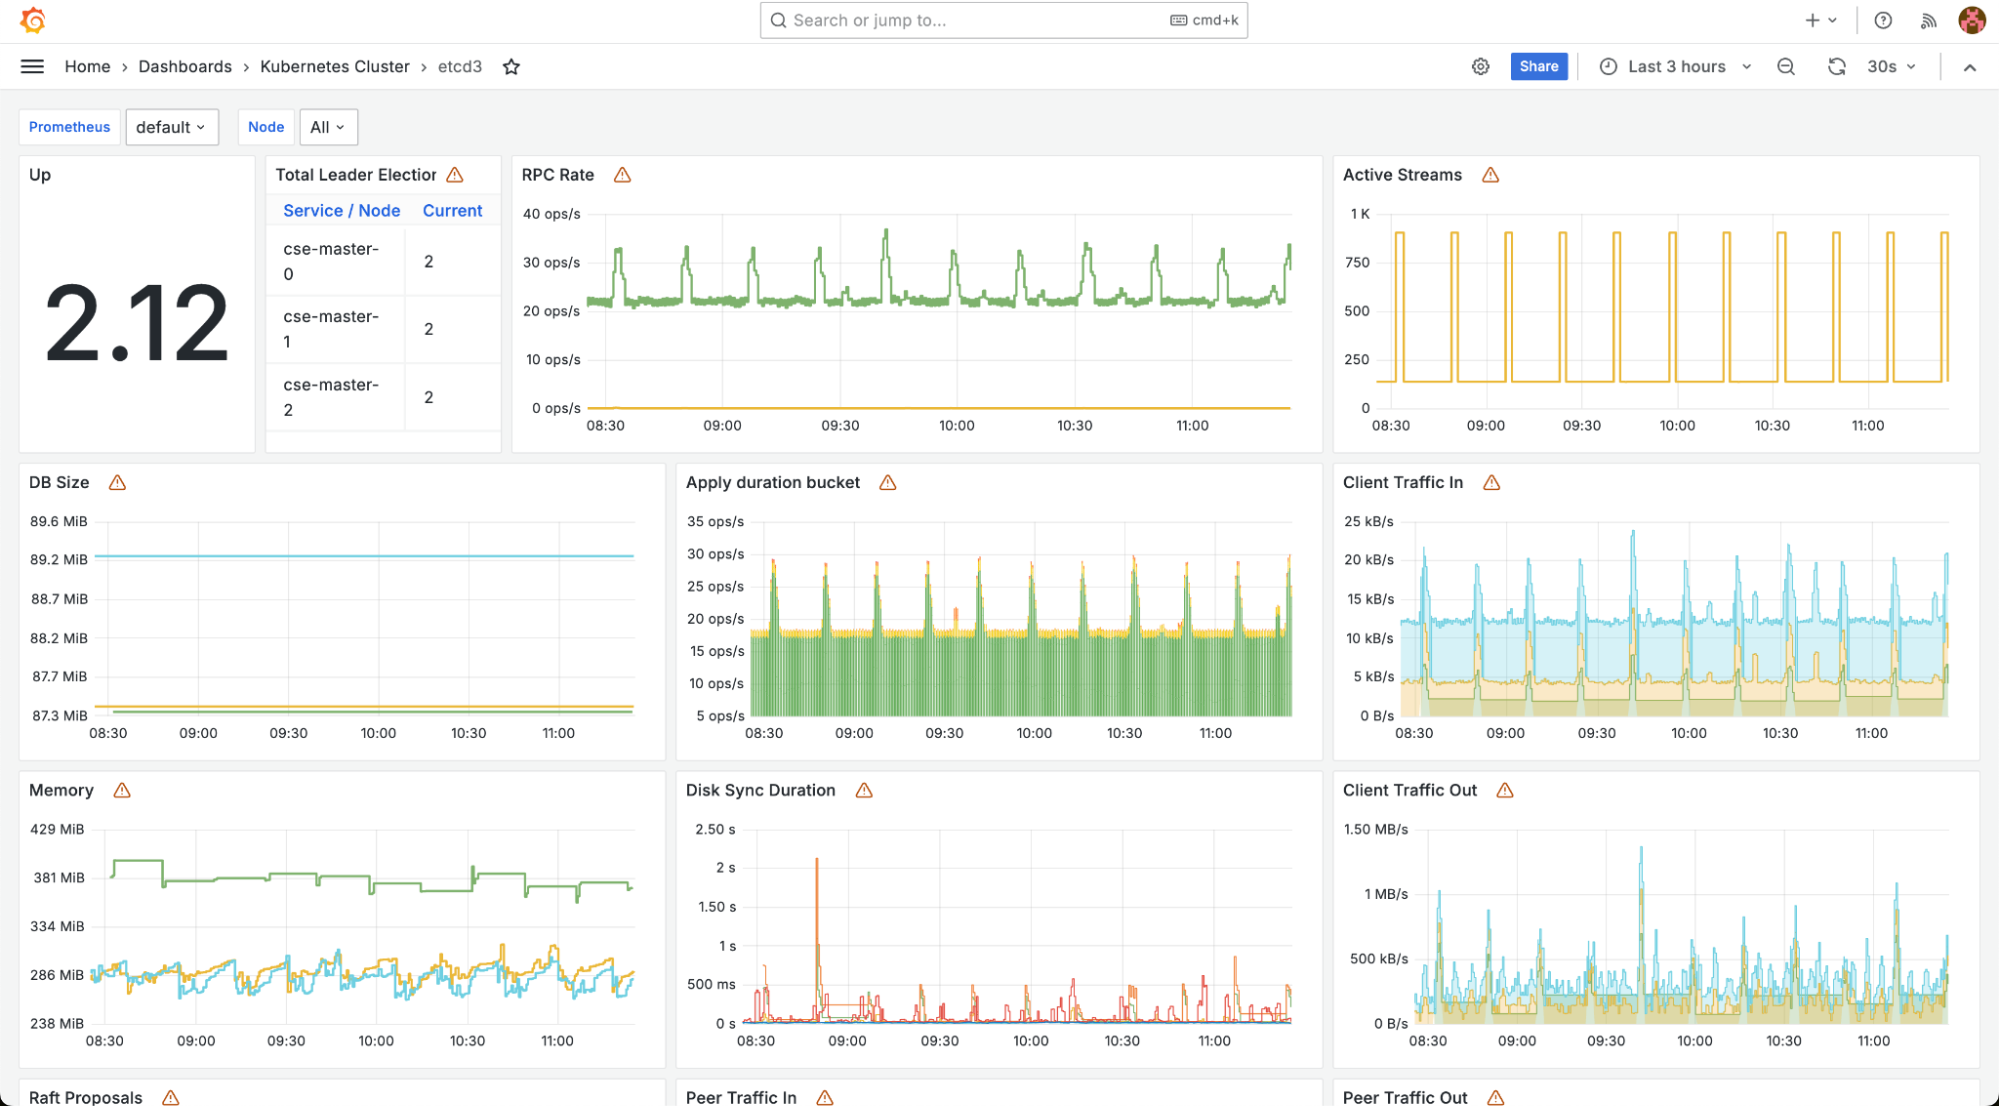
“etcd3” dashboard shows the status of the etcd database.
-
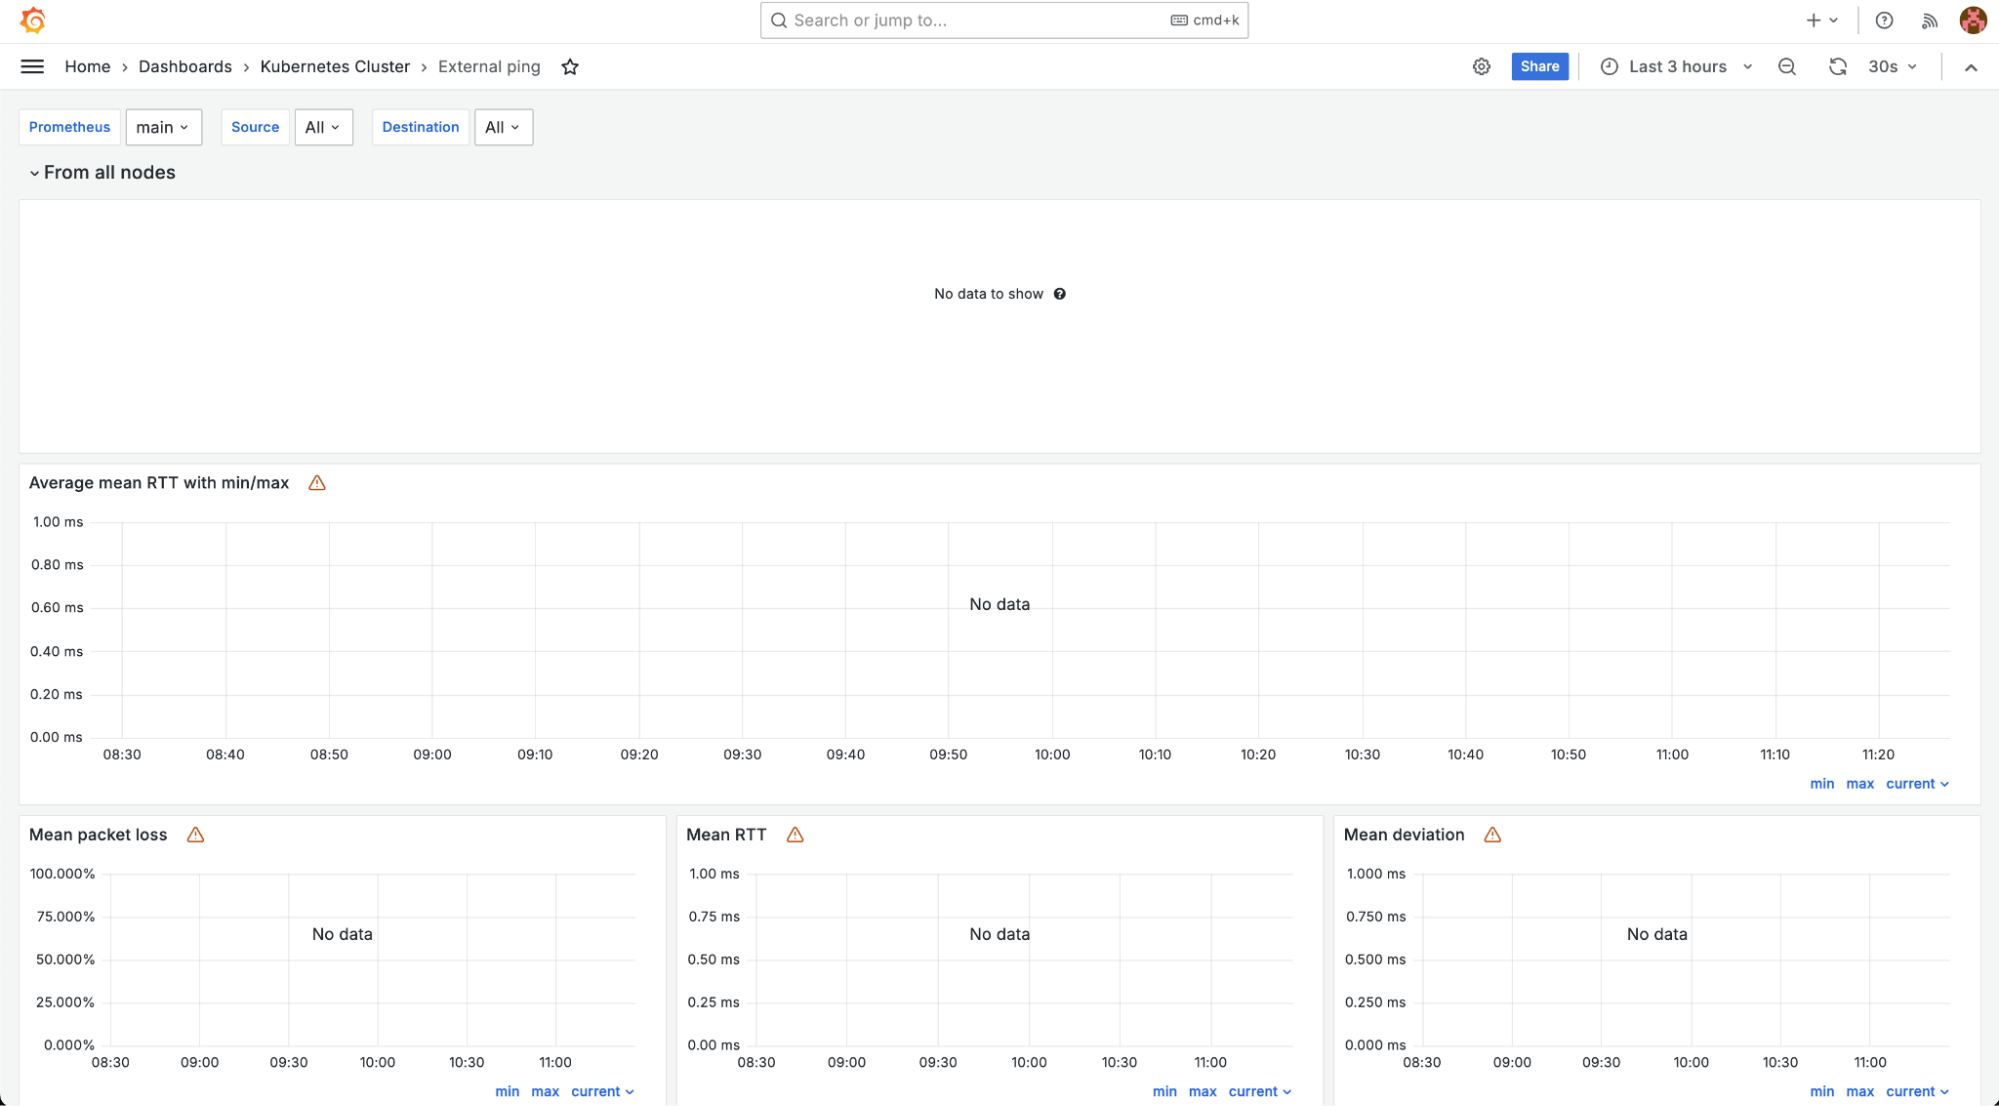
“External ping” dashboard provides statistics on external requests.
-
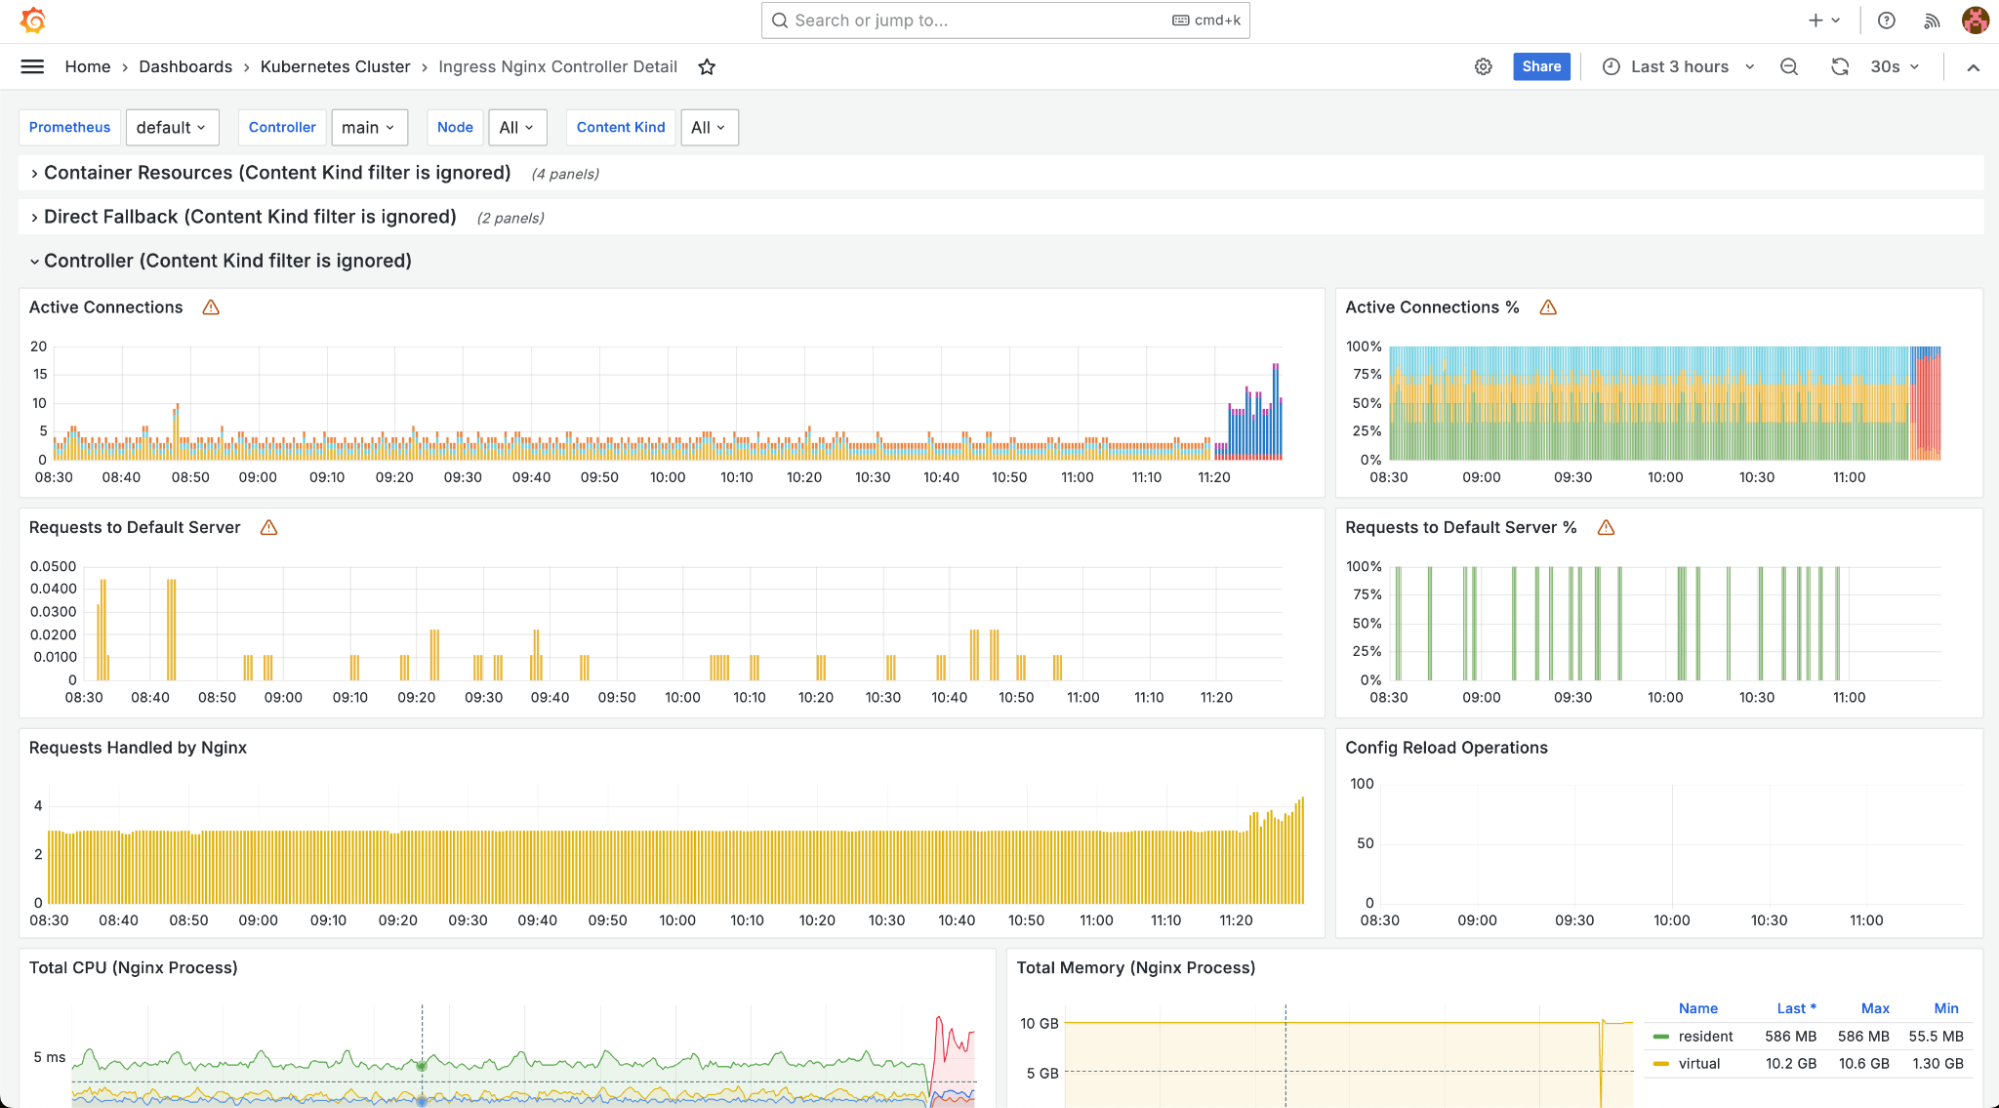
“Ingress Nginx Controller Detail” dashboard displays parameters of the Ingress controller.
-
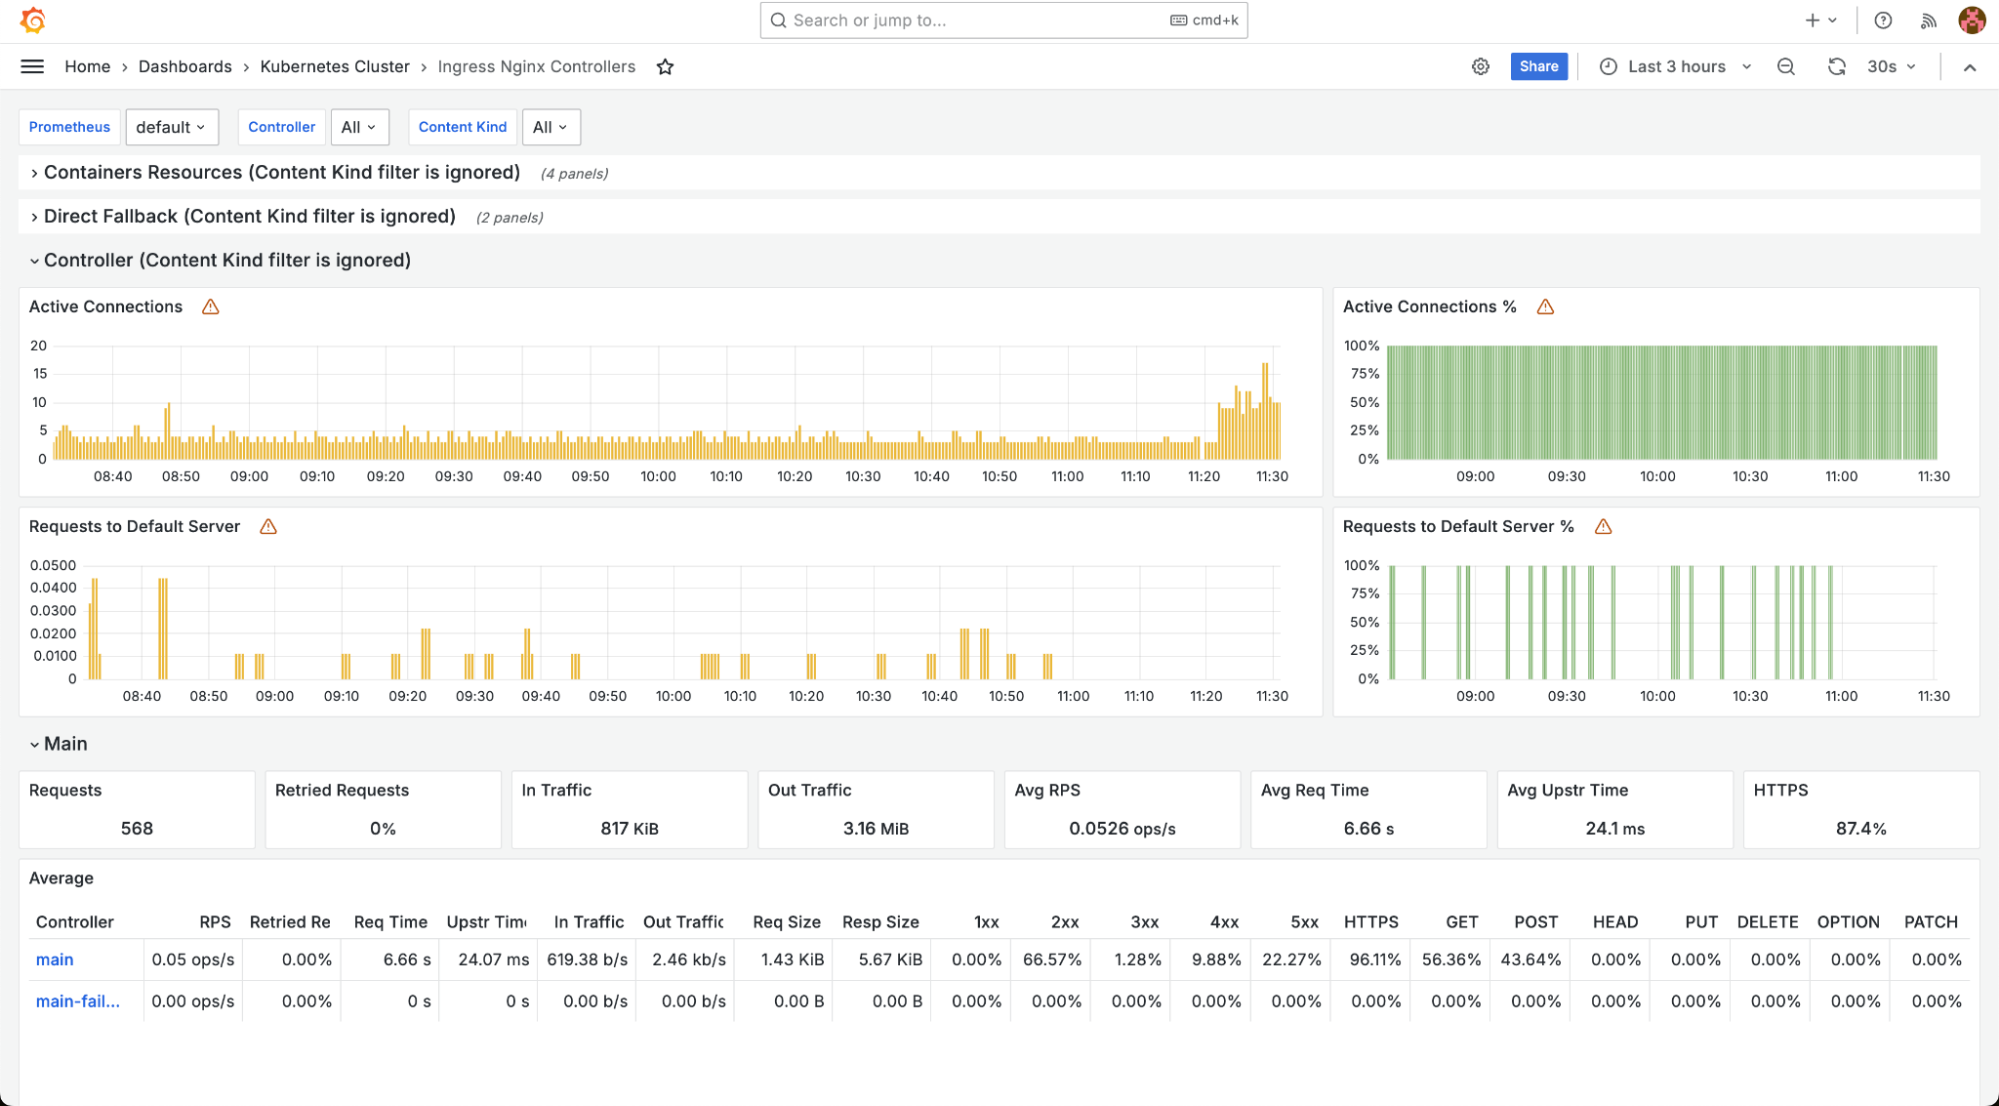
“Ingress Nginx Controllers” dashboard shows detailed data on the cluster’s Ingress controllers.
-
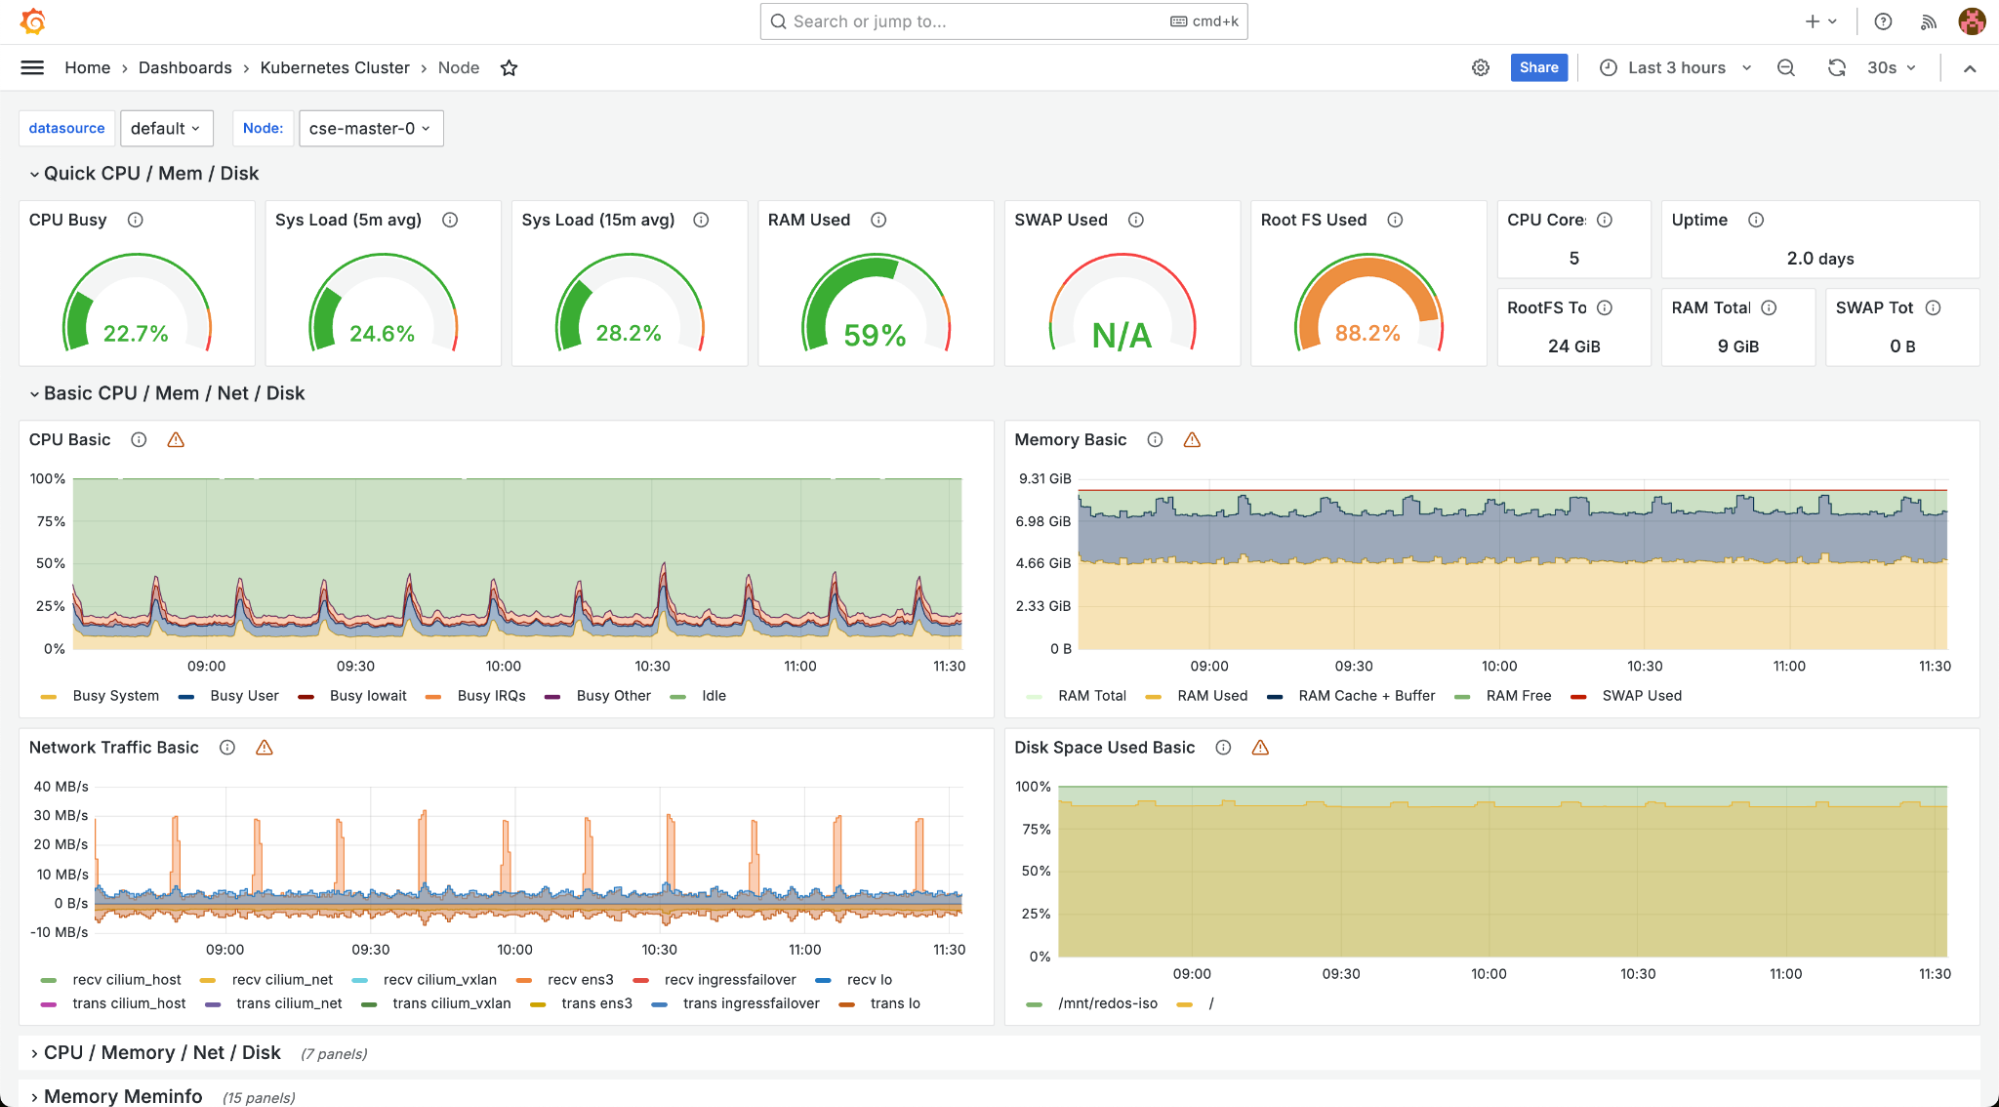
“Node” dashboard displays information about individual node performance. You can select a specific node in the filters.
-
“Nodes” dashboard shows aggregated data on all cluster nodes. The filters let you select a specific node.
-
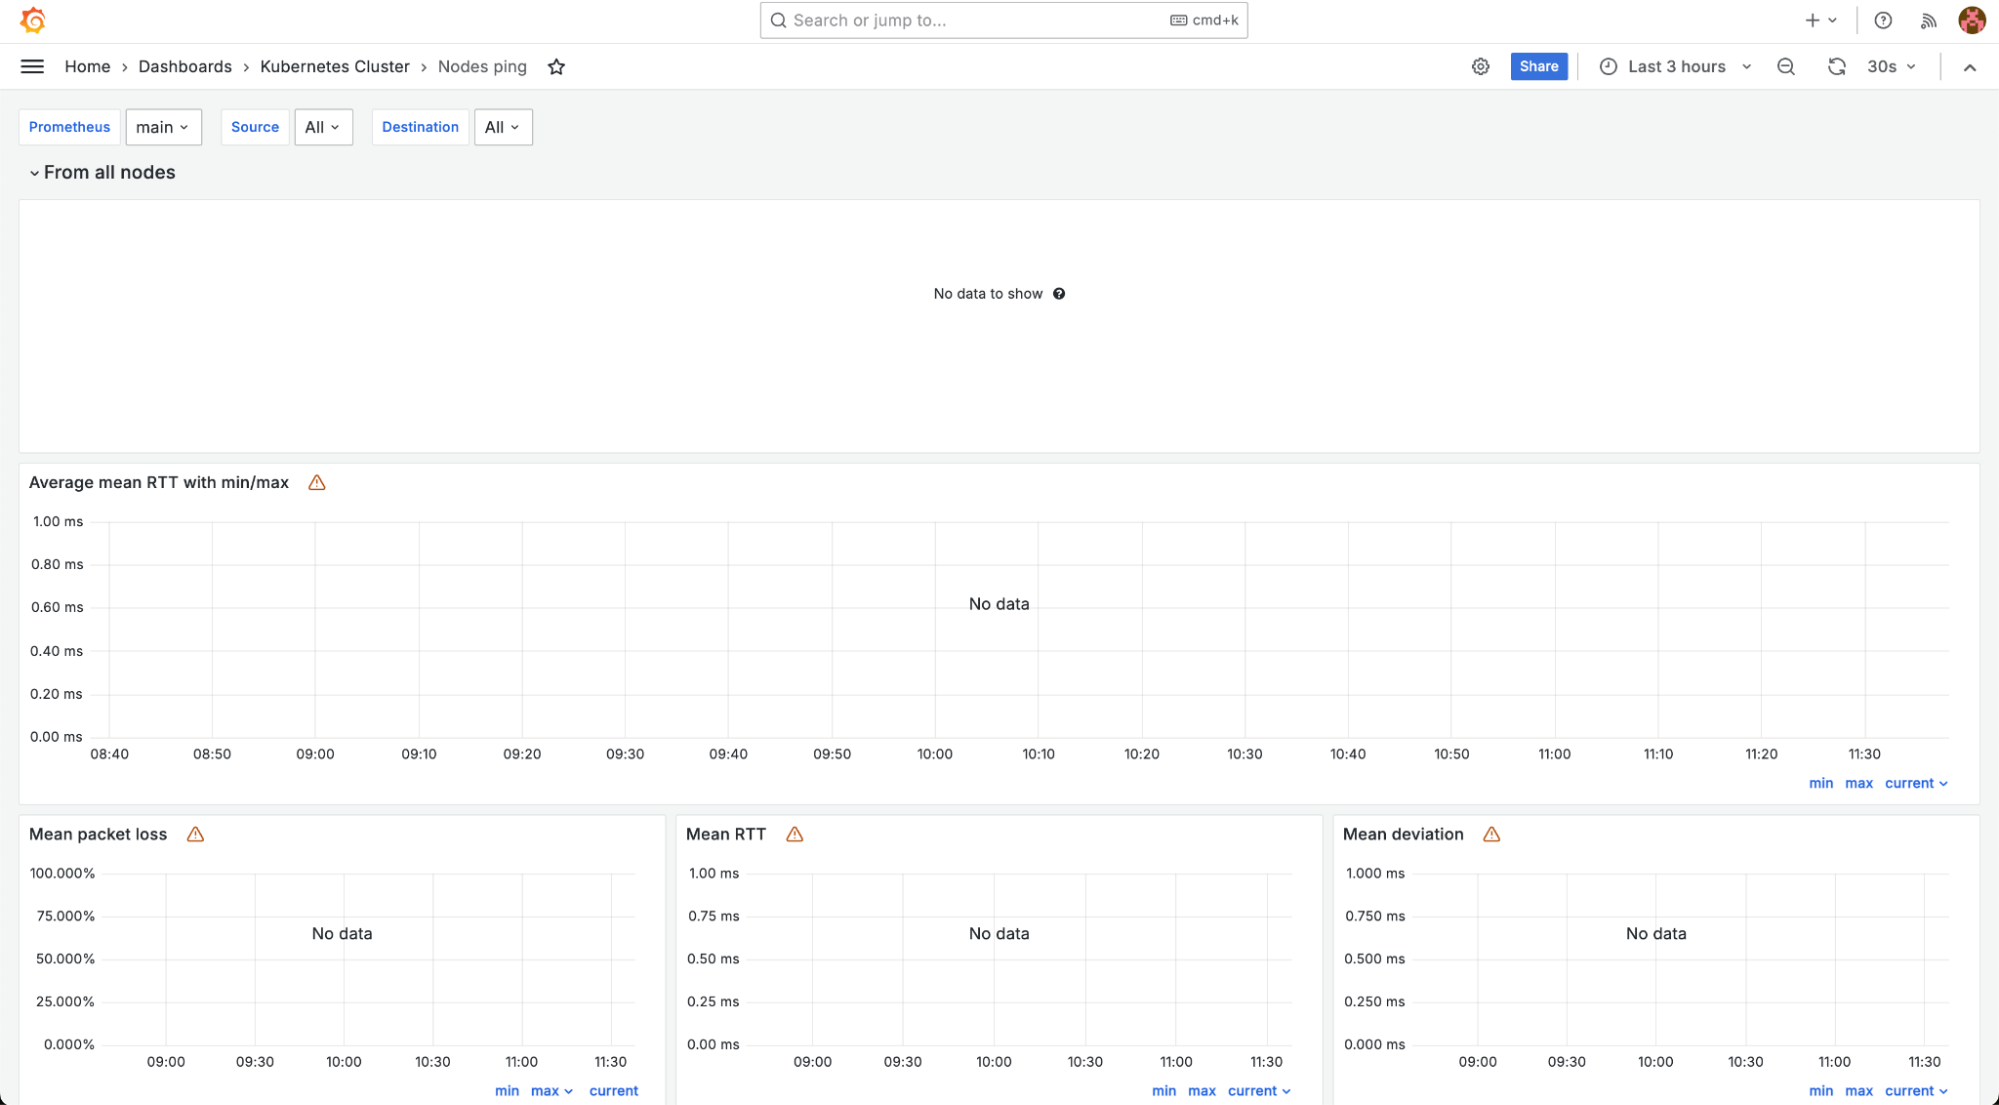
“Nodes ping” dashboard displays ping results for cluster nodes.
-
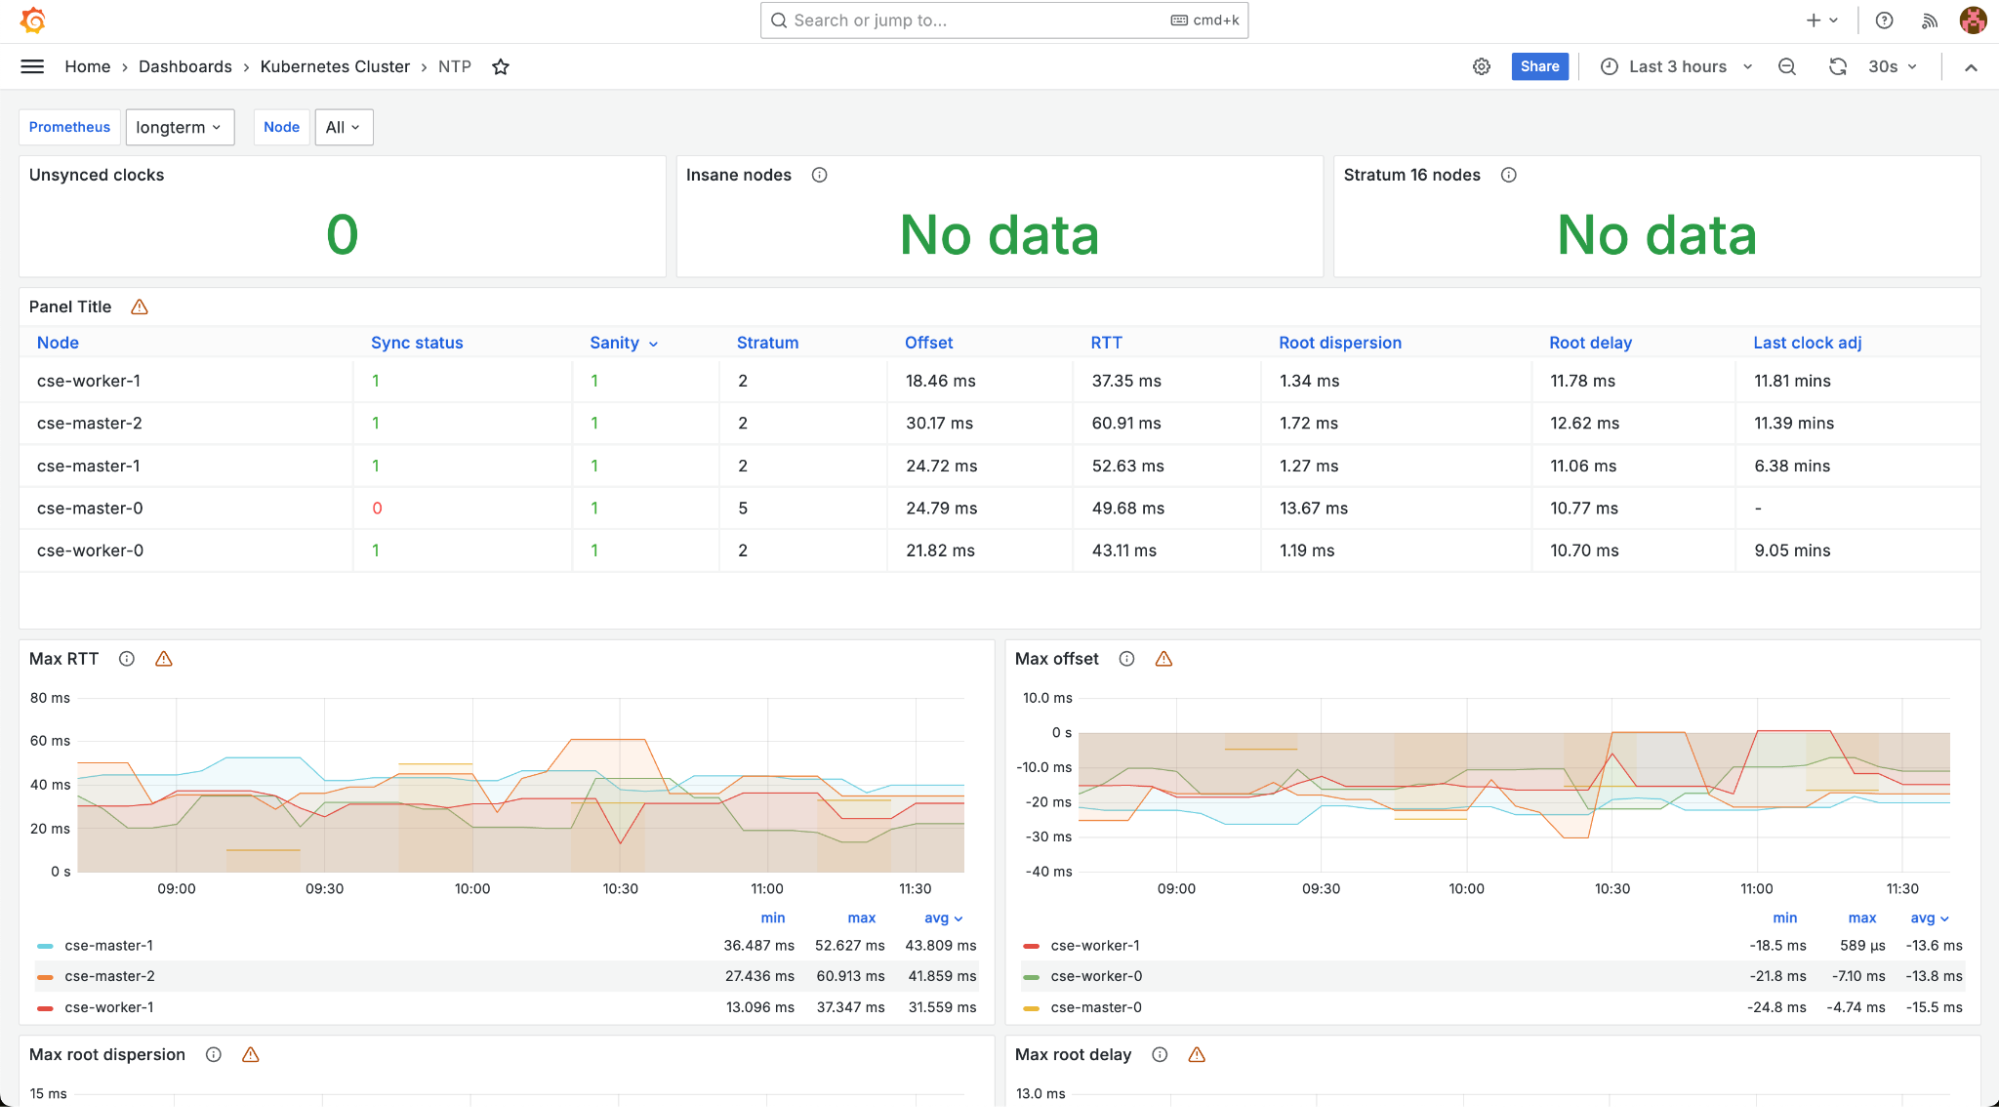
“NTP” dashboard shows a status of the time synchronization server.
-
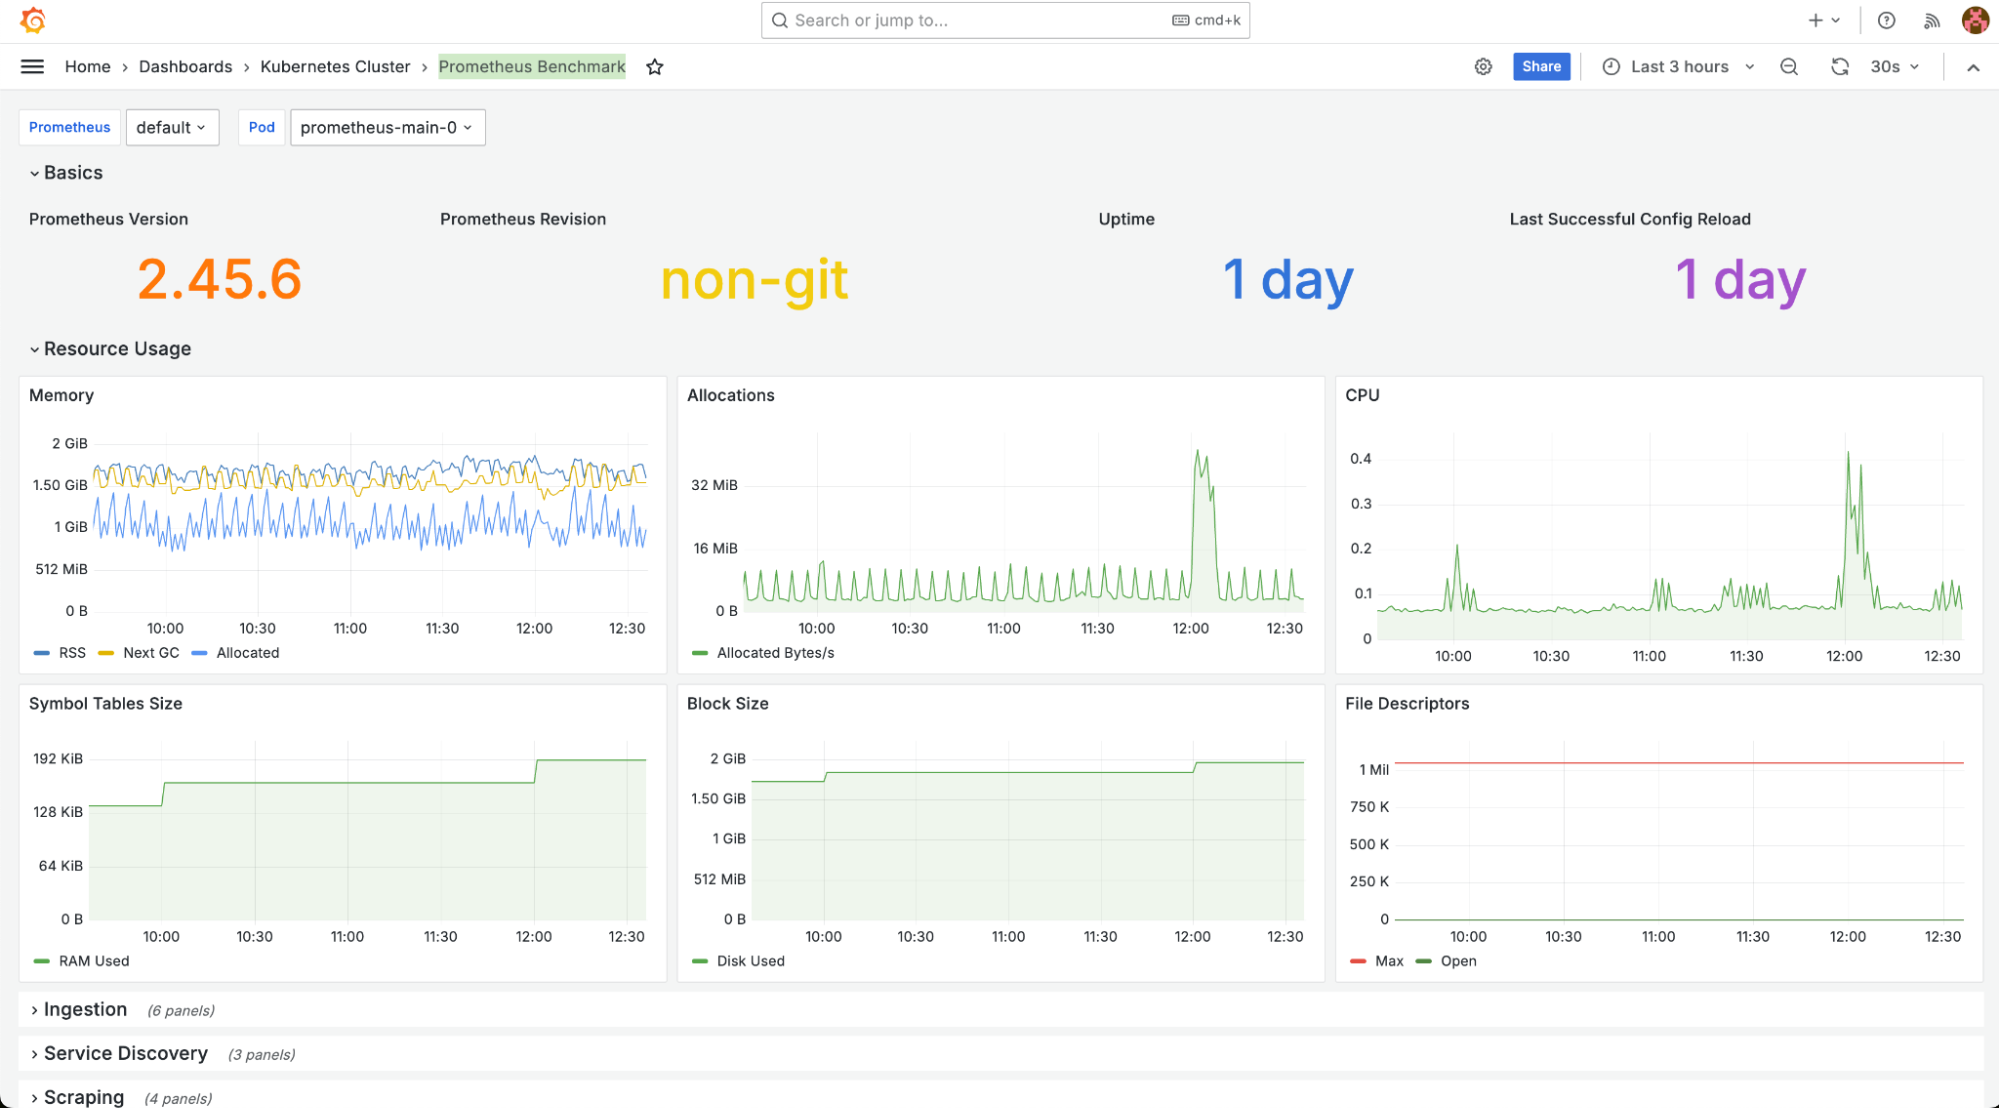
“Prometheus Benchmark” dashboard shows a status of the prometheus module.
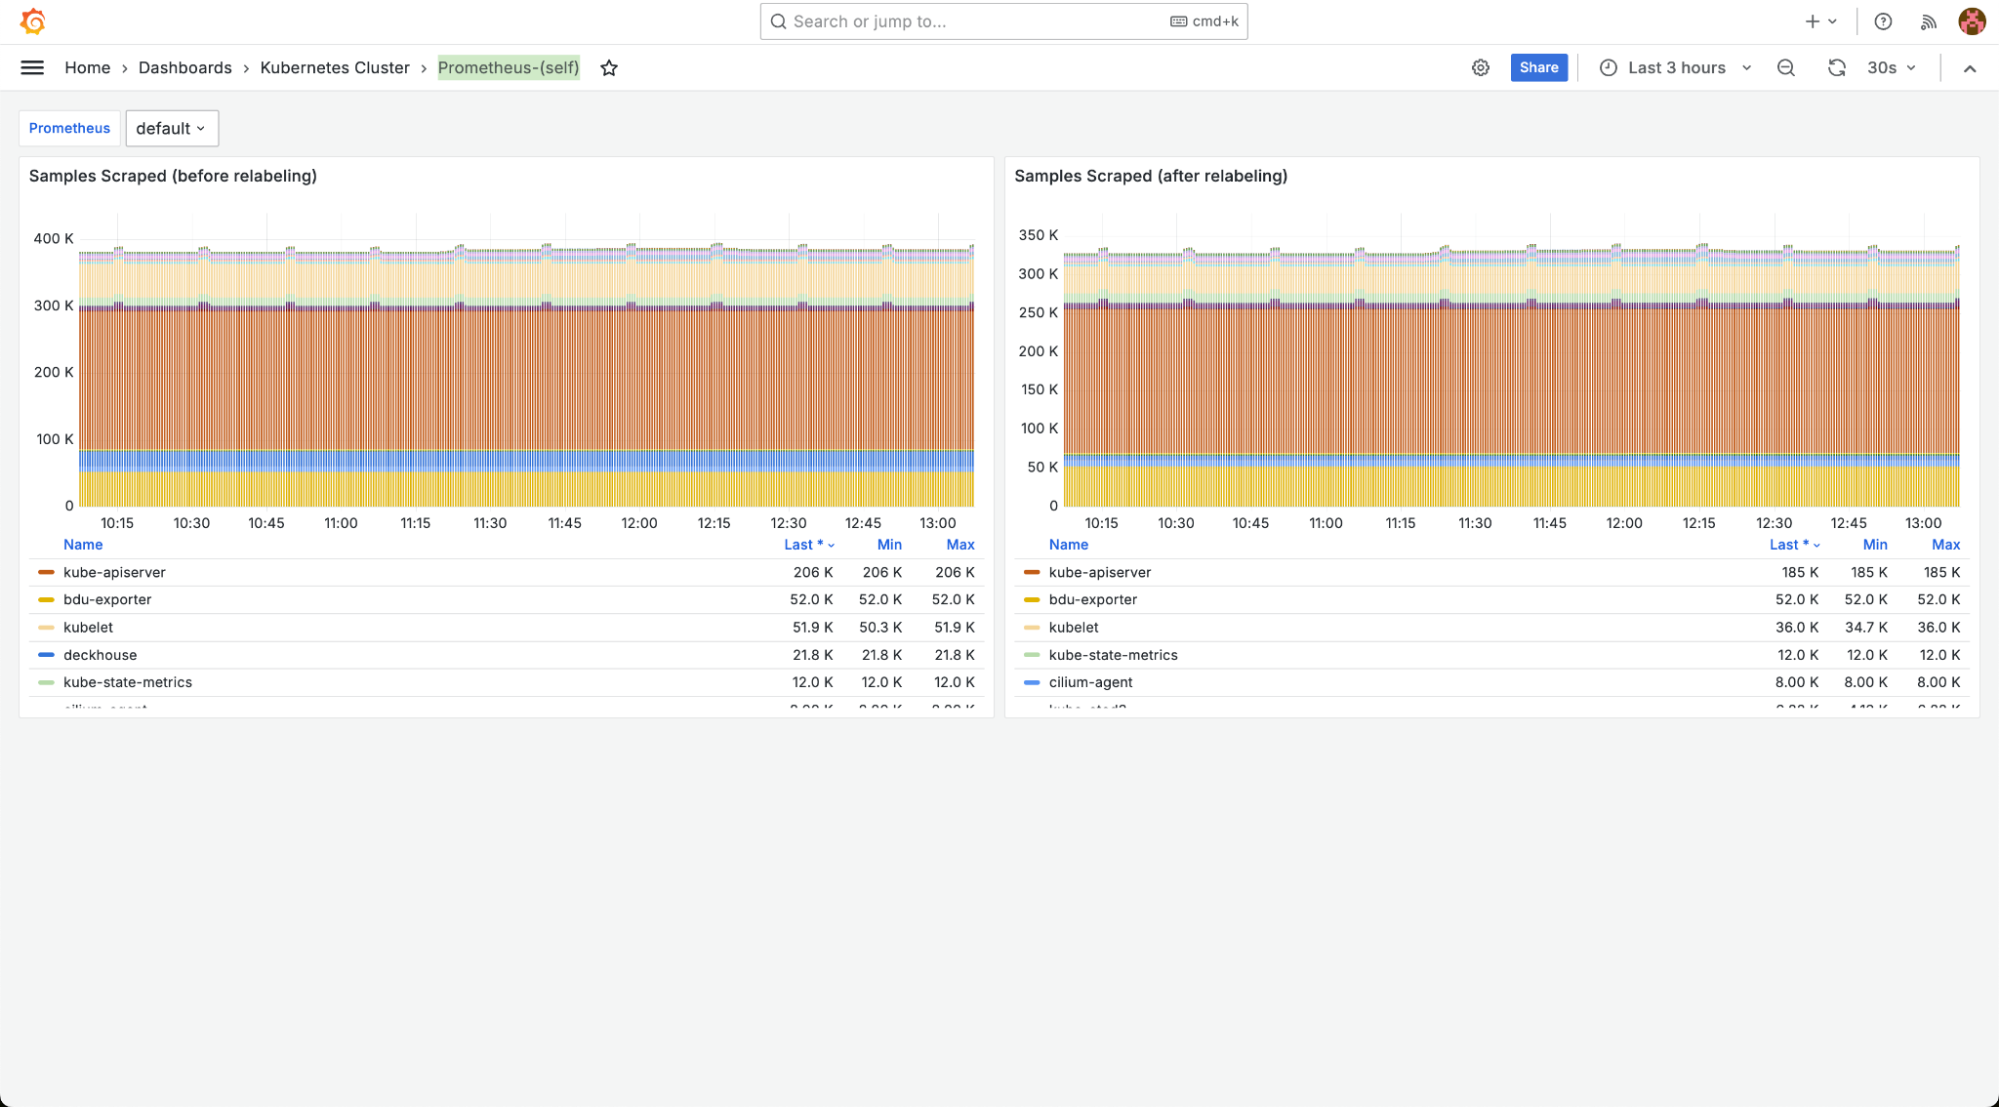
-
“Prometheus-(self)” dashboard — summary information about the state of the prometheus module.
“Main” dashboard group provides general information about the state of the cluster:
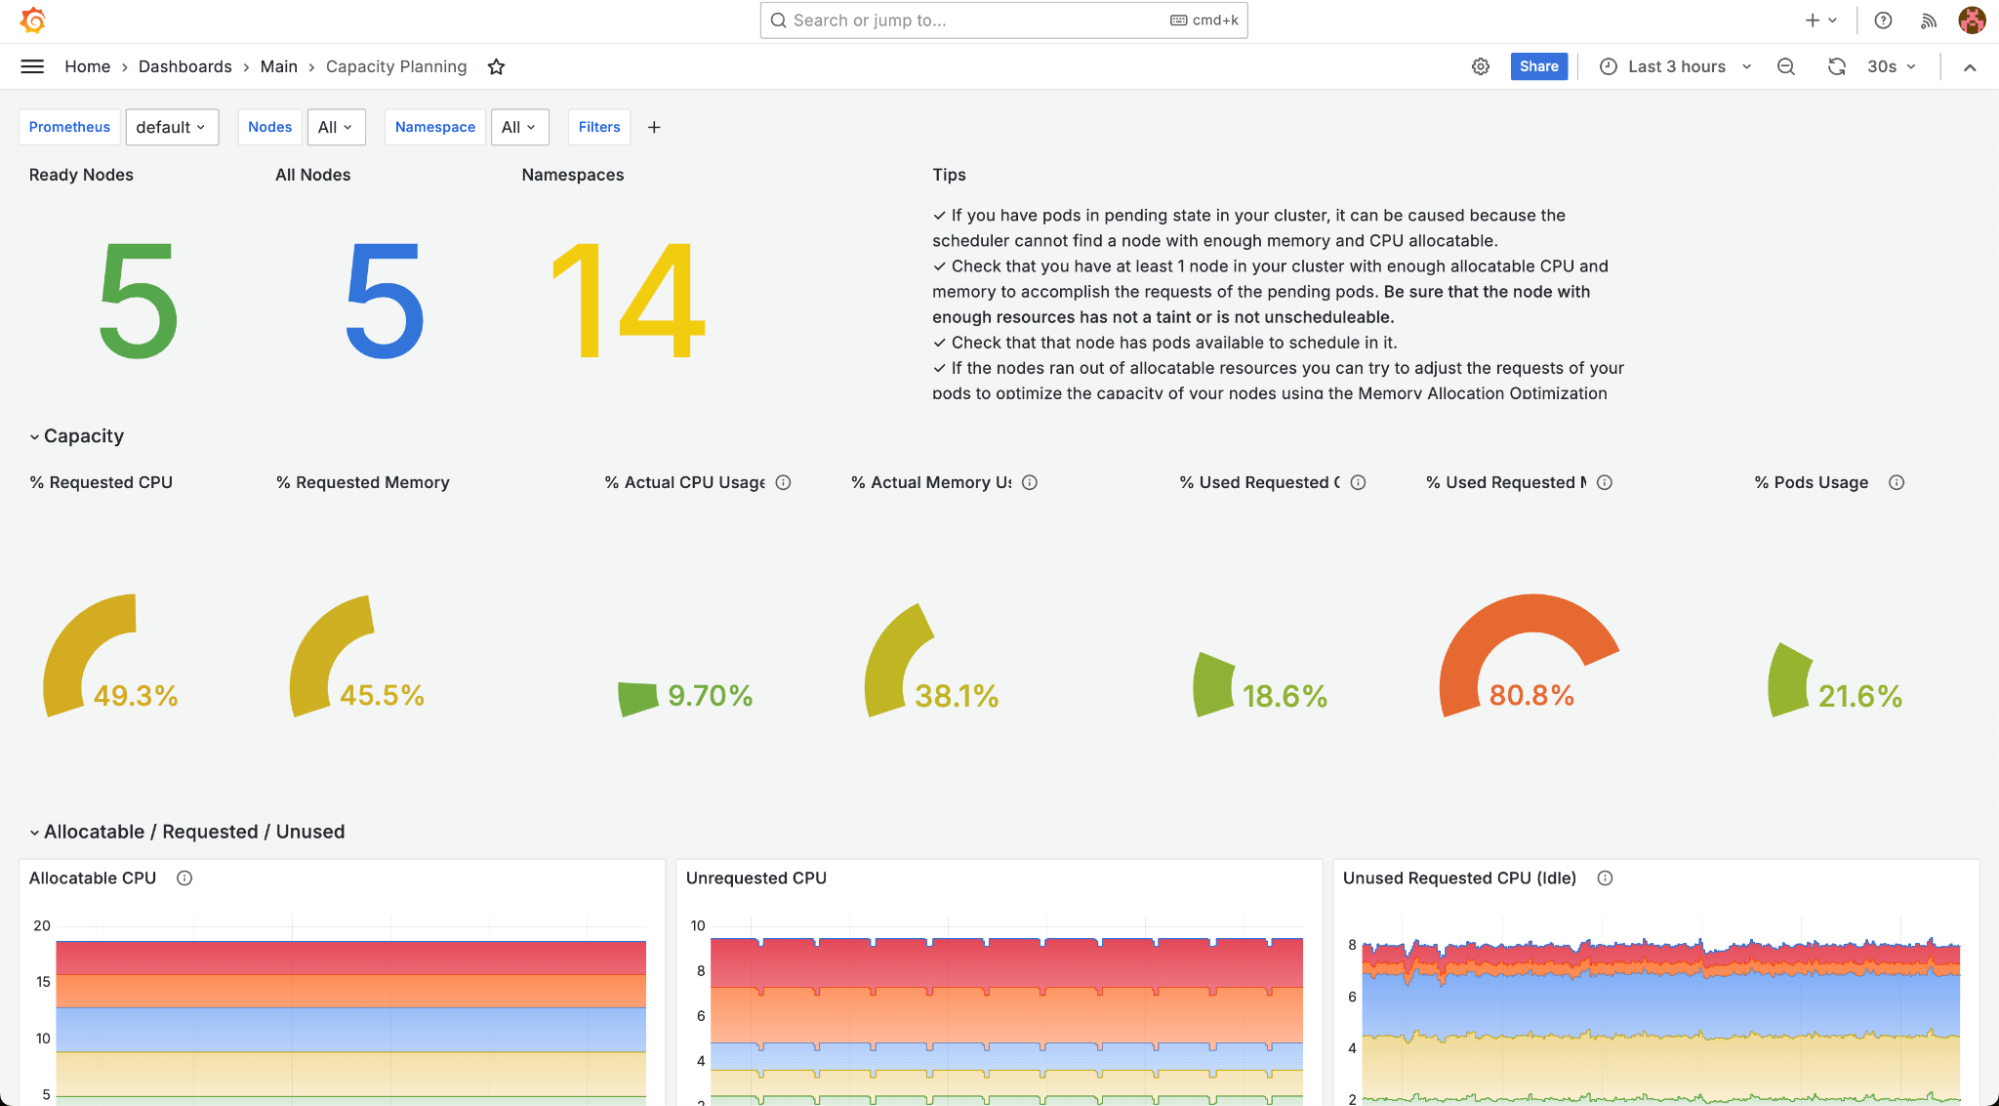
-
“Capacity Planning” shows overview of the cluster’s performance and capacity usage.
-
“Deckhouse” shows summary information about the main deckhouse component.

-
“Namespace” displays data on a specific cluster namespace.
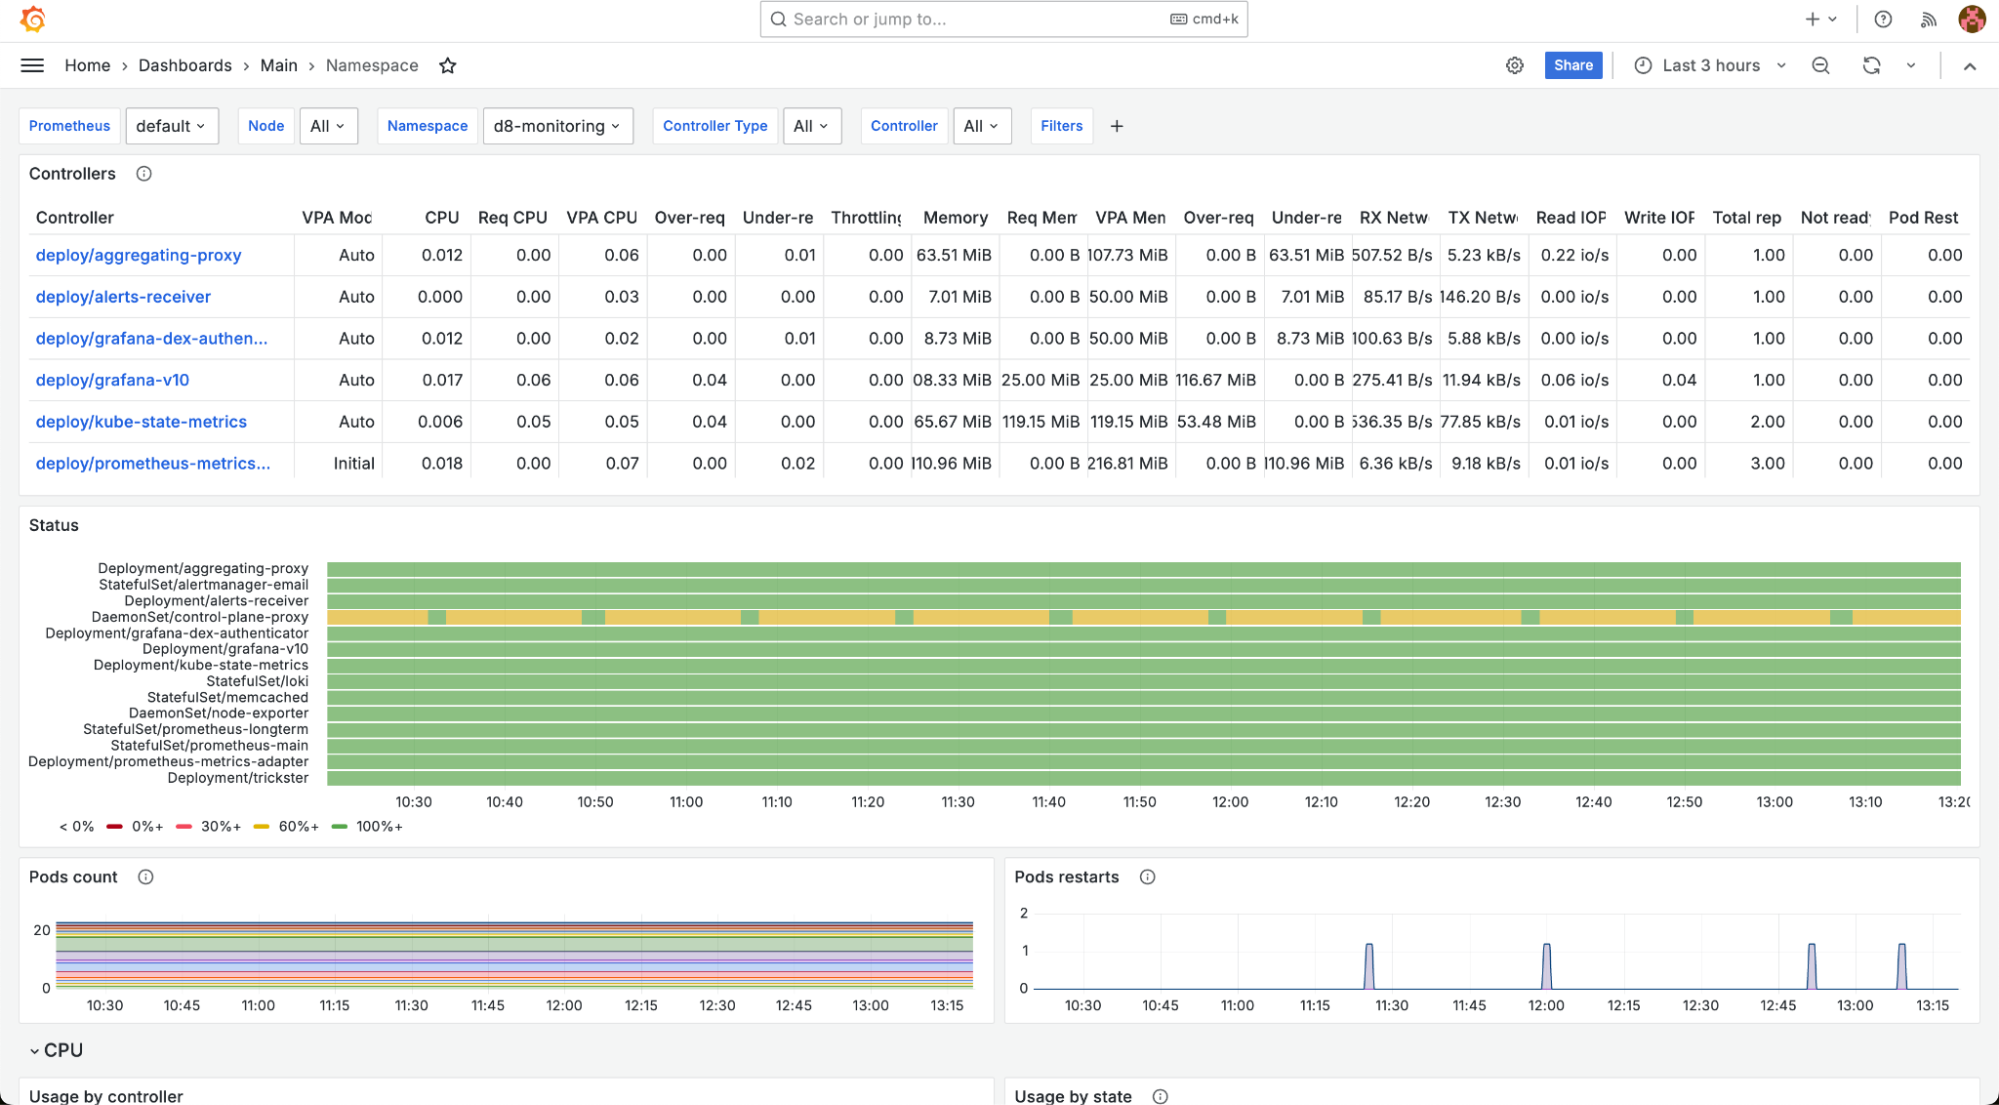
-
“Namespace / Controller” displays data on controllers in namespaces. Filters allow you to select specific namespaces and controllers.
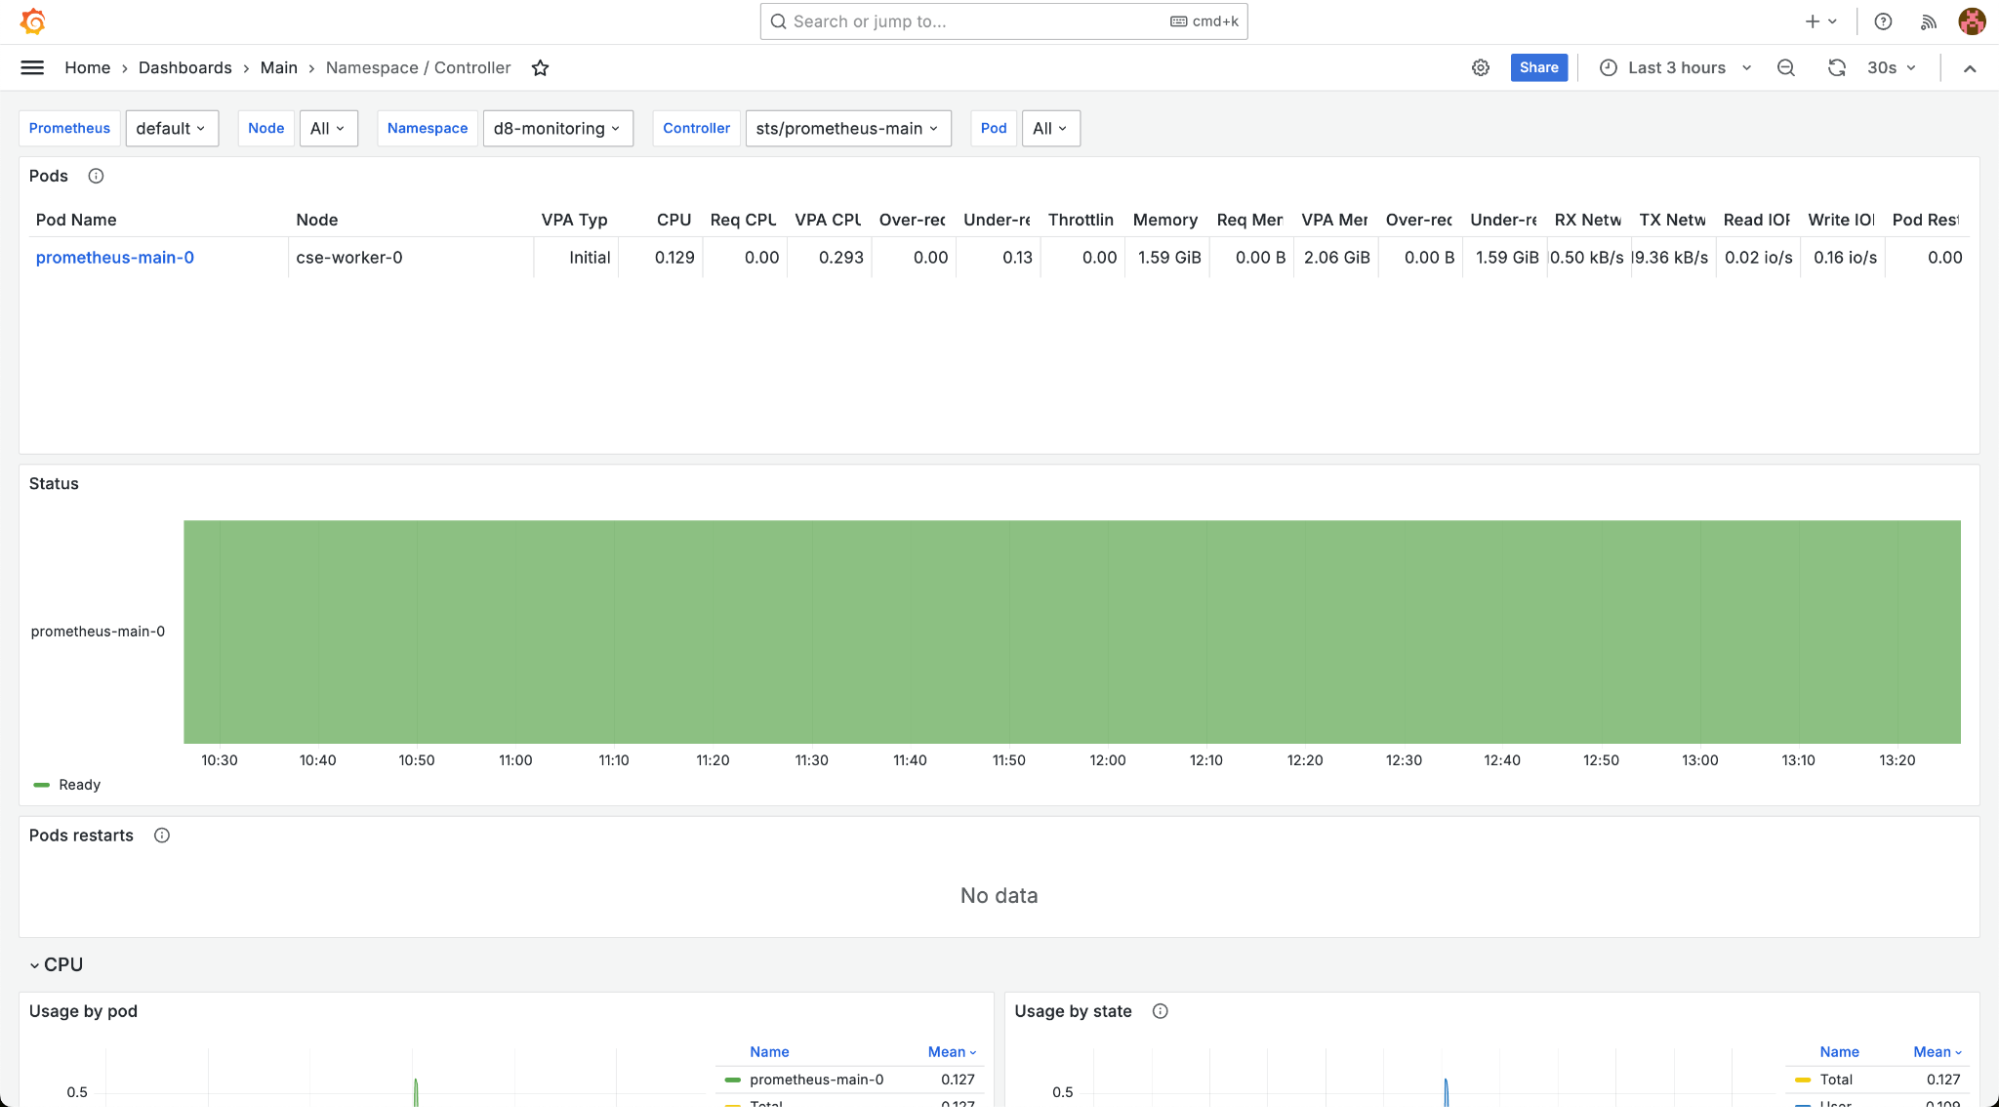
-
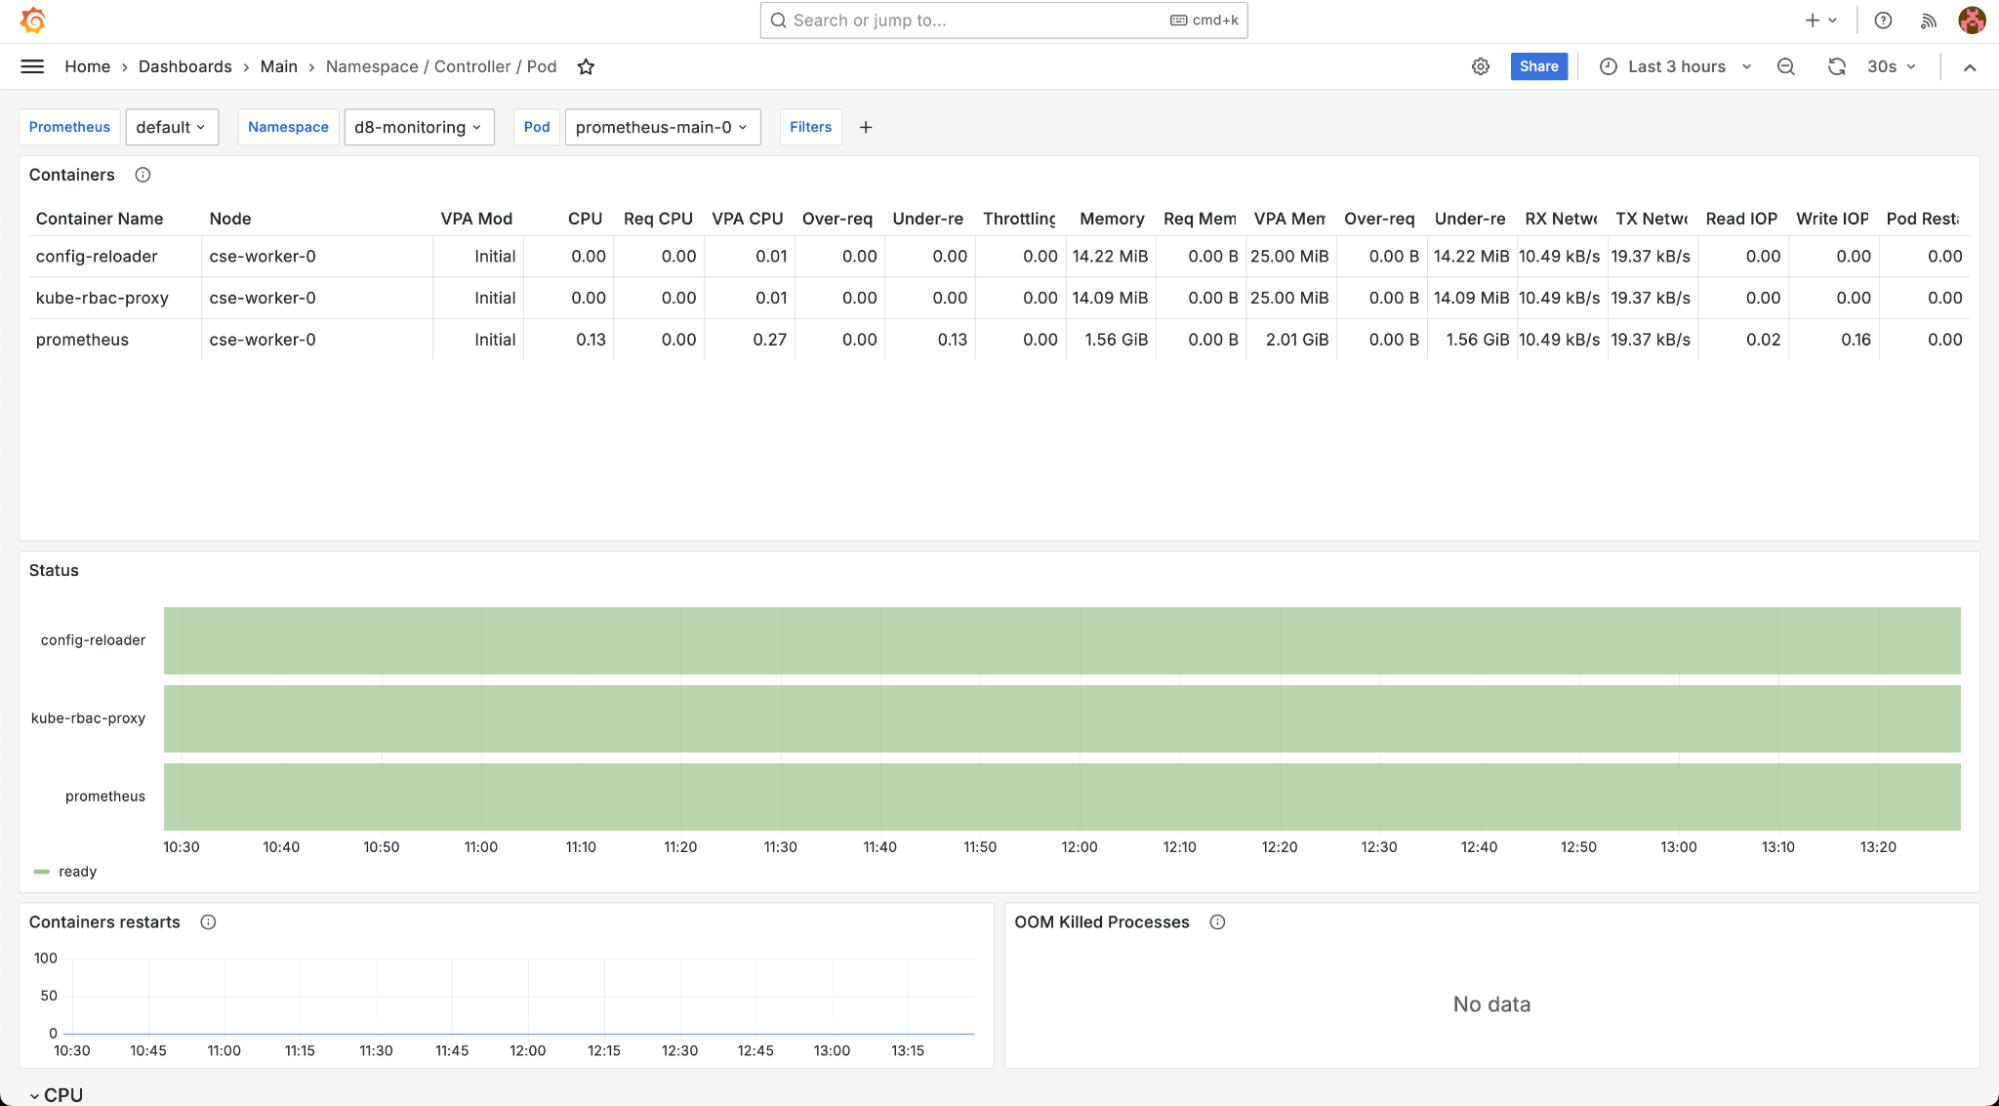
“Namespace / Controller / Pod” show data on Pods in namespaces. Filters allow selection of specific namespaces and Pods.
-
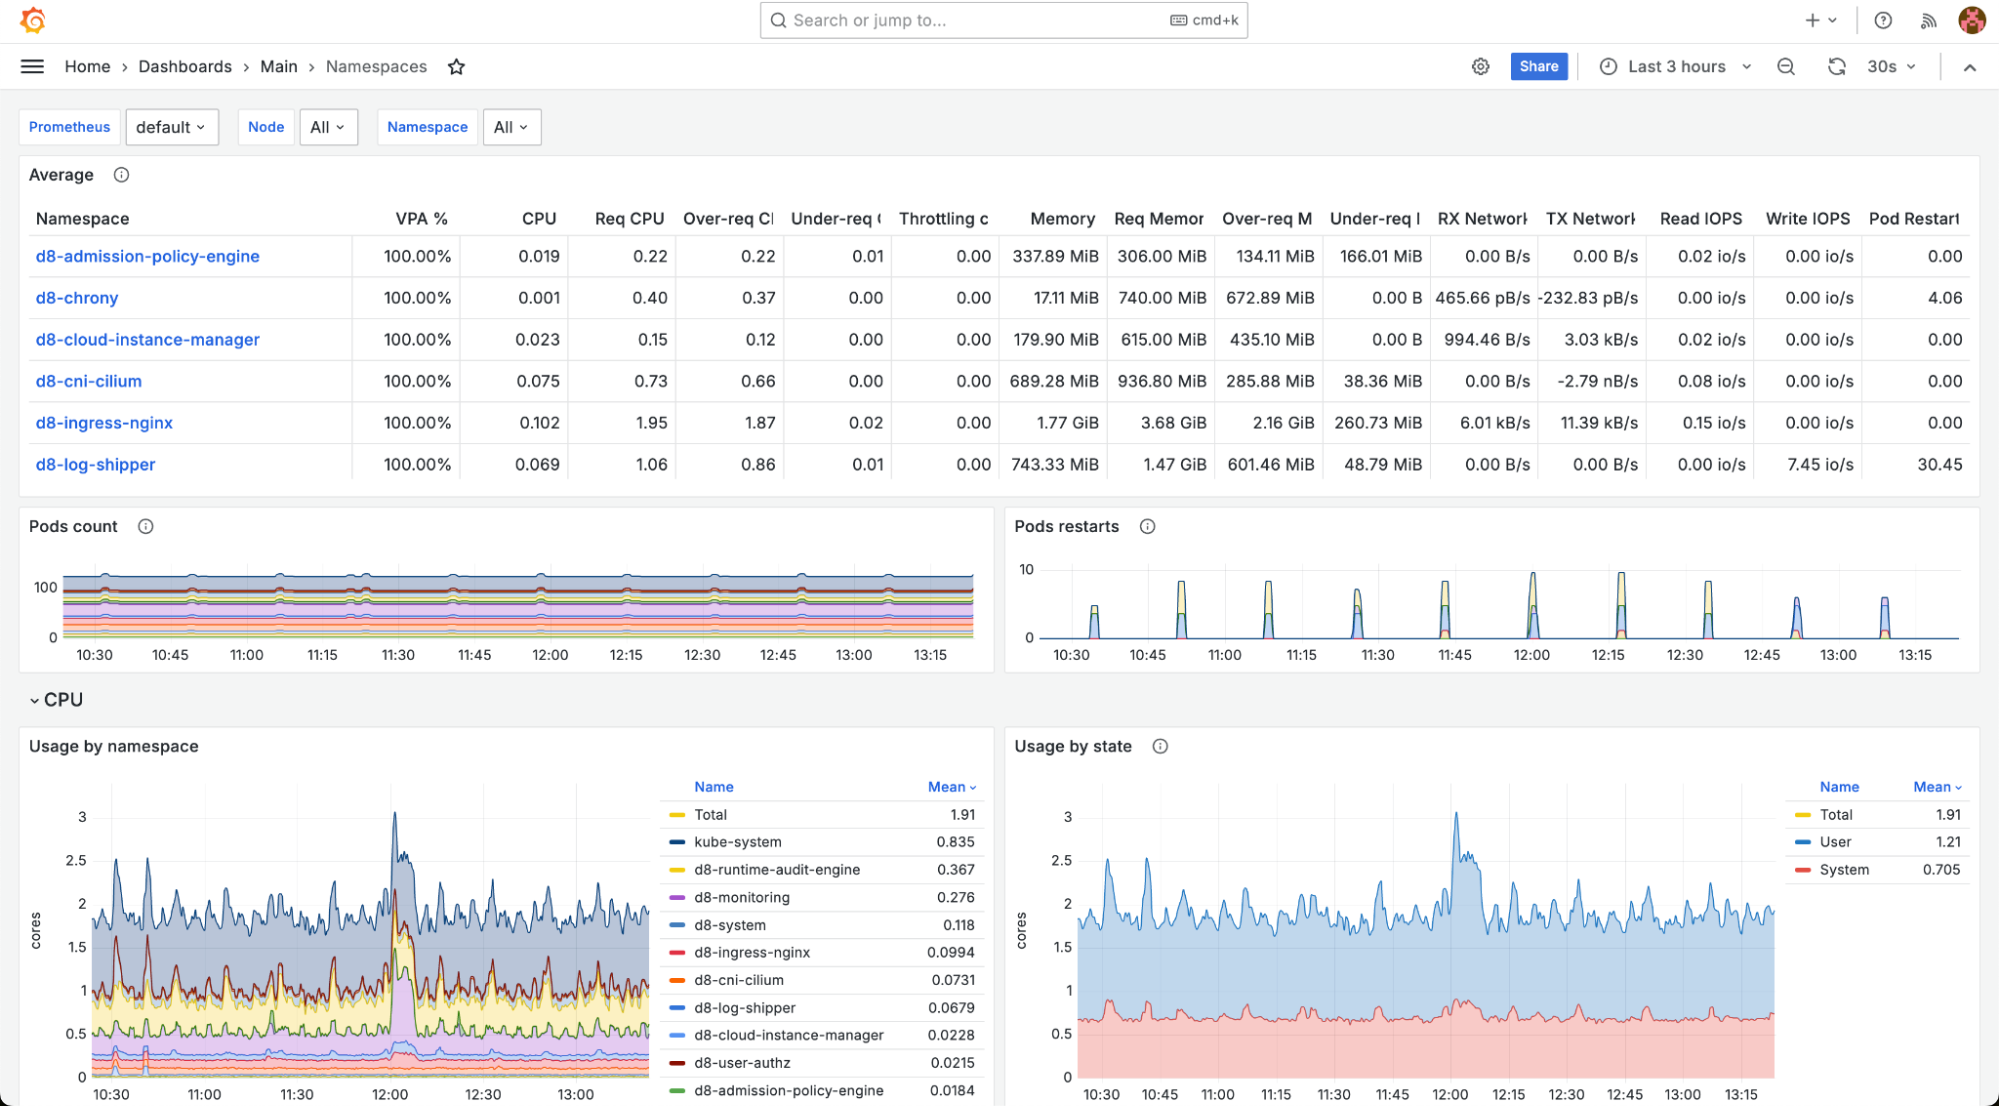
“Namespaces” shows summary data grouped by cluster namespaces.
Viewing security event logs
Security event logs are available through the Grafana web UI. The relevant dashboards are grouped under the “Security” folder:
-
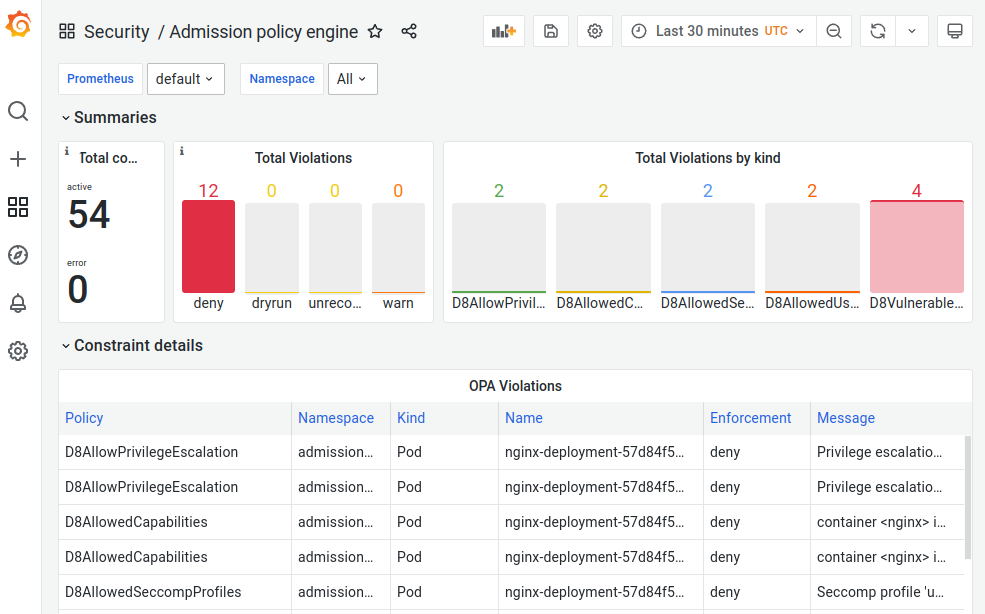
Admission policy engine. Contains information related to the operation of security policies, including a number of denied actions due to policy violations, breakdown of denials by type, and event logs. The event log for policy-related security violations is available in the OPA Violations panel.
-
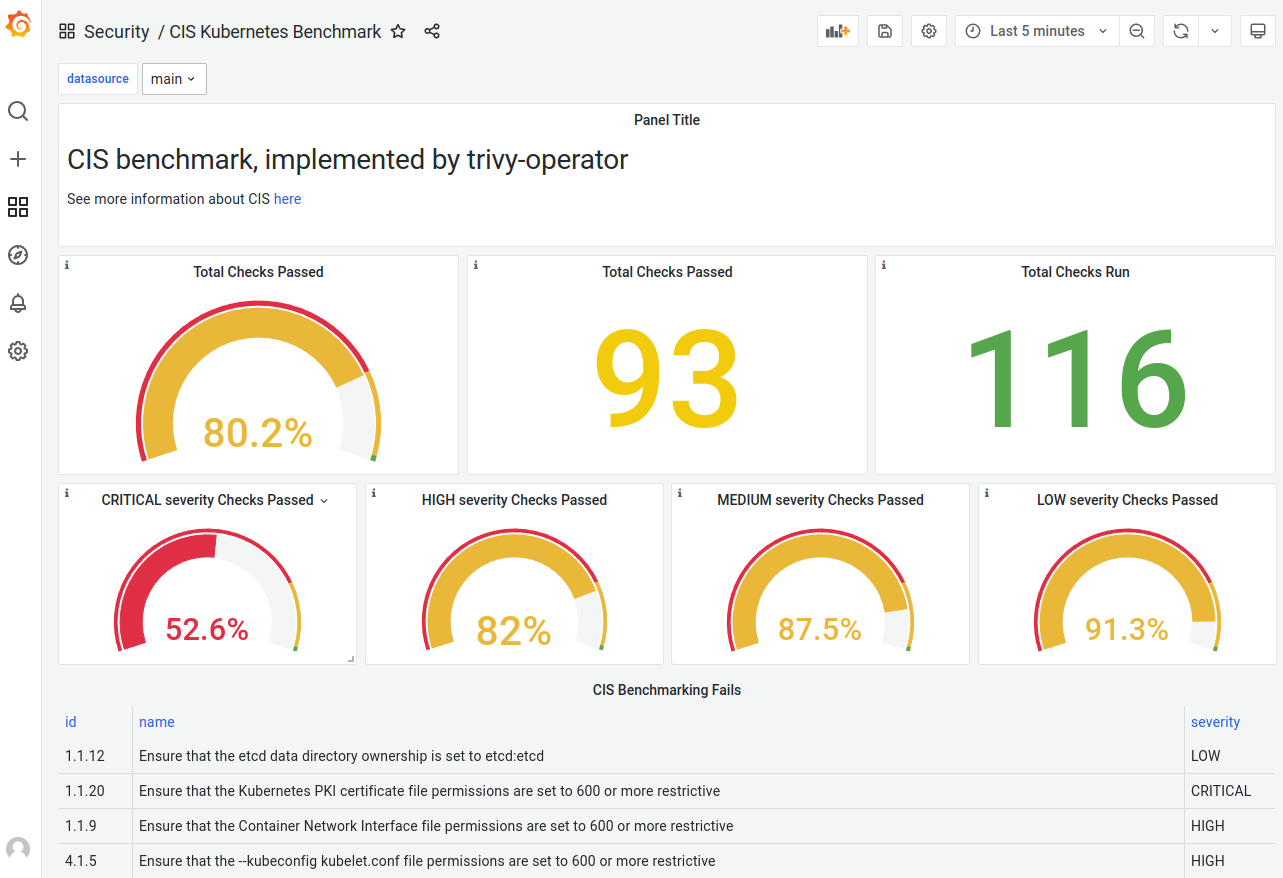
CIS Kubernetes Benchmark. A dashboard with the results of a configuration audit for compliance with established best practices. It provides summary information with no detailed view. This dashboard is available when the operator-trivy module is enabled.
-
Kubernetes audit logs. Includes logs of all interactions with the Kubernetes API server. Records are presented in JSON format.
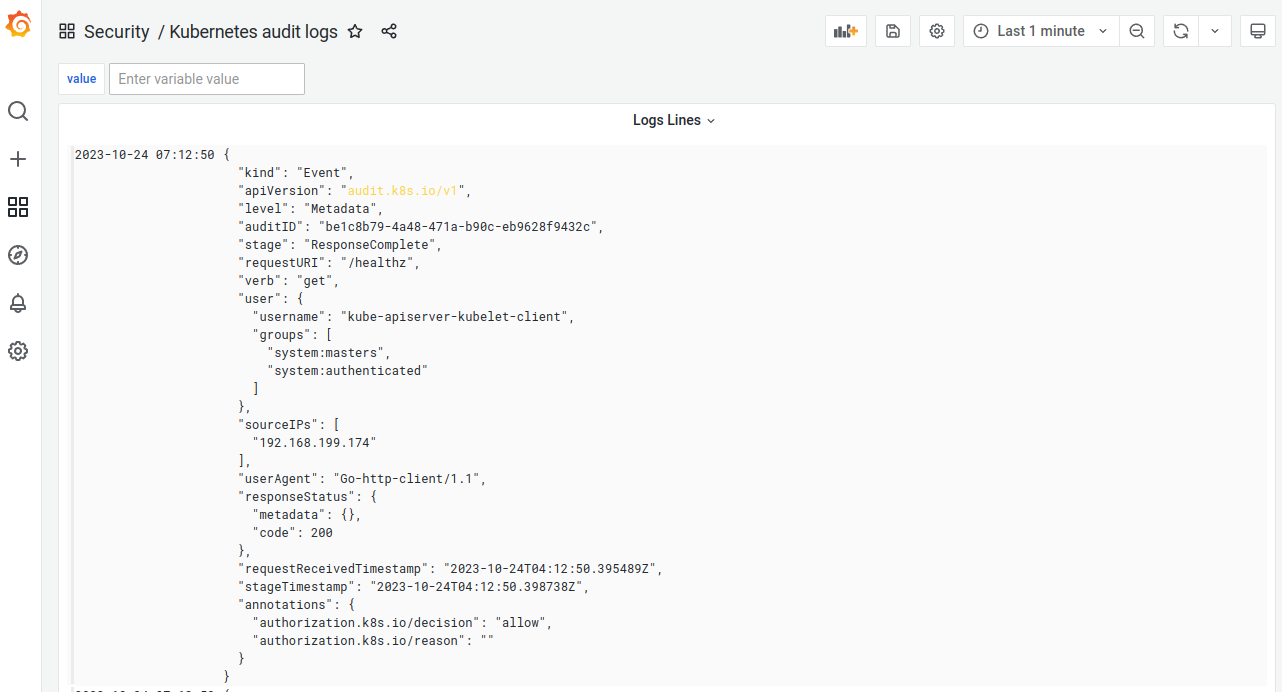
-
Runtime audit engine logs. Includes logs of Linux kernel and cluster API server security audit events.
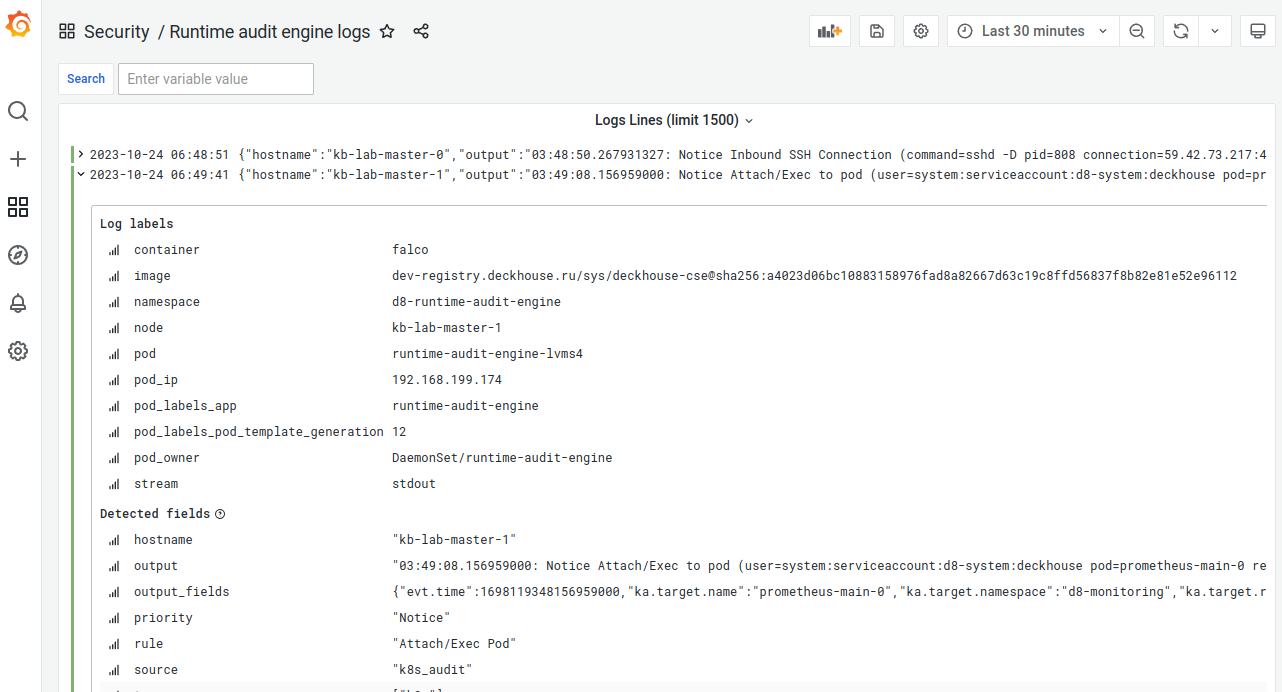
-
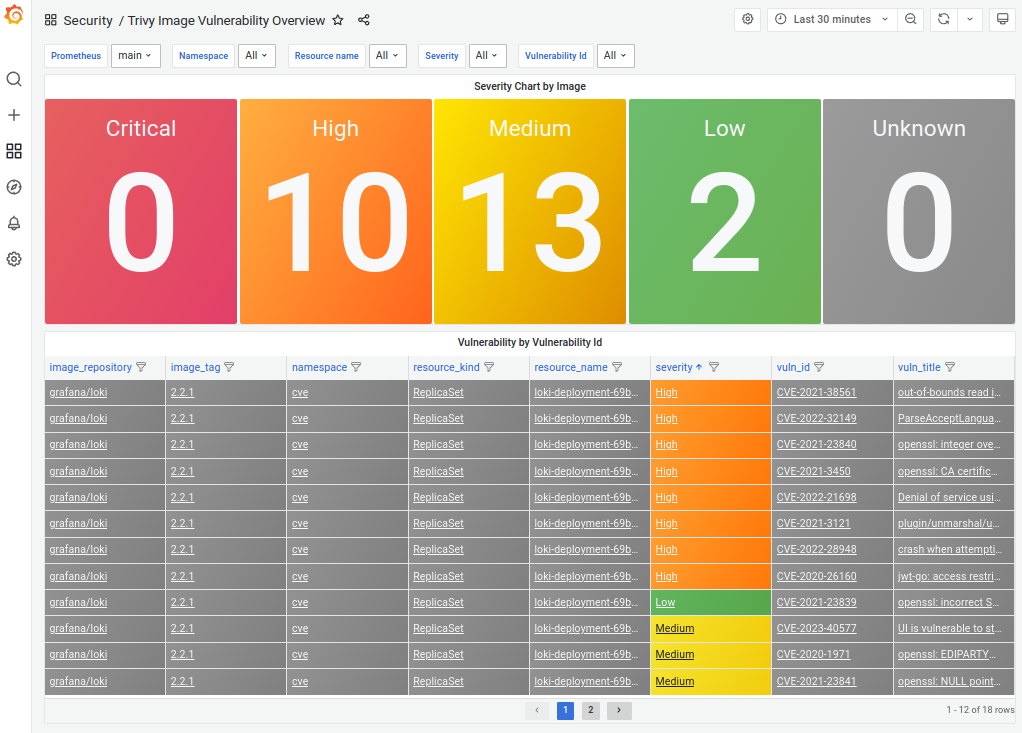
Trivy Image Vulnerability Overview. A dashboard with summary and detailed information on vulnerability scans of container images in namespaces annotated with
security-scanning.deckhouse.io/enabled.