The alert management web UI can be used for handling alerts in a Deckhouse cluster. It allows you to view detailed information about alerts, including the source, severity, and trigger time, and to temporarily silence alert notifications when needed.
For the list of all available alerts in the Deckhouse Kubernetes Platform monitoring system, refer to the corresponding documentation page.
Accessing the web UI
-
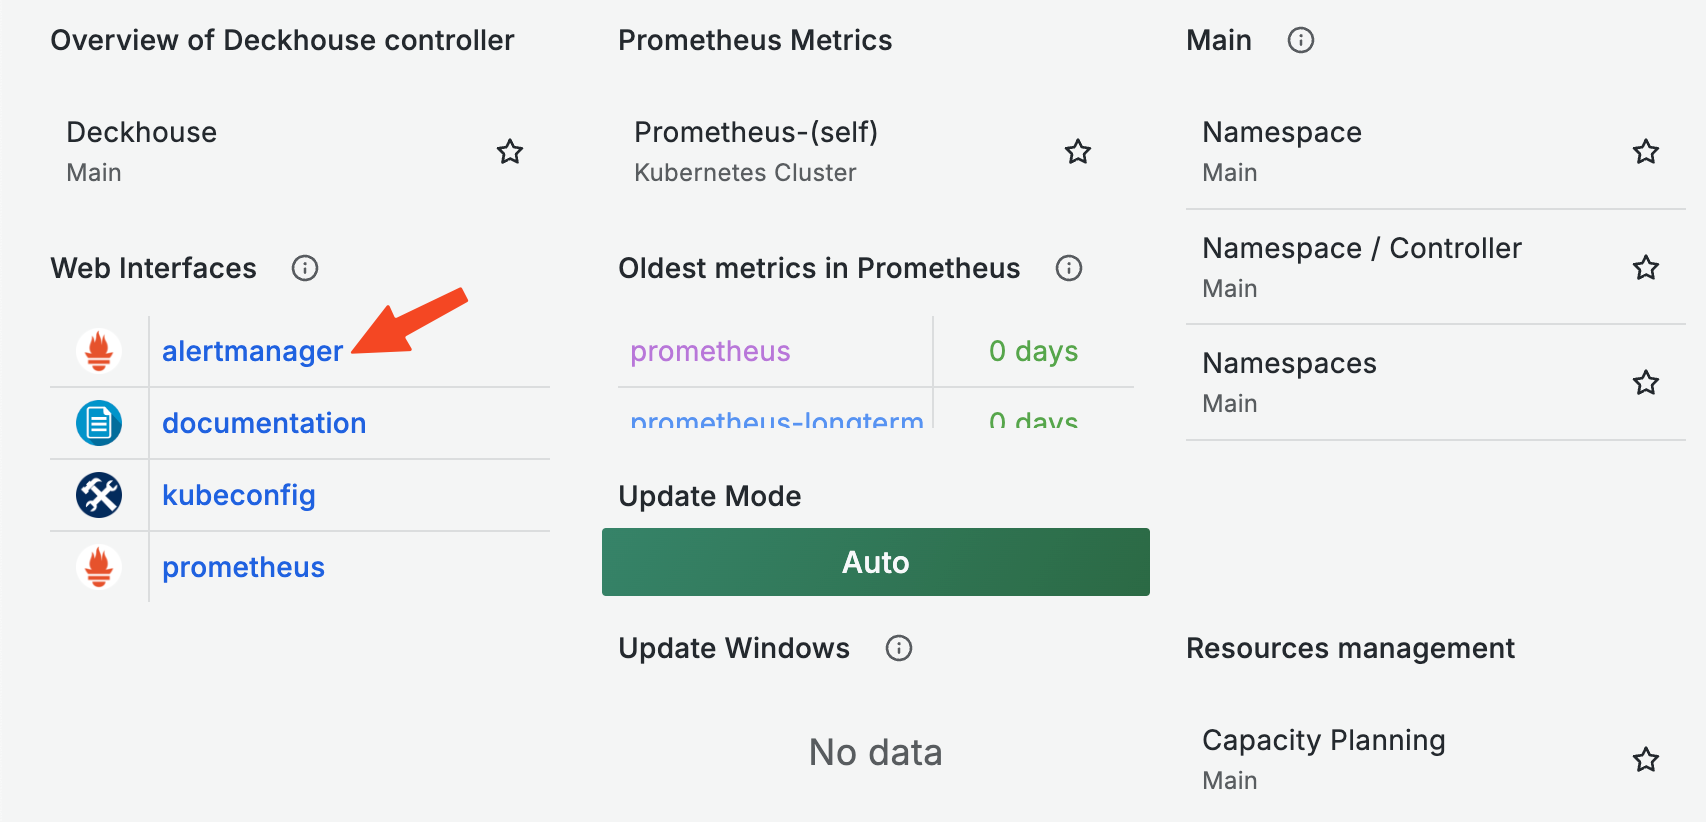
To open the alert management web UI, click the corresponding link in the side menu on the Grafana overview page.
-
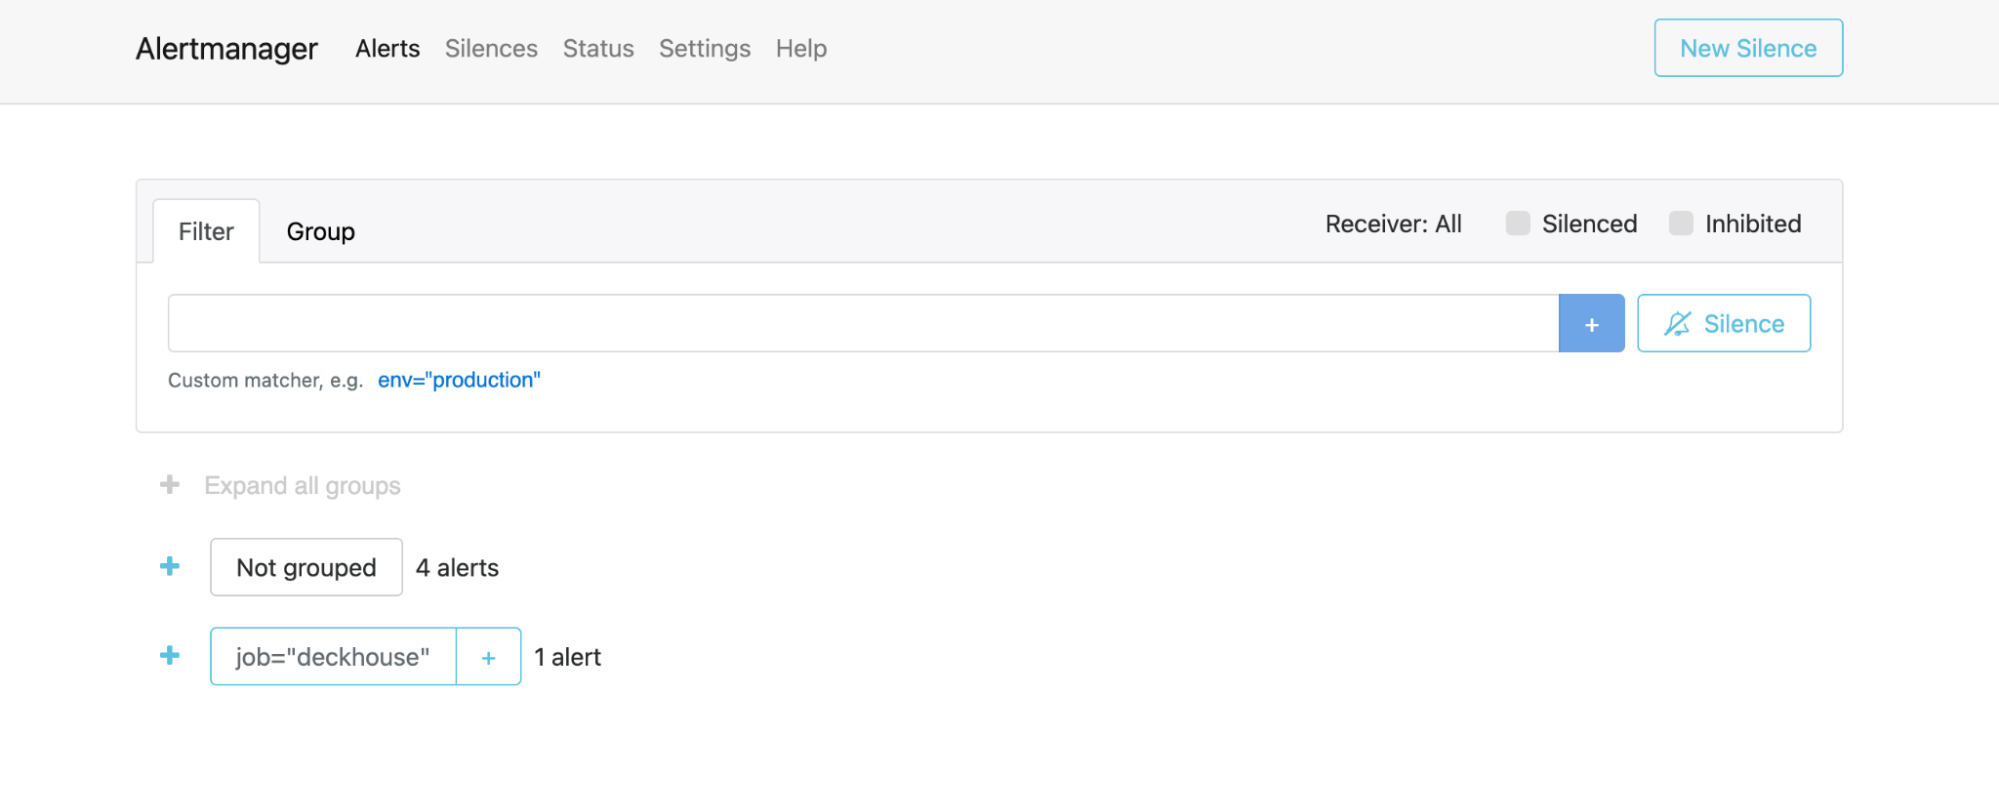
If you are accessing the web UI for the first time, enter your user credentials. Once the authentication is complete, you will see the main web UI page displaying a summary of all alerts in the cluster.
-
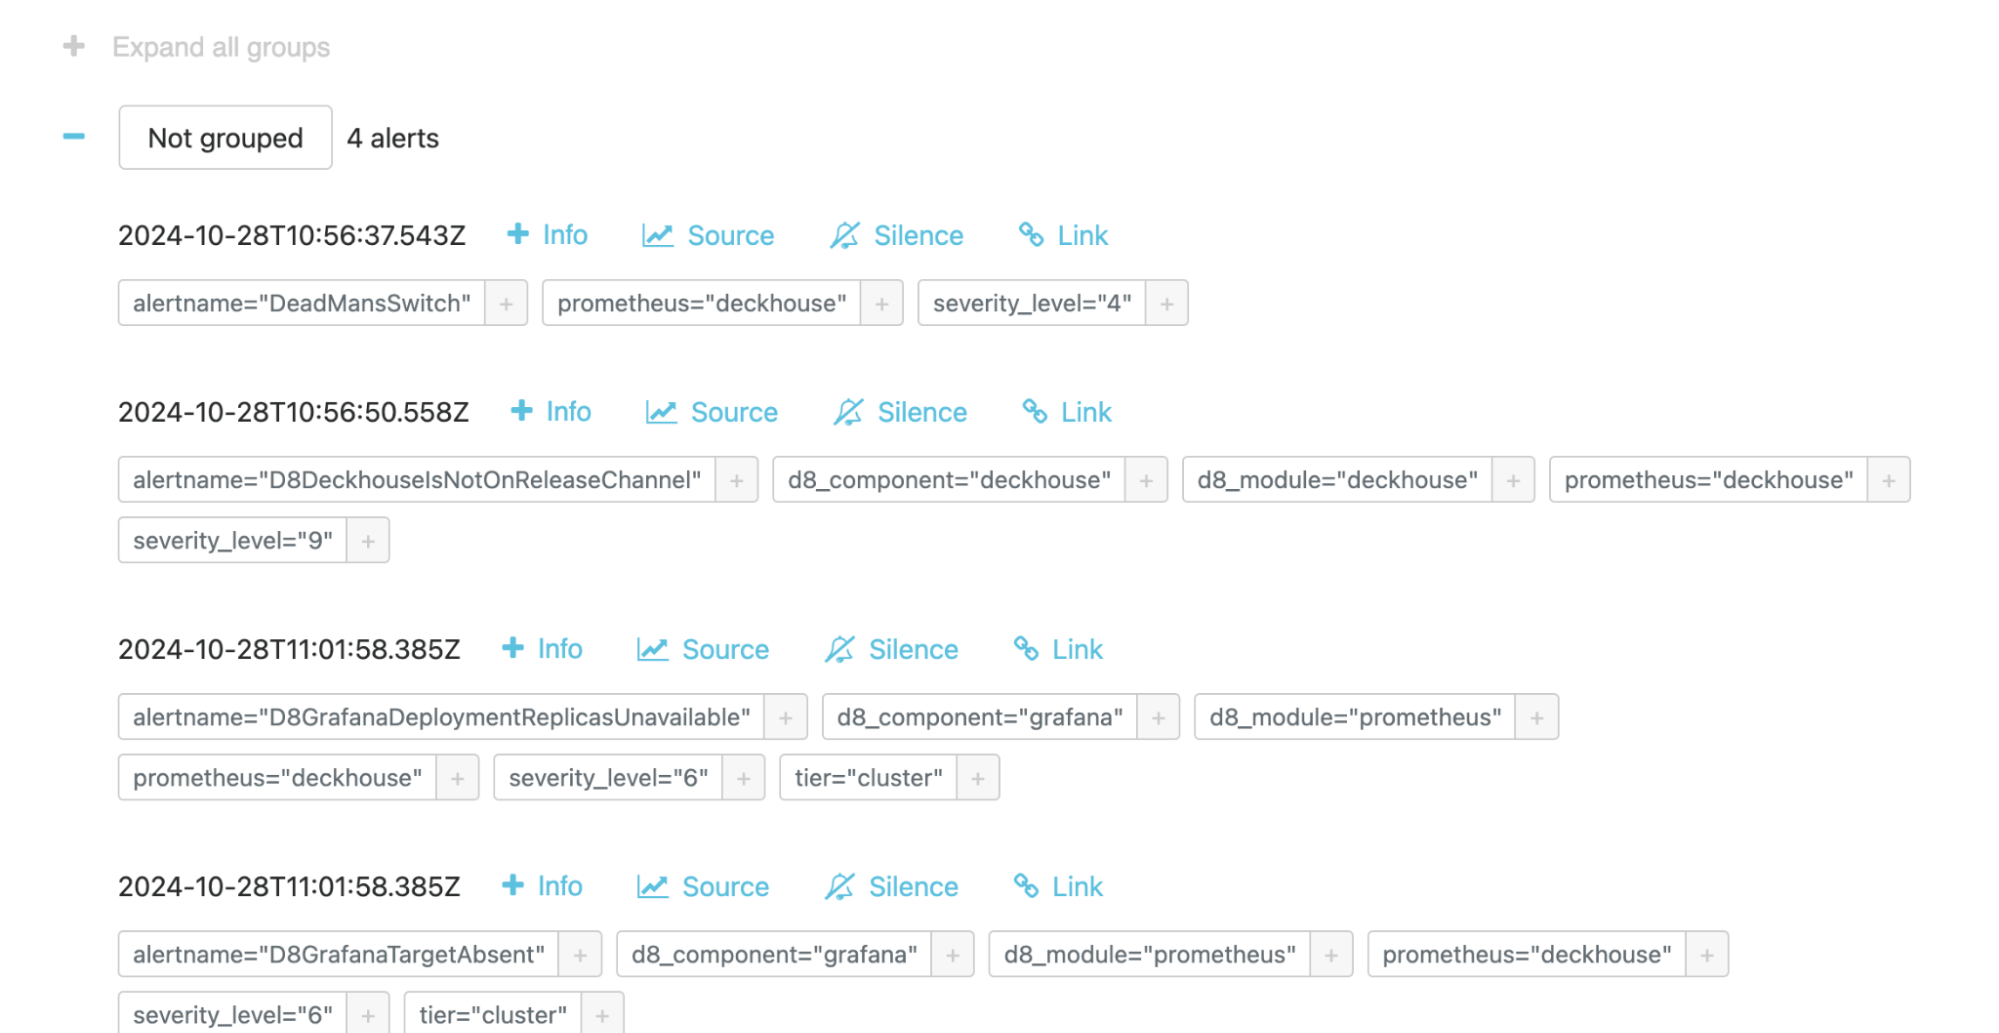
Alerts are grouped by category. To expand a group, click the
+icon to the left of the group name.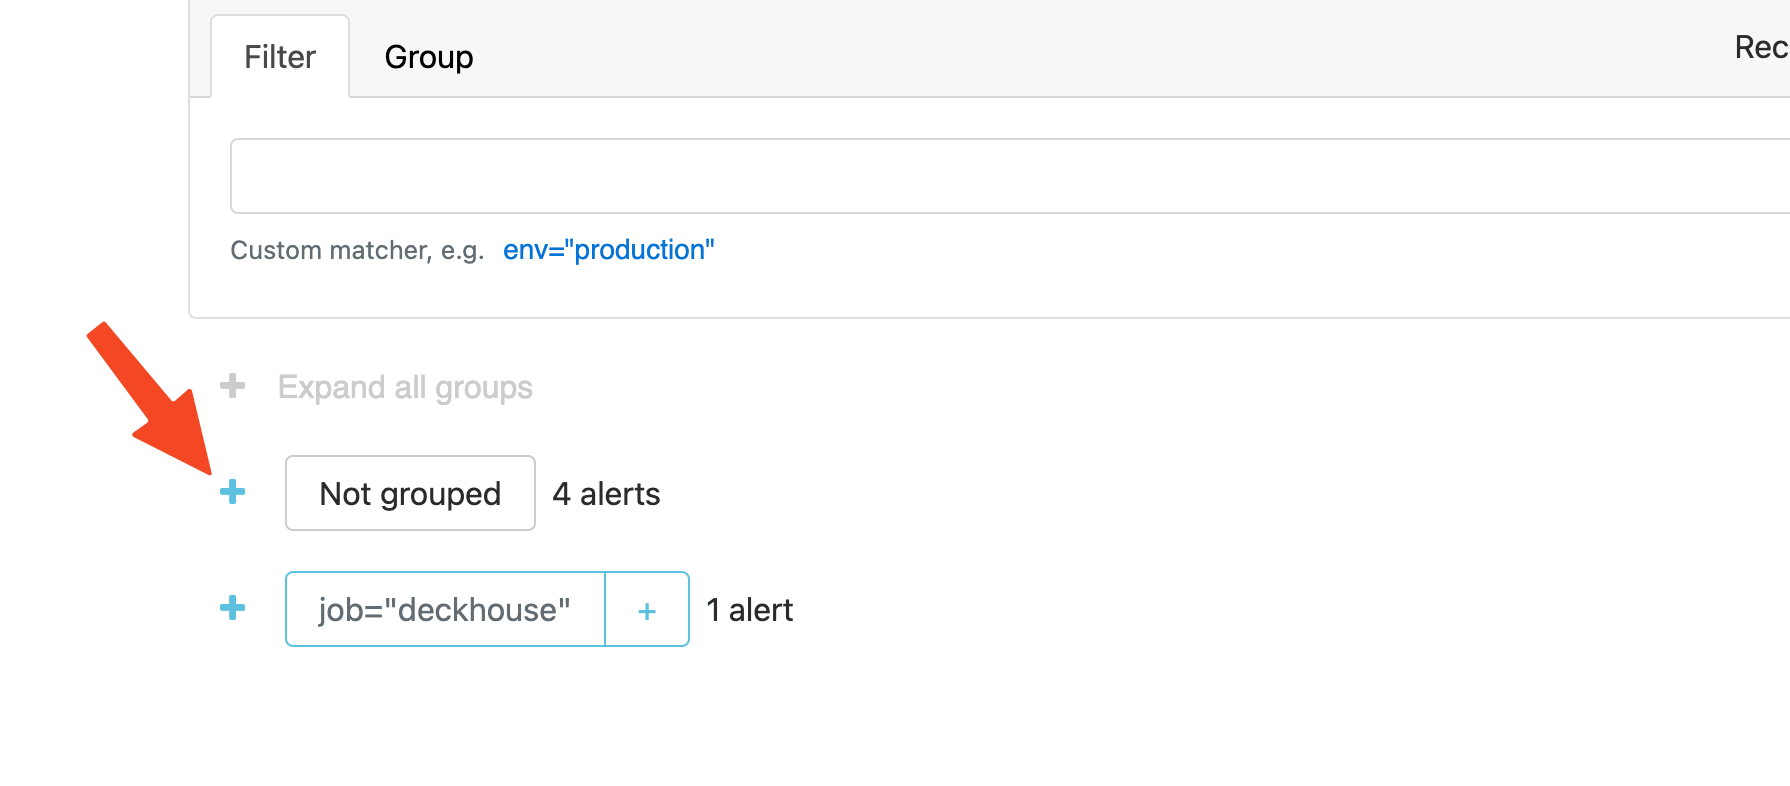
-
Once expanded, the group will display the full list of associated alerts.