Deckhouse Kubernetes Platform on Selectel (OpenStack)
Everything is installed, configured, and working!
Now that you have installed and properly configured Deckhouse Kubernetes Platform, let’s look at what you can do with it.
By default, the Dex is used for accessing all the components.
Open the cluster web interface by clicking the “Connect and open” button in the row with the created cluster on the main screen.
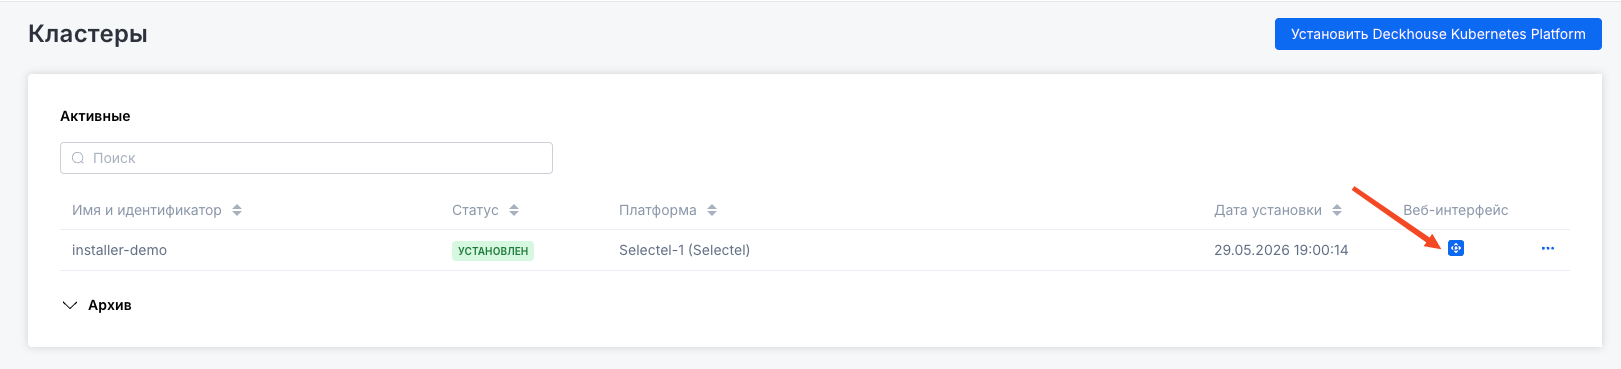
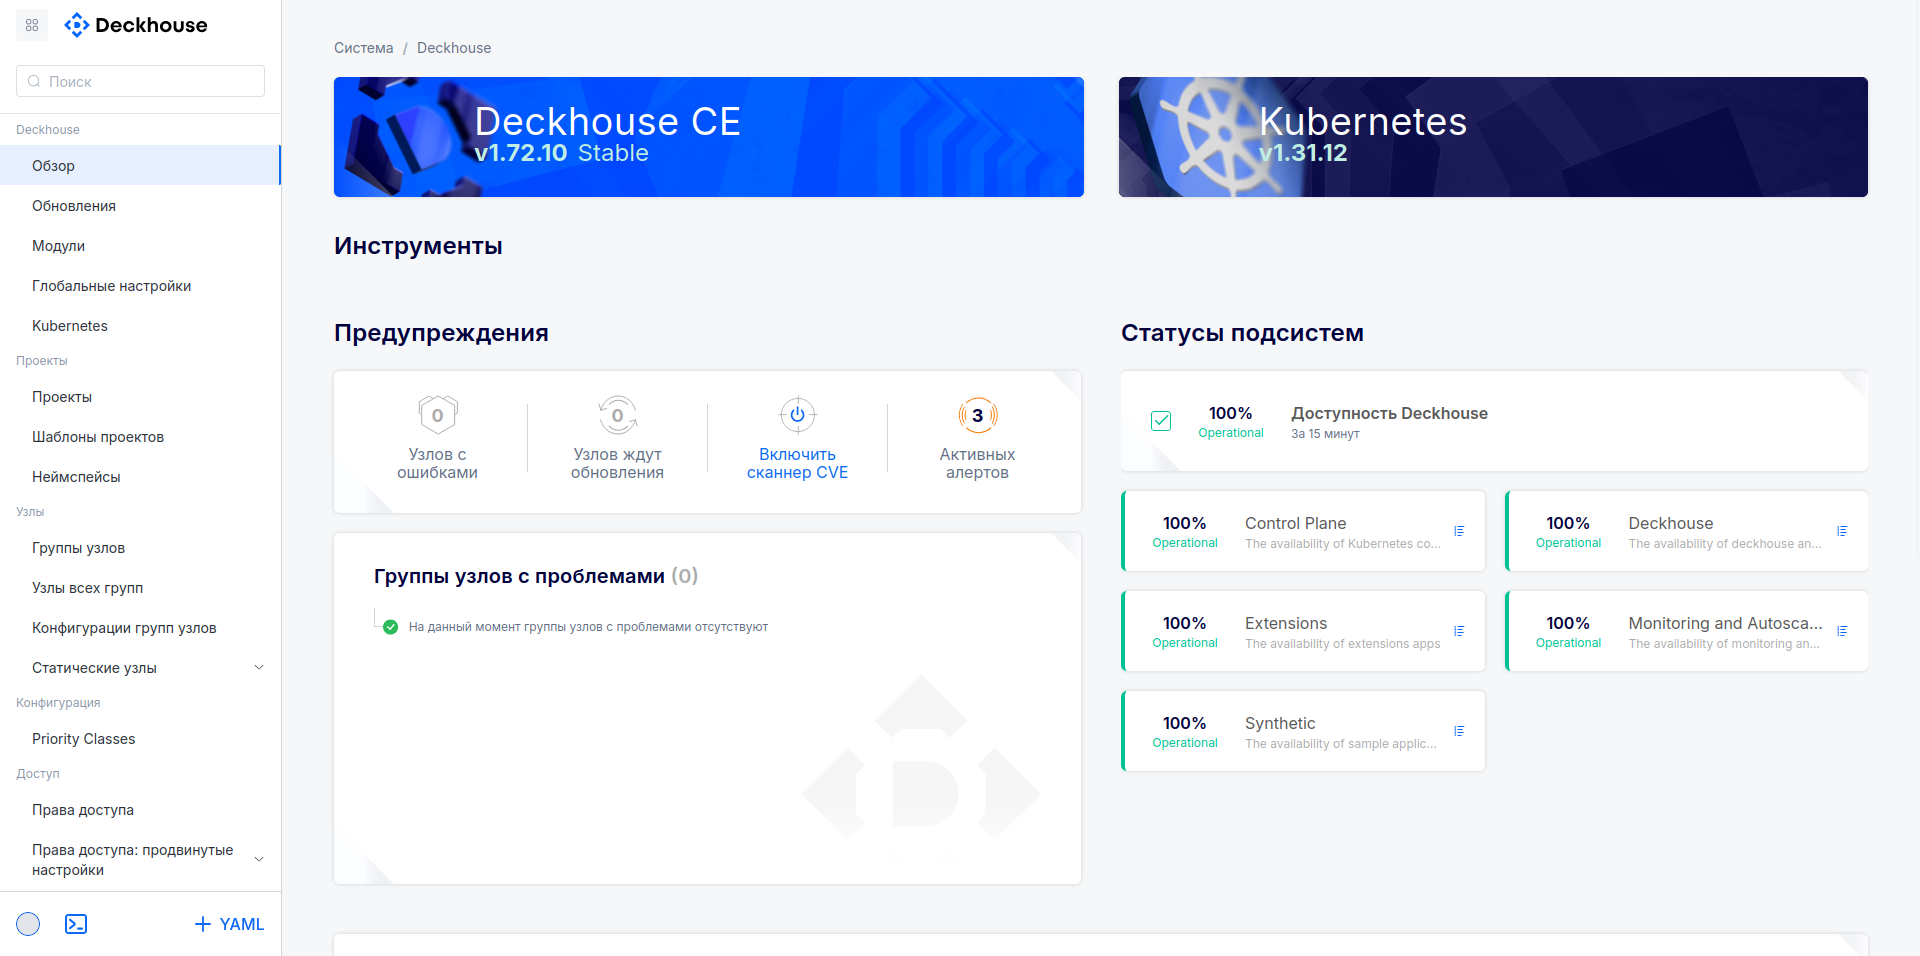
The web interface for managing the installed DKP cluster will open in the same window.
Follow these steps:
-
Install an Ingress controller.
Go to “Network” → “Load balancing” → “Ingress controllers” and create a new Ingress controller by clicking “Add” and selecting “Host port”.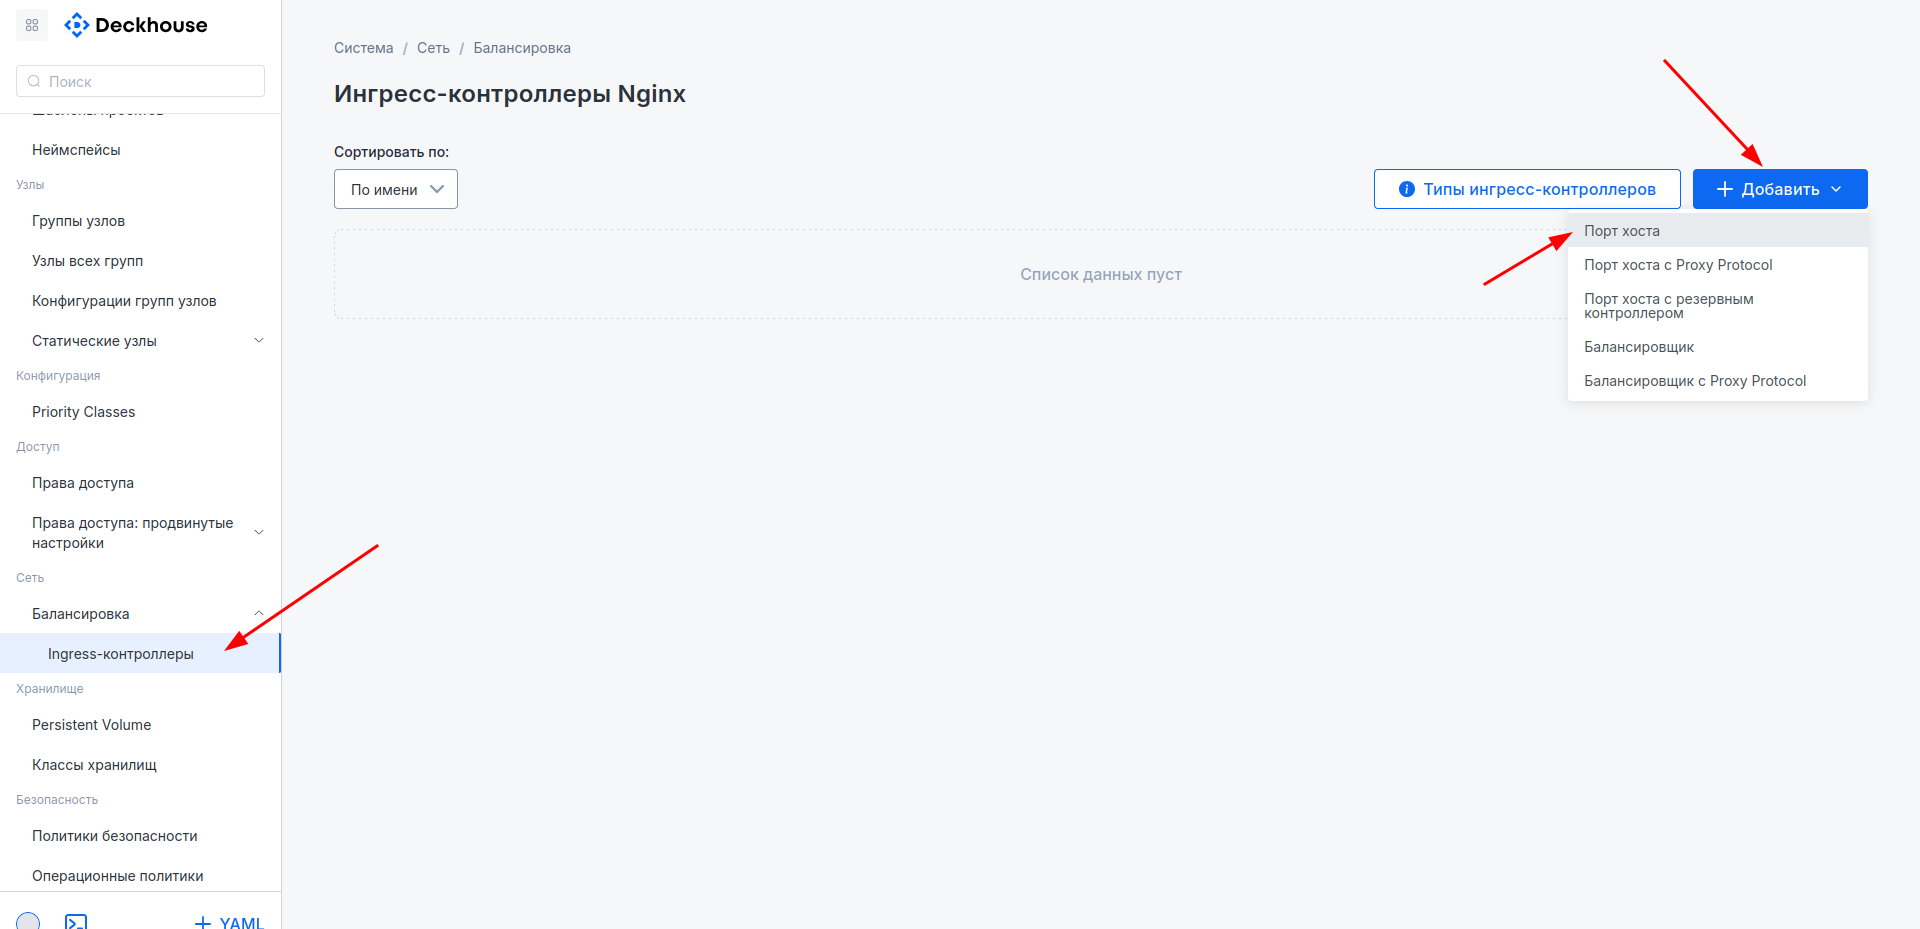
Enter a name and click “Create”.
If you need HTTPS access to cluster components, enable it in the “Default certificate” section.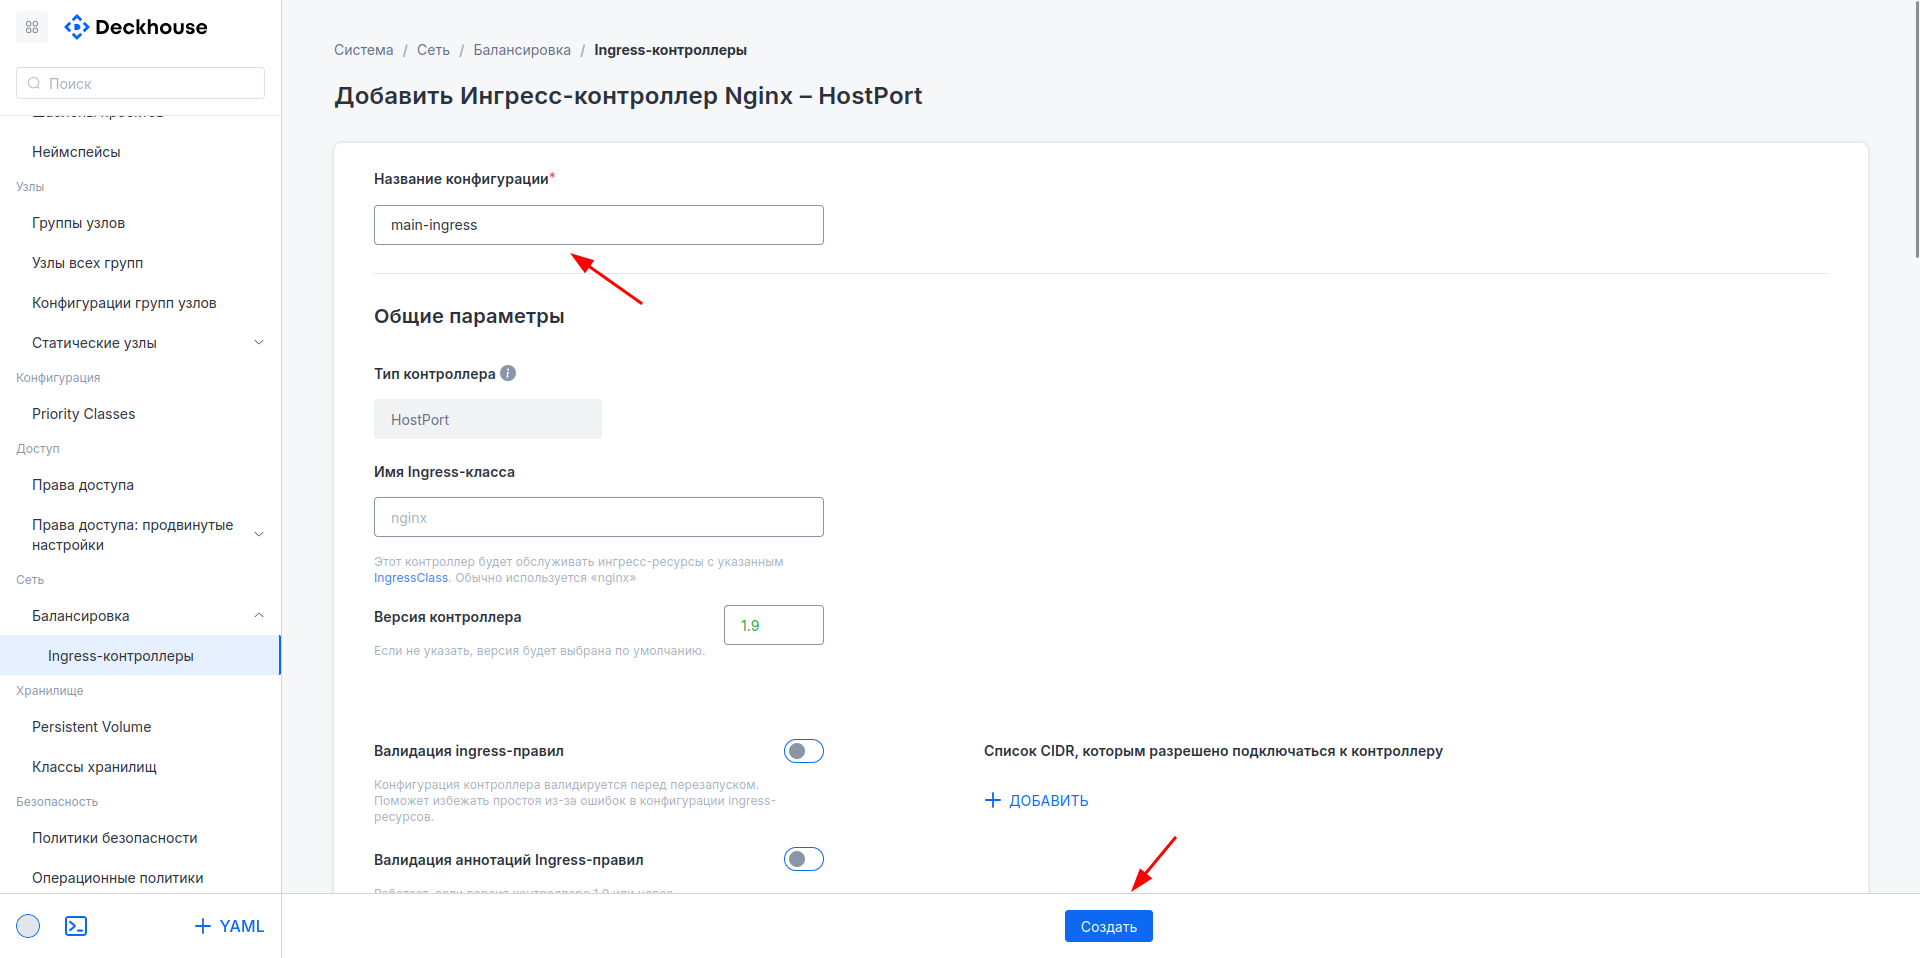
-
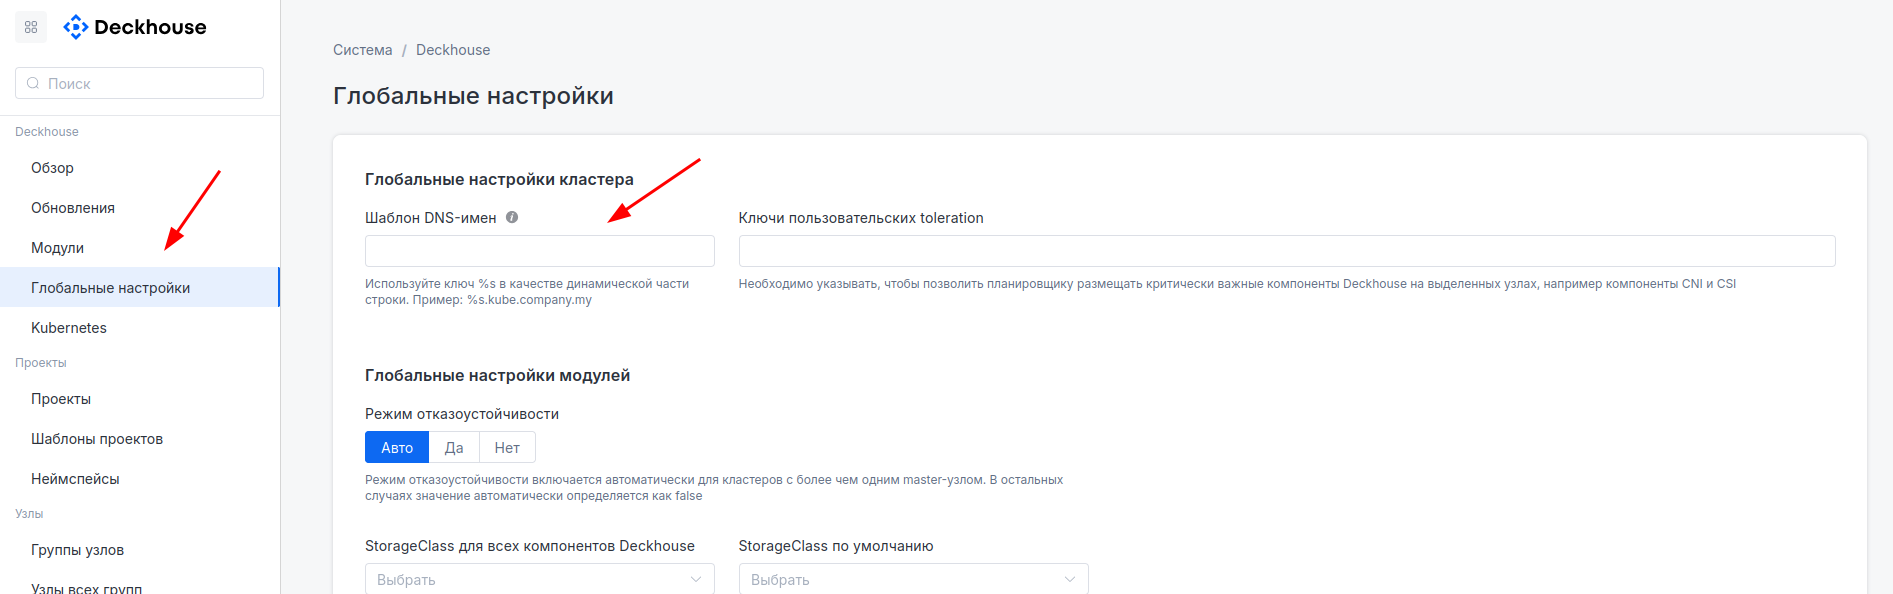
Configure the DNS name template to be used for cluster components.
The DNS name template is used to configure Ingress resources for system applications. For example, the Grafana UI is bound to the name
grafana. Then, for the template%s.kube.company.my, Grafana will be available atgrafana.kube.company.my, and so on.Go to “Deckhouse” → “Global settings” and enter the template in the “DNS name template” field.
Essentials
Deckhouse web UI
Try the web UI for managing the cluster and its main components.
Web service name: console
📚 Documentation
The documentation for the installed in your cluster version of Deckhouse.
Web service name: documentation
📊 Monitoring
Explore Grafana dashboards bundled with Deckhouse.
Web service name: grafana
To access Prometheus: /prometheus/
Learn more about themonitoring module.
👌 Status page
Get information about the overall status of Deckhouse and its components.
Web service name:
status
Get detailed SLA statistics for each component and time frame.
Web service name:
upmeter
🏭 Going to production
Prepare your cluster to receive traffic.
Use our checklist to make sure you haven’t forgotten anything.
Deploying your first application
⟳ Setting up a CI/CD system
Create a ServiceAccount to use for deploying to the cluster and grant it all the necessary privileges.
You can use the generated kubeconfig file in Kubernetes with any deployment system.
🔀 Routing traffic
Create a Service and Ingress for your application.
Learn more about the capabilities of the ingress-nginx module.
🔍 Monitoring your application
Add prometheus.deckhouse.io/custom-target: "my-app" and prometheus.deckhouse.io/port: "80" annotations to the Service created.
For more information, see the monitoring-custom module’s documentation.
Other features
⚖ Managing nodes
Run the following command to list nodegroups created in the cluster during the deployment process: kubectl get nodegroups. For more information, see the node-manager’s documentation.
You only need to make changes to minPerZone and maxPerZone parameters to scale the existing groups. If these two parameters are not equal, Deckhouse will automatically launch an autoscaler.
You need to create a new InstanceClass and a NodeGroup referring to it to create new groups.
What’s next?
Detailed information about the system and the Deckhouse Kubernetes Platform components is available in the documentation.
Please, reach us via our online community if you have any questions.