The module lifecycle stage: General Availability
The module has requirements for installation
How to use extended-monitoring-exporter
Attach the extended-monitoring.deckhouse.io/enabled label to the Namespace to enable the export of extended monitoring metrics. You can do it by:
- adding the appropriate helm-chart to the project (recommended method);
- adding it to
.gitlab-ci.yml(kubectl patch/create); - attaching it manually (
d8 k label namespace my-app-production extended-monitoring.deckhouse.io/enabled=""). - configuring via namespace-configurator module.
Any of the methods above would result in the emergence of the default metrics (+ any custom metrics with the threshold.extended-monitoring.deckhouse.io/ prefix) for all supported Kubernetes objects in the target namespace. Note that monitoring is enabled automatically for a number of non-namespaced Kubernetes objects described below.
You can also add custom labels with the specified value to threshold.extended-monitoring.deckhouse.io/something Kubernetes objects, e.g., d8 k label pod test threshold.extended-monitoring.deckhouse.io/disk-inodes-warning=30.
In this case, the label value will replace the default one.
If you want to override the default thresholds for all objects in a namespace, you can set the threshold.extended-monitoring.deckhouse.io/ label at the namespace level. For example:
d8 k label namespace my-app-production threshold.extended-monitoring.deckhouse.io/5xx-warning=20
This will replace the default value for all objects in the namespace that do not already have this label set.
You can disable monitoring on a per-object basis by adding the extended-monitoring.deckhouse.io/enabled=false label to it. Thus, the default labels will also be disabled (as well as label-based alerts).
Standard labels and supported Kubernetes objects
Below is the list of labels used in Prometheus Rules and their default values.
Note, that all the labels start with the threshold.extended-monitoring.deckhouse.io/ prefix. The value specified in a label is a number that sets the alert trigger threshold.
For example, the label threshold.extended-monitoring.deckhouse.io/5xx-warning: "5" on the Ingress resource changes the alert threshold from 10% (default) to 5%.
Non-namespaced Kubernetes objects
Non-namespaced Kubernetes objects do not need labels on the namespace, and monitoring on them is enabled by default when the module is enabled.
Node
| Label | Type | Default value |
|---|---|---|
| disk-bytes-warning | int (percent) | 70 |
| disk-bytes-critical | int (percent) | 80 |
| disk-inodes-warning | int (percent) | 90 |
| disk-inodes-critical | int (percent) | 95 |
| load-average-per-core-warning | int | 3 |
| load-average-per-core-critical | int | 10 |
Caution! These labels do not apply to
imagefs(/var/lib/dockerby default) andnodefs(/var/lib/kubeletby default) volumes. The thresholds for these volumes are configured completely automatically according to the kubelet’s eviction thresholds. The default values are available here; for more info, see the exporter.
Namespaced Kubernetes objects
Pod
| Label | Type | Default value |
|---|---|---|
| disk-bytes-warning | int (percent) | 85 |
| disk-bytes-critical | int (percent) | 95 |
| disk-inodes-warning | int (percent) | 85 |
| disk-inodes-critical | int (percent) | 90 |
Ingress
| Label | Type | Default value |
|---|---|---|
| 5xx-warning | int (percent) | 10 |
| 5xx-critical | int (percent) | 20 |
Deployment
| Label | Type | Default value |
|---|---|---|
| replicas-not-ready | int (count) | 0 |
The threshold implies the number of unavailable replicas in addition to maxUnavailable. This threshold will be triggered if the number of unavailable replicas is greater than maxUnavailable by the amount specified. Suppose replicas-not-ready is 0. In this case, the threshold will be triggered if the number of unavailable replicas is greater than maxUnavailable. If replicas-not-ready is set to 1, then the threshold will be triggered if the number of unavailable replicas is greater than maxUnavailable + 1. This way, you can fine-tune this parameter for specific Deployments (that may be unavailable) in the namespace with the extended monitoring enabled to avoid getting excessive alerts.
StatefulSet
| Label | Type | Default value |
|---|---|---|
| replicas-not-ready | int (count) | 0 |
The threshold implies the number of unavailable replicas in addition to maxUnavailable (see the comments on Deployment).
DaemonSet
| Label | Type | Default value |
|---|---|---|
| replicas-not-ready | int (count) | 0 |
The threshold implies the number of unavailable replicas in addition to maxUnavailable (see the comments on Deployment).
CronJob
Note that only the deactivation using the extended-monitoring.deckhouse.io/enabled=false label is supported.
How does it work?
The module exports specific Kubernetes object labels to Prometheus. It allows you to improve Prometheus rules by adding the thresholds for triggering alerts. Using metrics that this module exports, you can, e.g., replace the “magic” constants in rules.
Before:
(
  kube_statefulset_status_replicas - kube_statefulset_status_replicas_ready
)
> 1
After:
(
  kube_statefulset_status_replicas - kube_statefulset_status_replicas_ready
)
> on (namespace, statefulset)
(
  max by (namespace, statefulset) (extended_monitoring_statefulset_threshold{threshold="replicas-not-ready"})
)
How to explicitly enable the module…
You may explicitly enable or disable the module in one of the following ways:
-
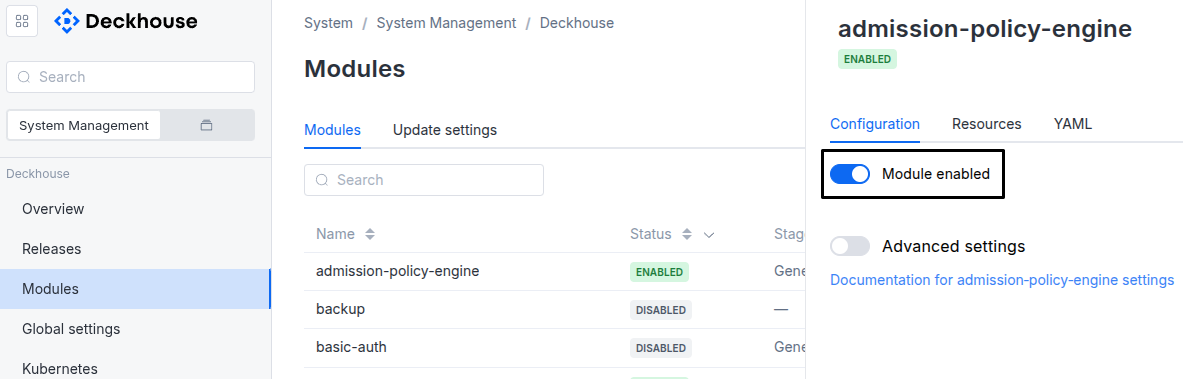
Via Deckhouse web UI. In the “System” → “System Management” → “Deckhouse” → “Modules” section, open the
extended-monitoringmodule and enable (or disable) the “Module enabled” toggle. Save changes.Example:
-
Via Deckhouse CLI (d8).
Use the d8 system module enable command for enabling, or d8 system module disable command for disabling the module (you need Deckhouse CLI (d8), configured to work with the cluster).
Example of enabling the module:
d8 system module enable extended-monitoring -
Using ModuleConfig
extended-monitoring.Set
spec.enabledtotrueorfalsein ModuleConfigextended-monitoring(create it if necessary);Example of a manifest to enable module
extended-monitoring:apiVersion: deckhouse.io/v1alpha1 kind: ModuleConfig metadata: name: extended-monitoring spec: enabled: true
You can configure the module in one of the following ways:
-
Via Deckhouse web UI.
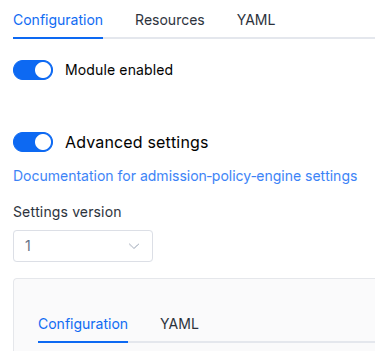
In the “System” → “System Management” → “Deckhouse” → “Modules” section, open the
extended-monitoringmodule and enable the “Advanced Settings” switch. Fill in the required fields in the “Configuration” tab or specify the module settings in YAML format on the “YAML” tab, excluding the settings section. Save the changes.Example:
You can also edit the ModuleConfig object
extended-monitoringon the “YAML” tab in the module settings window (“System” → “System Management” → “Deckhouse” → “Modules”, open the moduleextended-monitoring) by specifying the schema version in thespec.versionparameter and the necessary module parameters in thespec.settingssection. -
Via Deckhouse CLI (d8) (requires Deckhouse CLI (d8) configured to work with the cluster).
Edit the existing ModuleConfig
extended-monitoring(for more details on configuring Deckhouse, see the documentation) by executing the following command:d8 k edit mc extended-monitoringMake the necessary changes in the
spec.settingssection. If necessary, specify the schema version in thespec.versionparameter. Save the changes.You can also create a file with manifest for ModuleConfig
extended-monitoringusing the example below. Fill in thespec.settingssection with the required module parameters. If necessary, specify the schema version in thespec.versionparameter.Apply the manifest using the following command (indicate the manifest file name):
d8 k apply -f <FILENAME>Example of a manifest for ModuleConfig
extended-monitoring:apiVersion: deckhouse.io/v1alpha1 kind: ModuleConfig metadata: name: extended-monitoring spec: version: 2 enabled: true settings: # Module parameters from the "Parameters" section below.
Requirements
To the Deckhouse version: 1.68 and above.
To the versions of other modules:
-
prometheus: any version.
Conversions
The module is configured using the ModuleConfig resource, the schema of which contains a version number. When you apply an old version of the ModuleConfig schema in a cluster, automatic transformations are performed. To manually update the ModuleConfig schema version, the following steps must be completed sequentially for each version:
-
Updates from version 1 to 2:
If the
.imageAvailability.skipRegistryCertVerificationfield is set totrue, add.imageAvailability.registry.tlsConfig.insecureSkipVerify=true. Then, delete theskipRegistryCertVerificationfield from the object. If the.imageAvailabilityobject becomes empty after this change, delete it.
Parameters
Schema version: 2
-
-
objectsettings.certificatesSettings for monitoring the certificates in the Kubernetes cluster.
Default:
{}-
booleansettings.certificates.exporterEnabledEnables x509-certificate-exporter.
Default:
false
-
-
objectsettings.eventsSettings for monitoring the events in the Kubernetes cluster.
Default:
{}-
booleansettings.events.exporterEnabledEnables eventsExporter.
Default:
false -
stringsettings.events.severityLevelWhether to expose only crucial events.
Default:
OnlyWarningsAllowed values:
All,OnlyWarnings
-
-
objectsettings.imageAvailabilitySettings for monitoring the availability of images in the cluster.
Default:
{}-
stringsettings.imageAvailability.defaultRegistry
Default registry to use when an image name is not fully qualified.
If not set, index.docker.io is used by default.
Default:
index.docker.io -
booleansettings.imageAvailability.exporterEnabledEnables imageAvailabilityExporter.
Default:
true -
array of stringssettings.imageAvailability.forceCheckDisabledControllers
A list of controller kinds for which image is forcibly checked, even when workloads are disabled or suspended.
Specify
Allto check all controller kinds.Example:
forceCheckDisabledControllers: - Deployment - StatefulSet-
stringsettings.imageAvailability.forceCheckDisabledControllers.Element of the array
Allowed values:
Deployment,StatefulSet,DaemonSet,CronJob,All
-
-
array of stringssettings.imageAvailability.ignoredImagesA list of images to ignore when checking the presence in the registry, e.g.,
alpine:3.12orquay.io/test/test:v1.1.Example:
ignoredImages: - alpine:3.10 - alpine:3.2 -
stringsettings.imageAvailability.imageCheckInterval
Interval for checking container registries for image availability.
Supports Go-style duration format (e.g. “10s”, “10m”, “10h”).
If not specified, the default value is “60s”.
Default:
60s -
array of objectssettings.imageAvailability.mirrorsList of mirrors for container registries.
Example:
mirrors: - mirror: mirror.gcr.io original: docker.io - mirror: mirror.internal-registry.com original: internal-registry.com-
stringsettings.imageAvailability.mirrors.mirror
-
stringsettings.imageAvailability.mirrors.original
-
-
objectsettings.imageAvailability.registryConnection settings for container registry.
Default:
{}-
stringsettings.imageAvailability.registry.schemeContainer registry access scheme.
Default:
HTTPSAllowed values:
HTTP,HTTPS -
objectsettings.imageAvailability.registry.tlsConfigConnection settings for container registry.
Default:
{}-
stringsettings.imageAvailability.registry.tlsConfig.caRoot CA certificate to validate the container registry’s HTTPS certificate (if self-signed certificates are used).
-
booleansettings.imageAvailability.registry.tlsConfig.insecureSkipVerifyWhether to skip the verification of the container registry certificate.
Default:
false
-
-
-
-
objectsettings.nodeSelector
The same as in the pods’
spec.nodeSelectorparameter in Kubernetes.If the parameter is omitted or
false, it will be determined automatically. -
array of objectssettings.tolerations
The same as in the pods’
spec.tolerationsparameter in Kubernetes;If the parameter is omitted or
false, it will be determined automatically.-
stringsettings.tolerations.effect
-
stringsettings.tolerations.key
-
stringsettings.tolerations.operator
-
integersettings.tolerations.tolerationSeconds
-
stringsettings.tolerations.value
-
-