This module integrates various Flant services. It:
- Installs madison-proxy as an alertmanager for Prometheus in the cluster; registers with Madison.
- Sends stats required to calculate the cost of maintaining the cluster.
- Sends logs of the Deckhouse operator (these facilitate the debugging process).
- Configures SLA metrics collection.
Data collection
Where does Deckhouse send the data?
All data is sent through a single entry point. The connect.deckhouse.io service (hereinafter referred to as Connect or the Connect service) serves as a single entry point.
When sending data, each Deckhouse cluster submits a license key as a Bearer Token for authorization. The Connect service checks whether the key is valid and redirects the request to the target internal Flant service.
You must allow access to all IP addresses mapped to the following DNS names to send data from the cluster:
connect.deckhouse.io;madison-direct.deckhouse.io.
What data does Deckhouse send?
Learn about how to disable sending data by Deckhouse
Deckhouse sends the following cluster data:
- Statistics on cluster state:
- Kubernetes version;
- Deckhouse version;
- release channel;
- the number of nodes, etc.
- alerts sent to the Madison incident processing system.
- SLA metrics for Deckhouse components.
- Deckhouse operator logs.
- The way to connect to the cluster master nodes.
Statistics on cluster status
The flant-integration module collects metrics about the state of the cluster objects using shell-operator. Next, the Grafana agent sends the collected metrics over the Prometheus Remote Write protocol.
The data collected provides the basis for calculating the Managed Kubernetes service fee.
The average number of samples sent per cluster is 35 lines every 30 seconds.
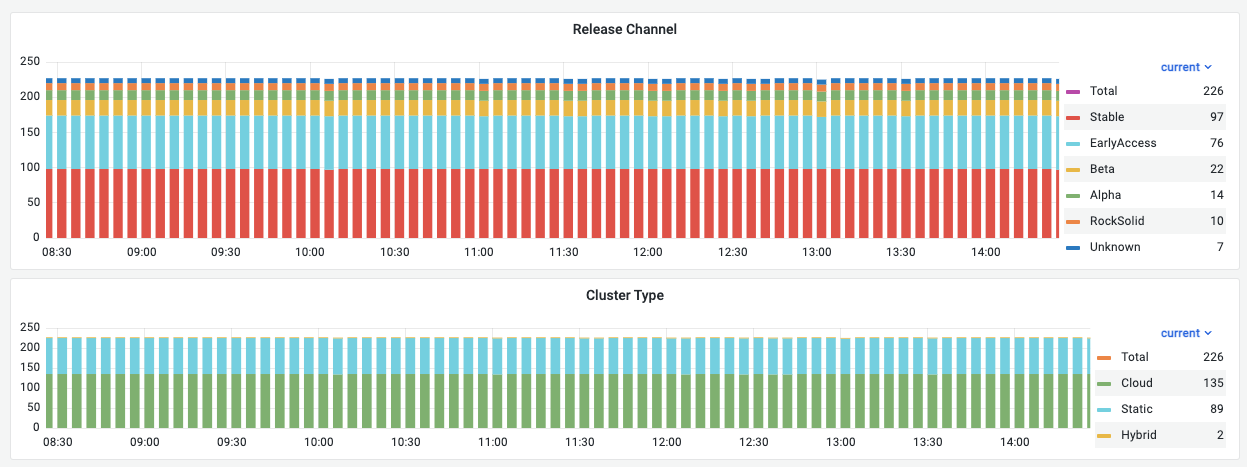
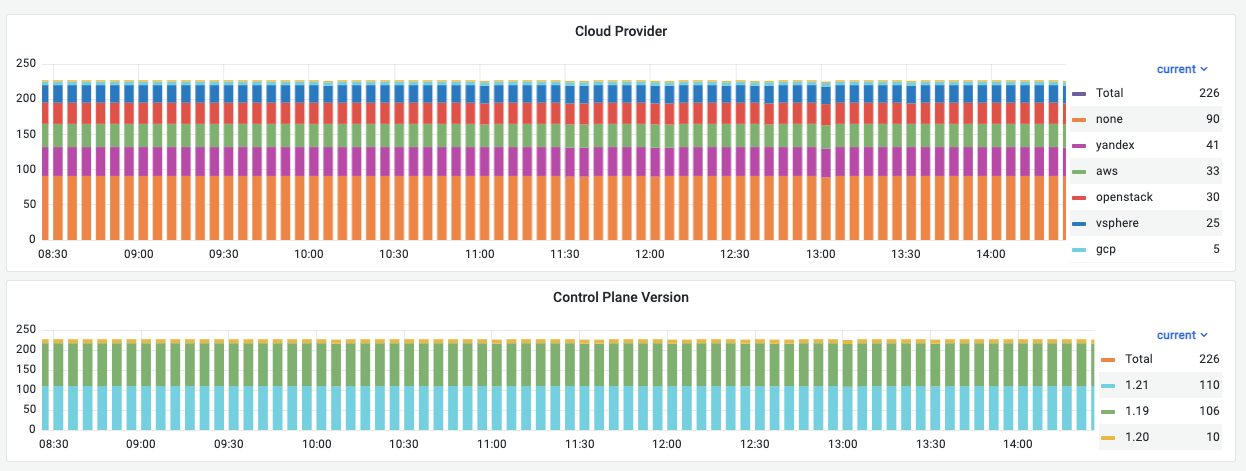
Here is an example of the data collected:


In addition to the metrics collected by the flant-integration module, the upmeter module collects the availability metrics to analyze SLA performance.
Madison notifications
Madison is a notification processing service integrated into Flant’s monitoring platform. Madison can handle alerts in the Prometheus format.
Once the new Deckhouse cluster is created:
- The cluster gets automatically registered in Madison using the license key.
- Madison supplies the cluster with the key needed for sending out alerts and notifications.
- Deckhouse finds all currently available Madison IP addresses using a DNS query for the
madison-direct.flant.comdomain. - Deckhouse creates a
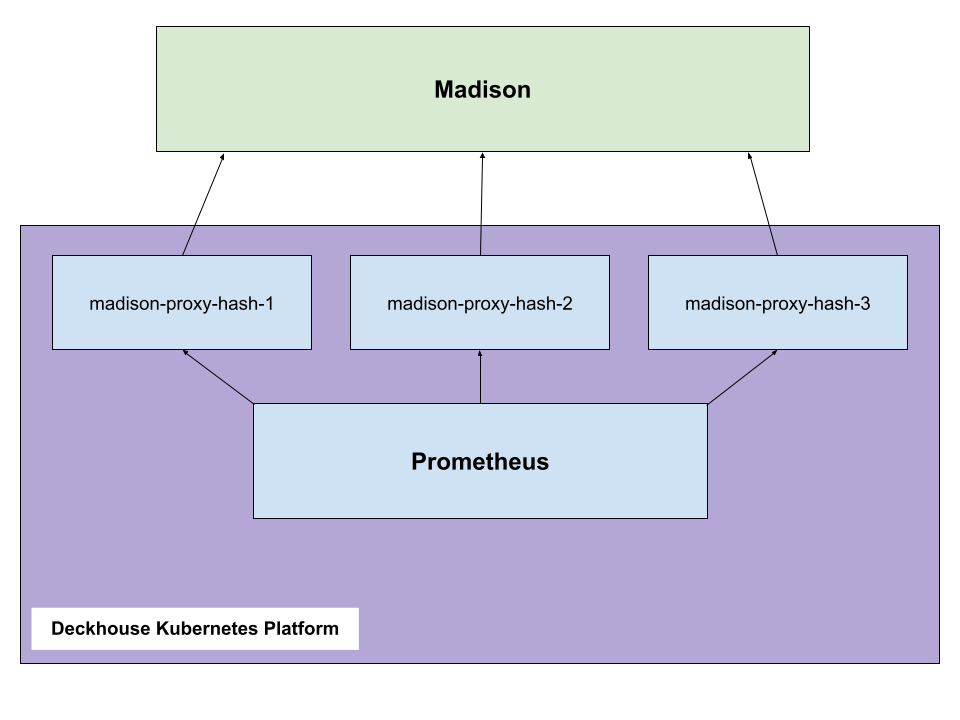
madison-proxyPod for each IP address. These are then used to receive Prometheus alerts.
Below is the scheme of sending alerts from the cluster to Madison:

On average, the bandwidth consumed by alerts sent from the cluster is 2 kb/s. However, keep in mind that the more incidents occur in a cluster, the more data is sent.
Deckhouse operator logs
The Deckhouse operator is the centerpiece of the entire cluster. To collect the data needed to diagnose problems in the cluster, the flant-pricing module configures the log-shipper module for sending logs to Flant’s Loki repository (though not directly but via the Connect service).
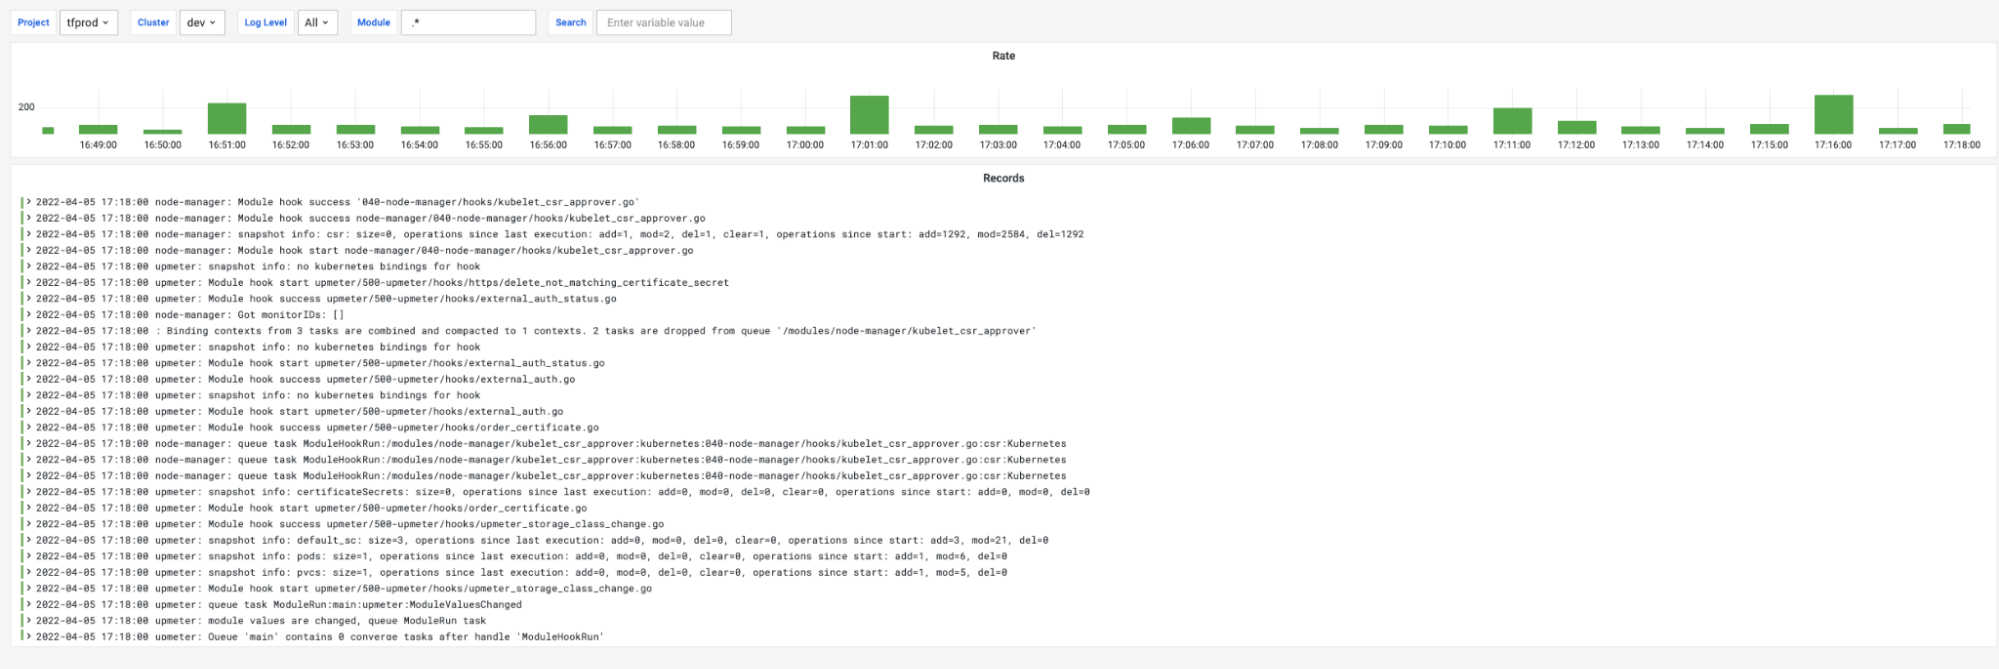
The logs contain information only about Deckhouse components (no secret cluster data). Sample messages are shown in the screenshot below. The data collected helps determine what and when the Deckhouse operator performed specific actions and with what results.
Below is an example of Deckhouse operator logs:

During Deckhouse release switching, an average of 150 log entries per minute is sent. During normal operation, an average of 20 log entries per minute is sent.
SLA metrics
The flant-pricing module configures the upmeter module to send metrics that allow Flant to monitor service level agreement (SLA) compliance for cluster and Deckhouse components.
How do I disable sending data by Deckhouse?
Disable the flantIntergation module to deactivate registering in Madison and sending data.
Caution! The flant-integration module must be disabled in the following cases:
- In test clusters deployed for experimenting or similar purposes. This rule does not apply to the development and test clusters you need to get alerts from.
- In all clusters withdrawn from Flant support.
How is the cost calculated?
The billing type is automatically detected for each NodeGroup (except for dedicated masters). The following types of node billing are available:
- Ephemeral — if a node is a member of a NodeGroup of the Cloud type, it automatically falls under the Ephemeral category.
- VM — this type is set automatically if the virtualization type for the node was defined using the virt-what command.
- Hard — all other nodes automatically fall under this category.
- Special — this type must be manually set for the NodeGroup (it includes dedicated nodes that cannot be “lost”).
If there are nodes in the cluster with the billing type Special or the automatic detection did not work correctly, you can always manually set the correct billing type.
For setting the billing type on the nodes, we recommend adding the annotation to the NodeGroup to which the node belongs:
kubectl patch ng worker --patch '{"spec":{"nodeTemplate":{"annotations":{"pricing.flant.com/nodeType":"Special"}}}}' --type=merge
If there are nodes with different billing types within the single NodeGroup, you can add an annotation separately to each Node object:
kubectl annotate node test pricing.flant.com/nodeType=Special
Determining the statuses of the terraform states
The module relies on metrics exported by the terraform-exporter component. They contain the statuses for matching the resources in the cloud/cluster with those specified in the *-cluster-configuration configurations.
The original terraform-exporter metrics and their statuses
candi_converge_cluster_statusdetermines whether the underlying infrastructure matches the configuration:error— processing error; see exporter log for details;destructively_changed—terraform planimplies changing objects in the cloud and deleting some of them;changed—terraform planimplies changing objects in the cloud without deleting them;ok;
candi_converge_node_statusdetermines whether the individual Nodes match the configuration:error— processing error; see exporter log for details;destructively_changed—terraform planimplies changing objects in the cloud and deleting some of them;abandoned— there is an excess Node in the cluster;absent— there are not enough Nodes in the cluster;changed—terraform planimplies changing objects in the cloud without deleting them;ok;
candi_converge_node_template_statusdetermines whether thenodeTemplatefor themastermatches theterranodeNodeGroup:absent— there is no NodeGroup in the cluster;changed— the parameters of thenodeTemplatemismatch;ok.
The resulting metrics of the `flant-integration’ module and the algorithm for generating them
If the
terraform-managermodule is disabled in the cluster, the status in all metrics will benone. This status should be interpreted as: the state is not in the cluster and is not supposed to be.
- The status of the cluster (basic infrastructure):
- The value of the
candi_converge_cluster_statusmetric is used; - If there is no metric,
missingis used;
- The value of the
- The
masterstatus of the NodeGroup:- The module uses the worst-case status provided by either of the
candi_converge_node_statusandcandi_converge_node_template_statusmetrics forng/master; - If both metrics are missing,
missingis used;
- The module uses the worst-case status provided by either of the
- The individual status for each
terranodeNodeGroup:- The module uses the worst-case status provided by either of the
candi_converge_node_statusandcandi_converge_node_template_statusmetrics forng/<nodeGroups[].name>;
- The module uses the worst-case status provided by either of the
- The aggregate status for all the
terranodeNodeGroups:- The module uses the worst-case status based on the statuses retrieved for all
terranodeNodeGroups.
- The module uses the worst-case status based on the statuses retrieved for all
The
missingstatus will be used in the final metrics if theterraform-exportermetrics return statuses that are not defined in the module. In other words, themissingstatus also serves as afallbackstatus for a situation when there is a problem with the definition of the worst-case status.
How is the worst-case status determined??
We evaluate the “worseness” of the status in terms of the ability to automatically apply existing changes.
It is selected according to priority from the following table of known statuses:
| Status | Description |
|---|---|
| error | Error processing state by the terraform-exporter; see its log for details. |
| destructively_changed | terraform plan implies changing objects in the cloud and deleting some of them. |
| abandoned | There is an excess Node in the cluster. |
| absent | The cluster lacks a Node or NodeGroup. |
| changed | terraform plan implies changing objects in the cloud without deleting them. |
| ok | No discrepancies were found. |