The module lifecycle stage: Generally available version
The module has requirements for installation
Deckhouse Commander internals
Deckhouse Commander components
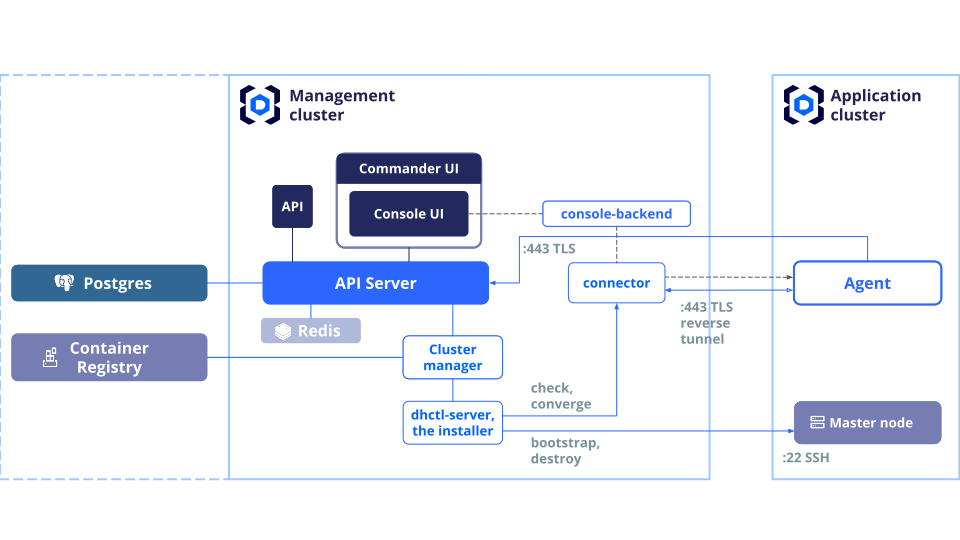
Deckhouse Commander has an external dependency — PostgreSQL database.
The API server is the central component. Data is stored in PostgreSQL. Options for installing Deckhouse Commander with a DBMS are listed in the Installation section.
The API server provides both external APIs — web applications and for external integration — and internal APIs for working with clusters.
Web Application uses the API to manage clusters and other Deckhouse Commander entities. It also provides
seamless access to the application cluster’s admin web UI (DKP UI, the console module):
browsing Kubernetes resources and the web terminal. Requests to the application cluster’s
Kubernetes API are routed through Deckhouse Commander under the same account the user signed in with.
Asynchronous operations — tasks — are used to manage clusters. The cluster manager is a service that monitors tasks and executes them. Tasks can be cluster installation, cluster deletion, or cluster state reconciliation with the specified configuration.
When a cluster is created, an installation task is created. Then a free cluster manager instance takes the task to work on. The same happens for cluster update, delete, or reconciliation operations.
After acquiring a task, the cluster manager determines which Deckhouse Kubernetes Platform (DKP) version the task requires, starts or reuses a running dhctl server of that version, and runs the required operation in it. One dhctl server performs only one operation at a time. The cluster manager automatically starts and stops dhctl servers and scales the number of their replicas based on the number of incoming tasks. This lets the system adapt to the current load.
Every application cluster runs the commander-agent module. Deckhouse Commander enables it
automatically. After the initial cluster installation, the agent opens a reverse TLS tunnel to
the management cluster and keeps it open. With the tunnel in place, Deckhouse Commander does not need
inbound network reachability to the application cluster’s Kubernetes API. The tunnel carries
traffic to the application cluster’s Kubernetes API: it is used during Check (check) and
Change (converge) phases to reconcile the application cluster’s infrastructure
configuration with the desired configuration (creating, deleting, and upgrading nodes, upgrading
DKP components), and by the cluster admin web UI to retrieve objects from the application
cluster’s Kubernetes API.
Cluster telemetry is sent through the same Deckhouse Commander HTTPS API endpoint that the agent uses to establish the tunnel. Telemetry includes basic metrics (total number of CPUs, total memory, number of nodes, and total storage), DKP and Kubernetes versions, and DKP component availability.
The resource conversion mechanism also uses this same Deckhouse Commander HTTPS API: the agent requests the desired configuration, applies it in the application cluster, and sends back the status and the applied configuration.
Interaction with the infrastructure provider API is separate and can originate from either the
management cluster or the application cluster, without using the commander-agent reverse TLS
tunnel.
Direct SSH to a master node (22/TCP) is used during the initial cluster installation and
deletion, during attach and detach operations, and as a fallback when commander-agent cannot
establish or hold the reverse tunnel. The agent itself runs on the application cluster’s master
nodes by default.
When the billing feature flag is on, Deckhouse Commander also collects resource-consumption metrics from every application cluster to calculate cost. These metrics are delivered to a dedicated long-term Prometheus in the management cluster through Prometheus remote write. Remote write uses the same Deckhouse Commander HTTPS API endpoint where the agent opens the tunnel, but it is a separate push mechanism from the application cluster, not traffic over the reverse TLS tunnel. Deckhouse Commander renders billing dashboards and exports CSV cost reports from the stored data.
On the application-cluster side, commander-agent handles billing integration:
- it configures the remote-write stream of resource-consumption metrics;
- it reports node group, cloud instance-class, and StorageClass descriptions to Deckhouse Commander — these are used in the billing UI to bind compute classes and storage classes to real cluster objects;
- it labels every node with
billing.commander.deckhouse.io/name, so the node can be matched to its compute class and priced according to the active tariff.
Deckhouse Commander builds the binding contract (which nodes should carry which label) and delivers it to the agent. The agent directly patches Node objects, adding the label to every node that belongs to the bound node group.
Component placement and networking
Deckhouse Commander can be enabled in any DKP cluster. For the application clusters it manages, that cluster becomes the management cluster. Other Deckhouse system modules can run in the same cluster alongside Deckhouse Commander. In a shared setup, user workloads may also run in this cluster — on separate nodes.
By default, Deckhouse Commander runs on nodes with the commander role (label
node-role.deckhouse.io/commander); if there are none, it falls back to system nodes
(node-role.deckhouse.io/system). To pin Deckhouse Commander to specific nodes, set the
nodeSelector parameter. If those nodes carry a
taint, also set tolerations. Billing components
inherit the same settings.
commander-agent runs in every application cluster and, by default, on master nodes. It keeps a
persistent reverse TLS tunnel to the management cluster, so during normal operation Deckhouse Commander
does not open inbound connections to the application cluster’s Kubernetes API. Direct SSH to a
master node (22/TCP) is used during the initial cluster installation, deletion, attach and detach
operations, and as a fallback when the reverse tunnel is unavailable.
Network connectivity requirements
The following network connectivity is required between the management and application clusters:
- 22/TCP from dhctl servers to all master nodes of application clusters — for the initial cluster installation, deletion, attach and detach operations, and as a fallback when the reverse tunnel is unavailable.
- Access from dhctl servers to cloud provider APIs — for managing infrastructure resources of application clusters.
- 443/TCP from the application cluster to the management cluster — through ingress on the
management cluster frontend nodes. The actual port depends on the ingress controller settings.
Traffic goes to two domains:
- Deckhouse Commander domain (
commander.<publicDomainTemplate>) —commander-agentuses it to establish the reverse TLS tunnel, send telemetry, and run the configuration conversion mechanism. Prometheus in the application cluster also sends billing remote write data to the/prometheus/api/v1/writepath on this same domain. Through the reverse tunnel, Deckhouse Commander accesses the application cluster’s Kubernetes API for Check and Change phases and the cluster admin web UI. - Dex domain (
dex.<publicDomainTemplate>) — Dex in the application cluster connects to it for OIDC discovery and token validation. This is required forDexProvider/commander, which lets the application cluster trust accounts from the management cluster.
- Deckhouse Commander domain (
- Access to the container registry from which the dhctl image is pulled — from the nodes running the cluster manager, because it accesses the registry directly, and from the nodes running dhctl servers, because those nodes pull the image of the required dhctl version.
The “agent → management cluster” channel only works over HTTPS. Running Deckhouse Commander without HTTPS is not supported.
By default, the CA certificate that application clusters trust for this channel is detected
automatically from the web UI’s TLS certificate. If HTTPS is terminated by an external load
balancer whose certificate is not visible to Deckhouse Commander, set the
customCA parameter to the PEM-encoded CA certificate that application clusters should trust
instead.
Network quality requirements and timeouts
Deckhouse Commander is designed to work over the public internet and tolerates unstable network links. There are no strict latency requirements — all interactions use retry logic and persistent connections with automatic reconnection.
Key timeouts that affect operation:
| Component | Parameter | Value |
|---|---|---|
| SSH (bootstrap, destroy, attach, detach) | Connect timeout | 10 sec |
| SSH | KeepAlive interval | 15 sec |
| Agent → Deckhouse Commander API (all requests, including resource conversion) | HTTP timeout | 30 sec |
| Agent → Deckhouse Commander API | Retry on error | up to 3 attempts |
| Agent: resource sync interval | Converge interval | 30 sec |
| Reverse tunnel (AMPG) | TCP KeepAlive | enabled (OS default) |
| Reverse tunnel (AMPG): backend connection wait | Acquire timeout | 60 sec |
| Dex: ID token lifetime | idTokenTTL |
10 min (configurable) |
| Dex: auth request lifetime | authRequests |
10 min |
| Prometheus remote write | Send timeout | 30 sec (Prometheus default) |
When connectivity between the application and management clusters is lost:
- The reverse TLS tunnel (yamux) automatically reconnects on disconnect.
- The agent continues trying to reach the Deckhouse Commander API every 30 seconds.
- Prometheus buffers remote write metrics and will deliver them once connectivity is restored.
Application cluster configuration and resource synchronization
Each application cluster is synchronized through two independent channels — infrastructure configuration and Kubernetes resources have their own executors and sources of truth. These are two separate processes, even though both are shown on the cluster page.
Infrastructure configuration: Change and Check operations
Infrastructure configuration covers the tabs in the Infrastructure group on the cluster page: Kubernetes, Placement, Post-bootstrap script, and Connection. Deckhouse Commander applies and verifies this configuration directly from the management cluster:
- Change brings the cluster infrastructure — nodes, control plane, initial DKP configuration, provider resources — to the desired state. It runs on cluster creation and when edits to the infrastructure tabs are saved in the web UI. In the Auto change application mode (see below) it runs automatically; in Manual mode it goes through a change request that requires user confirmation.
- Check compares the desired and the actual infrastructure state without making changes. It runs automatically at the configured frequency (the Reconciliation Interval in the workspace or per-cluster parameters).
If an operation fails, retry it manually with the Retry button on the cluster page.
The change application mode and the reconciliation interval are configured on the workspace Parameters → Settings tab and may be overridden per cluster.
These settings do not control Kubernetes resource group synchronization. When the change
application mode is switched from Auto to Manual, commander-agent continues to
synchronize resource groups inside the application cluster according to their control modes.
Kubernetes resource groups: agent-driven synchronization
The “Kubernetes” group on the cluster page contains numbered tabs — Kubernetes resource groups.
Each group is a set of YAML manifests that commander-agent applies inside the application
cluster. These groups are unrelated to the Change and Check operations: a separate
agent loop reconciles them, independently of any infrastructure operations that may be
running at the same time.
Each group has one of the following synchronization modes, set in the cluster template and switchable on the cluster page:
- Force Creation — the agent applies the group’s manifests on every reconcile cycle and restores any modified or deleted resources;
- Create on Install — the group’s resources are created only during cluster installation. The agent does not control them during the cluster lifecycle; subsequent in-cluster edits are not reverted;
- Ignored — group control is disabled in Deckhouse Commander: previously applied resources stay in the application cluster, but the agent stops synchronizing them. After that the resources become ordinary Kubernetes objects — they can be edited or deleted manually.
Issues with commander-agent (loss of connectivity, errors when applying manifests) surface on
the cluster page: in the overall cluster status, the synchronization badge next to the cluster
name, and the Kubernetes tab (per-group and per-resource details). See Cluster
status in the user guide for the full list of cluster statuses.
Protection of controlled resources
To prevent out-of-band changes from drifting away from the desired configuration, resources under
active synchronization are protected from external modifications. The protection covers resources
from groups in “Force Creation” mode and Deckhouse Commander’s own service resources (DexProvider, billing,
RBAC, projects, agent secrets). An attempt to edit or delete such a resource via d8 k is
rejected by the application cluster’s API server. To exempt a group from this protection, switch
it to “Ignored” — after that its resources become ordinary Kubernetes objects.
A subset of Deckhouse Commander’s service resources (RBAC, projects, Dex and billing configurations) is protected more strictly: when the corresponding group leaves Deckhouse Commander control or its source becomes temporarily unavailable, such resources are deleted rather than left in the cluster without Deckhouse Commander supervision.
Enabling and disabling Deckhouse Commander capabilities
Certain Deckhouse Commander capabilities are enabled and disabled via the commander ModuleConfig,
field spec.settings.featureFlags. Apply changes in the management cluster where Deckhouse Commander runs.
Billing and cost management — billingEnabled
| Parameter | Description |
|---|---|
| Default | Off (false) until billingEnabled: true is set explicitly |
| When enabled | Billing components are deployed; the Billing section appears in the UI |
| When disabled | Set billingEnabled: false |
Enable:
d8 k patch mc commander --type merge --patch '{"spec":{"settings":{"featureFlags":{"billingEnabled":true}}}}'After billing is enabled, the Billing section becomes available in the top menu on pages outside workspaces, for
example in the Workspaces section, or at URL {COMMANDER_ADDRESS}/billing/.
In addition, the commander-agent component in every application cluster starts:
- configuring the local Prometheus to send resource consumption metrics (CPU, memory, storage) to Prometheus in the management cluster — a PrometheusRemoteWrite resource is created in the application cluster for this purpose. See How Deckhouse Commander calculates cost for details;
- sending Deckhouse Commander the descriptions of node groups, cloud-provider instance classes, and Kubernetes storage classes — these are used in the billing UI to bind compute classes and storage classes to real cluster objects;
- adding a service label
billing.commander.deckhouse.io/nameto every node, with the name of the compute class the node belongs to. Deckhouse Commander uses this label to match the node with its compute class and apply the price defined in the current tariff to the node’s consumption.
Deckhouse Commander builds the binding contract (node group → label value) and delivers it to the agent. The agent directly patches Node objects, adding the label to every node of the bound node group.
Consumption metrics are stored in a dedicated billing Prometheus (billing-prometheus) in the
management cluster. It stores only the data required for cost calculation: container CPU and
memory consumption, pod and PVC resource requests, volume usage, pod phases, controller-to-pod
relationships, namespace, pod, and node labels, and PVC information.
Prometheus in the application cluster sends these data to the management cluster through
Prometheus remote write over the Deckhouse Commander HTTPS API. This is a separate Prometheus HTTP(S)
request, commander-agent does not send metrics itself. The agent configures the
PrometheusRemoteWrite resource and passes connection parameters to Prometheus.
Billing metadata is stored in the Deckhouse Commander database. This includes tariffs, compute classes,
storage classes, resource bindings, report schedules, and billing accounts together with their
operation history. Generated reports use separate billing-reports storage.
When billing is enabled, every workspace must be linked to a billing account: while the account has funds, its workspaces work as usual, and once the balance becomes non-positive, starting the installation of new clusters in them is blocked (clusters that are already running keep working). Accounts are not created automatically for existing workspaces — after an upgrade the billing administrator sees the list of unlinked workspaces on the “Billing accounts” tab and links them manually. The workflow is described in the Billing accounts section of the billing documentation.
See the billing documentation for how this data is used to compute cost.
If the section does not appear, check access management in the billing documentation.
Disable:
d8 k patch mc commander --type merge --patch '{"spec":{"settings":{"featureFlags":{"billingEnabled":false}}}}'After disabling, if needed manually delete remaining resources:
d8 k -n d8-commander delete pvc -l app=billing-reports
d8 k -n d8-commander delete pvc -l app=billing-prometheus
User documentation: Billing and cost management.
Projects — projectsEnabled
| Parameter | Description |
|---|---|
| Default | Off (false) until projectsEnabled: true is set explicitly |
| When enabled | The Projects section is available in the UI |
| When disabled | Set projectsEnabled: false |
Enable:
d8 k patch mc commander --type merge --patch '{"spec":{"settings":{"featureFlags":{"projectsEnabled":true}}}}'Disable:
d8 k patch mc commander --type merge --patch '{"spec":{"settings":{"featureFlags":{"projectsEnabled":false}}}}'User documentation: User guide — Projects.
Management cluster registry — showDefaultRegistry
| Parameter | Description |
|---|---|
| Default | On (true) until showDefaultRegistry: false is set explicitly |
| When enabled | Every workspace automatically gets the management cluster registry — with the address and credentials of the registry the management cluster is installed from. If it is deleted, it is created again on the next Deckhouse Commander update |
| When disabled | The management cluster registry is not created — neither when a workspace is created nor on a Deckhouse Commander update. Existing management cluster registries that no clusters use are deleted |
Disabling is useful when workspaces are handed out to customers and the address and credentials of the management cluster registry must not be visible to them.
While the flag is disabled, Deckhouse Commander checks the existing management cluster registries on every update:
- if no clusters use the registry (or only archived ones do), it is deleted. The deletion is recorded in the workspace change history with the system as the author;
- if at least one unarchived cluster uses the registry, the registry stays and keeps working. To free it, switch the clusters to another registry or archive them. Then delete the registry manually in the workspace registries section — or it is deleted on the next Deckhouse Commander update.
The flag does not affect registries created manually (even with the same parameters) or registries that appeared in the workspace when a cluster was transferred or attached.
Disable:
d8 k patch mc commander --type merge --patch '{"spec":{"settings":{"featureFlags":{"showDefaultRegistry":false}}}}'Enable:
d8 k patch mc commander --type merge --patch '{"spec":{"settings":{"featureFlags":{"showDefaultRegistry":true}}}}'After enabling, the management cluster registry is created in every workspace that does not have one. Registries deleted earlier are not restored — new ones are created with the current parameters.
Audit log retention — auditsRetentionDays
| Parameter | Description |
|---|---|
| Default | Off — the parameter is omitted; audit records in the Deckhouse Commander database are not deleted automatically |
| When a value is set | A daily CronJob removes audit records older than the specified number of days |
| Valid value | A whole number of days written as digits only, for example 30, 90, or 365 |
Enable automatic cleanup:
d8 k patch mc commander --type merge --patch '{"spec":{"settings":{"featureFlags":{"auditsRetentionDays":90}}}}'Deckhouse Commander stores a change history for entities in PostgreSQL indefinitely. When
auditsRetentionDays is set, the audits-cleaner CronJob in the d8-commander namespace runs once a
day and removes audit records older than the specified number of days.
For example, with auditsRetentionDays: 30, records from 31 or
more days ago are removed; records from exactly 30 days ago are kept.
To turn off automatic cleanup, remove auditsRetentionDays from featureFlags in the commander
ModuleConfig.
User documentation: User guide — Audit.
Archive retention — archiveRetentionDays
| Parameter | Description |
|---|---|
| Default | Off — the parameter is omitted; archived clusters and cluster templates are not deleted automatically |
| When a value is set | A daily CronJob permanently deletes archived clusters and cluster templates older than the specified number of days |
| Valid value | A whole number of days written as digits only, for example 30, 90, or 365 |
Enable automatic cleanup:
d8 k patch mc commander --type merge --patch '{"spec":{"settings":{"featureFlags":{"archiveRetentionDays":90}}}}'Deckhouse Commander keeps archived clusters and cluster templates until an administrator restores or permanently deletes
them. When archiveRetentionDays is set, the archives-cleaner CronJob in the d8-commander namespace runs once a day
and permanently deletes archived clusters and cluster templates older than the specified number of days.
For example, with archiveRetentionDays: 30, archives from 31 or more days ago are removed;
archives from exactly 30 days ago are kept.
A cluster template that is still referenced by any cluster (including an archived one) is skipped until those clusters
are purged. Inventory catalogs are not cleaned by this job. Permanent deletion does not remove audit records — audit
retention is controlled separately by auditsRetentionDays.
To turn off automatic cleanup, remove archiveRetentionDays from featureFlags in the commander
ModuleConfig.
Cluster creation approval
Cluster creation approval adds a business approval step before cluster installation: instead of starting the installation, Deckhouse Commander creates an approval request and waits for a decision from an approver.
Approval is enabled per workspace and applies to all of its clusters. For now it covers only installing a cluster. Applying configuration changes, deletion, and detachment do not require this business approval. Extending approval to other cluster operations is planned for future releases.
Confirmation of destructive infrastructure changes is a separate mechanism and keeps working independently. Approval
requests cannot be approved through the Integration API — an attempt returns 409 with the
approval_flow_not_supported code.
Enabling approval and assigning approvers
The approval settings live in the workspace: open it, click the gear icon in the top bar, choose “Parameters” and go
to the section for cluster creation approval. The section is visible with the get permission on
workspacerolebindings and editable with update.
- Turn on the “Require approval for cluster creation” toggle.
- In the “Approvers” field, add users or groups. Subjects are entered with the
user:andgroup:prefixes, for exampleuser:admin@example.comorgroup:web. At least one approver is required to enable approval. - Save the settings.
Deckhouse Commander grants the selected subjects the workspace role cluster-change-approver automatically, through
the autogenerated-cluster-change-approvers binding. Any member of an assigned group can see a request and approve or
reject it.
The field also shows subjects that hold the right through another workspace role: they cannot be removed here, the right is revoked in access management. The permission model is described in Cluster creation approval, and the user flow in Approving cluster creation.
Operating the approval flow
Replacing an approver. If an approver is unavailable — blocked in the external IdP, away on leave — pending requests stay pending. Edit the “Approvers” field of the workspace and add another user or group: the change applies to the requests that are already waiting, and they do not have to be submitted again.
Turning approval off. Turning it off stops new requests from being created. The ones already submitted stay pending: process them before turning approval off, or start the installation again — the outlived request is dropped automatically.
Financial block. While a workspace is financially blocked, a cluster installation request cannot be approved — installation is unavailable until the balance is topped up.
Audit. Submitting, approving, rejecting, and withdrawing a request are recorded in the change history of the
cluster the request belongs to, together with the request status, the initiator, and the rejection reason. Access to
these records is granted by the clusters/audit permission.
Authentication in application clusters via DexProvider
Every cluster attached to Deckhouse Commander automatically trusts users authenticated by the
management cluster’s Dex. Once a user signs into Deckhouse Commander, they can open the application
cluster’s admin web UI (DKP UI, the console module) without signing in again.
This does not require a separate account on the application cluster.
Deckhouse Commander reconciles the trust link automatically through a pair of resources:
- In the application cluster — a DexProvider named
commander, type OIDC. Its issuer points at the management cluster’s Dex URL. Its trust bundle carries the management cluster’s root CA, so TLS to the Dex endpoint validates without extra system-wide trust anchors. The provider requests theopenid,profile,email, andgroupsscopes. This single DexProvider is enough for the application cluster to rely on management-cluster identities; clusters may still have additional DexProvider resources for local identities. - In the management cluster — a paired DexClient named
commander-agent-<id>and a Secret with its OIDC client secret. The DexClient carries a redirect URI pointing to the application cluster’s Dex, so the management-cluster Dex correctly accepts login callbacks.
Both resources are created when a cluster is installed or attached, and removed on detach. No manual steps are required. If a resource is edited or removed by hand, the next reconciliation restores it.
How sign-in works
When a user opens the application cluster’s admin web UI from Deckhouse Commander, the browser reaches the
application cluster’s Dex. The application cluster’s Dex uses the commander provider and
redirects the browser to the management cluster’s Dex.
The management cluster’s Dex authenticates the user and redirects the browser back to the application cluster’s Dex using a redirect URI that belongs to that application cluster. The application cluster’s Dex then completes sign-in for the cluster admin web UI. If the user already has an active session in the management cluster’s Dex after signing in to Deckhouse Commander, they usually do not need to enter their login and password again.
The allowedUserGroups parameter of the commander module only controls who can sign in to
the Deckhouse Commander web UI. It does not grant any permissions inside Deckhouse Commander itself; roles
are configured separately. See Access control for details.
Do not edit, disable, or delete the auto-managed DexProvider/commander in an application
cluster or the paired DexClient and its Secret in the management cluster. Removing them
breaks all Deckhouse Commander-mediated logins into the application cluster. The next reconciliation
restores them, so manual tuning is lost in any case. If you need additional authentication
settings for an application cluster, add extra DexProvider resources alongside the managed
one — the Deckhouse Commander-managed provider is the minimum required to keep the cluster reachable from
Deckhouse Commander and is not exclusive.
Migrating access tokens to service accounts
API access tokens were replaced by service accounts and their API keys. During the upgrade, every access token is migrated automatically, and its value is preserved: existing integrations keep working without being reconfigured, and the request format for workspace keys does not change.
Each token becomes a separate account with a single key:
| Access token | Account created for it | Initial role |
|---|---|---|
| Workspace token, read-only | Workspace service account of the same workspace | Preserved read-only access to that workspace |
| Workspace token, read and write | Workspace service account of the same workspace | Preserved read and write access to that workspace |
| Global token, read-only | Global service account | Preserved read-only global access |
| Global token, read and write | Global service account | Preserved read and write global access |
| Expired or archived token | Account of the corresponding kind | None |
Migrated accounts are named migrated-token-<TOKEN_ID_PART>,
where <TOKEN_ID_PART> is the beginning of the token identifier.
The prefix is reserved: new accounts cannot be given a name that starts with migrated-token-.
The key keeps the identifier, the expiry date, the last usage time,
and the state of the old token — an archived token becomes a revoked key,
and an expired token becomes a key with an expired lifetime.
A key is created for every token, but an initial role is bound only for tokens that were still active,
so expired and archived tokens are migrated without any permissions.
The initial roles are created by the migration itself and named migrated-auth-token-viewer and
migrated-auth-token-editor. They carry the labels commander.deckhouse.io/owned-by: commander and
commander.deckhouse.io/generated-by: service-account-migration,
and they reproduce exactly what the old token could do:
- a global role covers the
globalroles,globalrolebindings,workspaces,workspaceroles,workspacerolebindings, andbillingreportsresources; - a workspace role covers the
clusters,clustertemplates,catalogs,records,registries,projects, andprojectrolebindingsresources; - the viewer variant grants the
getverb, and the editor variant grantsget,create,update, anddelete.
These roles contain no Kubernetes rules, so no ClusterRole or ClusterRoleBinding is created in the clusters for them. The change history of the old tokens is carried over: past actions and cluster creation approvals stay attributed to the migrated account.
After the upgrade, review the result in the “Service accounts” tab of the “Users and Permissions” section:
- Check which accounts were created and what their preserved-access roles allow. The roles repeat the permissions of the old tokens, which are usually broader than a particular integration needs.
- Replace them with your own roles, granting each account only the resources and verbs its integration uses, and then remove the assignment of the preserved-access role.
- Delete the accounts whose keys are expired or revoked and are no longer needed.
An account name cannot be changed, so to replace the technical migrated-token- name with a meaningful one,
create a new account, issue a key for it, switch the integration to that key, and delete the migrated account.
A key with broad permissions is not a separate kind of credential: it is an ordinary key of a global service account that has a broadly scoped global role bound to it. Such a key has no special status, is not limited to a single copy, and bypasses no permission checks — it is constrained only by the roles of its account. Treat it accordingly: bind a role that grants no more than the automation needs, keep the number of such accounts to a minimum, and revoke the key as soon as it is out of use.
Data encryption
Deckhouse Commander encrypts sensitive data stored in the database using keys that are automatically generated when the
module is enabled and stored in the commander-envs secret.
It is extremely important to save the keys to a secure location in order to be able to restore the database in case of any problems. If there are no keys, it will be impossible to restore the data!
$ d8 k -n d8-commander get secret commander-envs -oyaml
apiVersion: v1
data:
  ACTIVE_RECORD_ENCRYPTION_DETERMINISTIC_KEY: YVBBNVh5QUxoZjc1Tk5uTXphc3BXN2FrVGZacDBsUFk=
  ACTIVE_RECORD_ENCRYPTION_KEY_DERIVATION_SALT: eEVZMGR0NlRaY0FNZzUySzdPODR3WXpranZiQTYySHo=
  ACTIVE_RECORD_ENCRYPTION_PRIMARY_KEY: RUdZOFdodWxVT1hpeHlib2Q3Wld3TUlMNjhSOW81a0M=
kind: Secret
metadata:
...
  name: commander-envs
  namespace: d8-commander
type: Opaque
Collecting logs of the history of changes
In Deckhouse Commander version 1.9 and later, events related to the history of changes are printed to the standard
output and are tagged with the ["audit"] label. These logs can be collected and sent using the
log-shipper module.
Logs example:
{"level":"INFO","time":"2025-06-18 14:22:15 +0300","request_id":"ea09d409dc3c95dcf658fc2c2838084b","pid":19,"tags":["audit"],"auditable_type":"ClusterSettings","auditable_id":"8a0041ef-6c30-48bc-b3ca-e9db3e22be47","action":"create","user_type":"User","remote_address":"82.150.57.81","request_uuid":"ea09d409dc3c95dcf658fc2c2838084b","workspace_slug":"xcjtd","user_name":"admin@company.my","source":"ui","audited_changes":{"cluster_manager":{"sync":{"mode":"auto"},"check_interval":1}}}
{"level":"INFO","time":"2025-06-18 14:22:15 +0300","request_id":"ea09d409dc3c95dcf658fc2c2838084b","pid":19,"tags":["audit"],"auditable_type":"Cluster","auditable_id":"056f7fe5-7d22-4a76-b5e2-f225c0a99613","action":"create","user_type":"User","remote_address":"82.150.57.81","request_uuid":"ea09d409dc3c95dcf658fc2c2838084b","workspace_slug":"xcjtd","user_name":"admin@company.my","source":"ui","audited_changes":{"name":"mycluster","archived_at":null}}
{"level":"INFO","time":"2025-06-18 14:23:57 +0300","request_id":"a1eaf50bbc87a8cca4cd17d8be8fffdb","pid":12,"tags":["audit"],"auditable_type":"ClusterSettings","auditable_id":"707c46b1-b2c8-4fab-9392-8216a2058219","action":"create","user_type":"WorkspaceServiceAccount","remote_address":"238.106.231.86","request_uuid":"a1eaf50bbc87a8cca4cd17d8be8fffdb","workspace_slug":"bfqcc","user_name":"ci-bot","source":"integration_api","audited_changes":{"cluster_manager":{"sync":{"mode":"auto"},"check_interval":1}}}
{"level":"INFO","time":"2025-06-18 14:23:57 +0300","request_id":"a1eaf50bbc87a8cca4cd17d8be8fffdb","pid":12,"tags":["audit"],"auditable_type":"Cluster","auditable_id":"42d432aa-8250-4ef0-b260-51639e1445d0","action":"create","user_type":"WorkspaceServiceAccount","remote_address":"238.106.231.86","request_uuid":"a1eaf50bbc87a8cca4cd17d8be8fffdb","workspace_slug":"bfqcc","user_name":"ci-bot","source":"integration_api","audited_changes":{"name":"15731486914-1-con-1-30","archived_at":null}}
{"level":"INFO","time":"2025-06-18 14:28:56 +0300","request_id":"069566a46c004e53b686189587d484a9","pid":19,"tags":["audit"],"auditable_type":"ClusterSettings","auditable_id":"402a4d4d-5c14-4466-a1f3-3d990d7cf35a","action":"create","user_type":"User","remote_address":"30.231.184.26","request_uuid":"069566a46c004e53b686189587d484a9","workspace_slug":"xcjtd","user_name":"user@company.my","source":"ui","audited_changes":{"cluster_manager":{"sync":{"mode":"auto"},"check_interval":1}}}
{"level":"INFO","time":"2025-06-18 14:28:56 +0300","request_id":"069566a46c004e53b686189587d484a9","pid":19,"tags":["audit"],"auditable_type":"Cluster","auditable_id":"9ee687d4-18fe-423c-bbaa-e8e46ea47e67","action":"create","user_type":"User","remote_address":"30.231.184.26","request_uuid":"069566a46c004e53b686189587d484a9","workspace_slug":"xcjtd","user_name":"user@company.my","source":"ui","audited_changes":{"name":"mycluster2","archived_at":null}}
{"level":"INFO","time":"2025-06-18 14:29:06 +0300","request_id":"d29b248fbce414db8b71f821a3b1886e","pid":12,"tags":["audit"],"auditable_type":"Cluster","auditable_id":"e0f3c3de-2129-4b75-b927-72a8eb26902b","action":"update","user_type":"User","remote_address":"30.231.184.26","request_uuid":"d29b248fbce414db8b71f821a3b1886e","workspace_slug":"xcjtd","user_name":"user@company.my","source":"ui","audited_changes":{"archived_at":[null,"2025-06-18T14:29:05.943+03:00"]}}
The user_type, user_name, remote_address, and request_uuid fields describe the subject and the request.
Every record has the source field naming the channel the action came through (<channel> or
<channel>:<operation>):
| Value | Source |
|---|---|
ui |
a request through the web interface |
integration_api |
a request through the Integration API |
bootstrap |
initial setup with the bootstrap token (granting the administrator role) |
agent |
a cluster agent request |
cluster_manager:<action> |
completion of a cluster-manager task, for example cluster_manager:destroy, cluster_manager:detach |
cron:<task> |
a CronJob, for example cron:archives:cleanup, cron:cluster_agent_tokens:rotate |
rake:<task> |
a manually run maintenance task, for example rake:performance_testing:clusters:cleanup |
db:seed |
the db:seed job on module install and upgrade |
data_migration:<migration name> |
a data migration |
The missing_audit_attrs value marks a record registration error; an ERROR message is also written to the
application log.
Changes of image registries are recorded for every setting the user can change: name, address, scheme, CA
certificate, development branch, and credentials. Credential values never reach the journal: the change history
shows *** instead, and they are not written to the standard output. The registry check result is not an event.
Records created by the system itself (sources agent, cluster_manager:*, cron:*, rake:*, db:seed,
data_migration:*) have "user_name":"system" and an empty user_type. For cluster agent requests,
remote_address contains the address the request came from; for background operations the field is empty and
request_uuid identifies the run (one per job run). Example:
{"level":"INFO","time":"2026-10-16 09:00:00 +0300","request_id":"3f1d2a7c9b8e4d6fa1c2b3d4e5f60718","pid":7,"tags":["audit"],"auditable_type":"GlobalRole","auditable_id":"7c1e5d2a-4b3f-4e8a-9d0c-1b2a3c4d5e6f","action":"create","user_type":null,"remote_address":null,"request_uuid":"3f1d2a7c9b8e4d6fa1c2b3d4e5f60718","workspace_slug":null,"user_name":"system","source":"db:seed","audited_changes":{"name":"cluster-change-approver","comment":"Согласование изменений кластеров"}}Deleting a workspace does not delete the change history records of its objects: the deletion of every nested object
is recorded separately with the same subject and source. These records are written to the standard output and are
available in the external log storage; the web interface does not show them. The global “Change History” section
shows the records about creating, updating and deleting the workspace itself, including those recorded before the
upgrade. The only mechanism that removes records is the audits-cleaner CronJob driven by auditsRetentionDays.
Records of the system itself are selected in the change history with the “System records” checkbox; in the “Source” filter the system channels are grouped under “System”.
Records of the history of changes are printed by the backend pods (label app: backend) and by the pod of the
module installation and update job backend-migrate (label app: backend-migrate), which records events created by
Deckhouse Commander itself with the system subject. The configuration must select pods with both labels.
Configuration example:
apiVersion: deckhouse.io/v1alpha2
kind: ClusterLoggingConfig
metadata:
  name: commander-audit-logs
spec:
  destinationRefs:
  - loki-example
  kubernetesPods:
    labelSelector:
      matchExpressions:
      - key: app
        operator: In
        values:
        - backend
        - backend-migrate
    namespaceSelector:
      labelSelector:
        matchLabels:
          kubernetes.io/metadata.name: d8-commander
  labelFilter:
  - field: message
    operator: Regex
    values:
    - .*\[\"audit\"\].*
  type: KubernetesPods
---
apiVersion: deckhouse.io/v1alpha1
kind: ClusterLogDestination
metadata:
  name: loki-example
spec:
  type: Loki
  loki:
    endpoint: http://loki-example.loki.svc:3100
For more detailed configuration information, see the documentation of the log-shipper module.
Application cluster audit log: attempts to modify delivered resources
Resources that Deckhouse Commander delivers to an application cluster (the translated ClusterRole and
ClusterRoleBinding objects, the cluster template objects) are labeled with agent.commander.deckhouse.io/is-tracked
and protected by the agent-label-objects.deckhouse.io admission policy deployed by commander-agent. The policy
rejects creation, modification, and deletion of labeled objects by any subject other than the service accounts of the
d8-* namespaces and the system subjects of the cluster (nodes, control plane components, kube-system service
accounts), and in addition to the rejection (Deny) it performs the Audit action: the
agent-label-objects.deckhouse.io/source-user annotation with the name of the requesting subject is added to the
kube-apiserver audit log record.
Therefore, attempts to modify delivered resources bypassing Deckhouse Commander are recorded by the application
cluster audit log, not by the Deckhouse Commander change history. For such records to appear, the application
cluster must have a kube-apiserver audit policy of at least the Metadata level enabled for RBAC resources. In
Deckhouse Kubernetes Platform, create the audit-policy Secret in the kube-system namespace with the audit policy
and enable it in the control-plane-manager module:
d8 k patch mc control-plane-manager --type merge --patch '{"spec":{"settings":{"apiserver":{"auditPolicyEnabled":true}}}}'For details on the policy format and on shipping the audit log to external storage, see the documentation of the control-plane-manager and log-shipper modules.
A record of an attempt to bypass Deckhouse Commander differs from regular commander-agent requests to the same
objects by the combination of the following attributes:
responseStatus.codeis403;- the
validation.policy.admission.k8s.io/validation_failureannotation references theagent-label-objects.deckhouse.iopolicy; - the
agent-label-objects.deckhouse.io/source-userannotation contains the subject name; objectRefpoints to a labeled object andverbto the attempted action.
The source-user annotation is added on every request to a labeled object, including allowed commander-agent
requests with code 200, so by itself it does not indicate a violation.
On the Deckhouse Commander side, a discrepancy between the desired and actual state of delivered resources is shown
in the synchronization status on the cluster page; on the next synchronization, commander-agent restores the
resources to the desired state.
Changing the storage class
This instruction applies only if the operator-postgres module is used as the DBMS. This is
indicated by the Internal database connection mode in ModuleConfig/commander.
apiVersion: deckhouse.io/v1alpha1
kind: ModuleConfig
metadata:
  name: commander
spec:
  enabled: true
  version: 1
  settings:
    postgres:
      mode: Internal
    # Other module settings.
Option 1 (preferred)
-
Perform a backup of the database instance
d8 k -n d8-commander exec -t commander-postgres-0 -- su - postgres -c "pg_dump -Fc -b -v -d commander" > commander.dump -
Change storageClass in the module settings, replacing
<NEW_STORAGECLASS_NAME>with the name of the necessary storage classThe list of available storage classes can be found using the command
d8 k get storageclassesd8 k patch moduleconfig commander --type=merge -p '{"spec":{"settings":{"postgres":{"internal":{"storageClass":"<NEW_STORAGECLASS_NAME>"}}}}}' moduleconfig.deckhouse.io/commander patchedWait until the deckhouse queue will be empty
d8 system queue main

Queue 'main': length 0, status: 'waiting for task 5s'
Check the logs of the postgres operator
d8 k -n d8-operator-postgres logs deployments/operator-postgres {"cluster-name":"d8-commander/commander-postgres","level":"info","msg":"cluster has been updated","pkg":"controller","time":"2024-05-19T20:36:22Z","worker":0} -
Increase the number of replicas of the PostgreSQL database (optional)
This step must be skipped if the HighAvailability mode is active and PostgreSQL has 2 replicas
d8 k -n d8-commander patch postgresqls.acid.zalan.do commander-postgres --type=merge -p '{"spec":{"numberOfInstances":2}}'

postgresql.acid.zalan.do/commander-postgres patched
Check the logs of the operator and the postgres instance
d8 k -n d8-operator-postgres logs deployments/operator-postgres

{"cluster-name":"d8-commander/commander-postgres","level":"info","msg":"cluster has been updated","pkg":"controller","time":"2024-05-19T20:36:22Z","worker":0}
d8 k -n d8-commander logs commander-postgres-1 2024-05-19 20:38:15,648 INFO: no action. I am (commander-postgres-1), a secondary, and following a leader (commander-postgres-0) -
Perform the master switch
d8 k -n d8-commander exec -it commander-postgres-0 -- patronictl failover

Current cluster topology
+ Cluster: commander-postgres --------+---------+---------+----+-----------+
| Member               | Host         | Role    | State   | TL | Lag in MB |
+----------------------+--------------+---------+---------+----+-----------+
| commander-postgres-0 | 10.111.3.167 | Leader  | running |  5 |           |
| commander-postgres-1 | 10.111.2.239 | Replica | running |  5 |         0 |
+----------------------+--------------+---------+---------+----+-----------+
Candidate ['commander-postgres-1'] []: commander-postgres-1
Are you sure you want to failover cluster commander-postgres, demoting current leader commander-postgres-0? [y/N]: y
2024-05-19 20:40:52.63041 Successfully failed over to "commander-postgres-1"
+ Cluster: commander-postgres --------+---------+---------+----+-----------+
| Member               | Host         | Role    | State   | TL | Lag in MB |
+----------------------+--------------+---------+---------+----+-----------+
| commander-postgres-0 | 10.111.3.167 | Replica | stopped |    |   unknown |
| commander-postgres-1 | 10.111.2.239 | Leader  | running |  5 |           |
+----------------------+--------------+---------+---------+----+-----------+
Make sure that both DB instances are in the
runningstated8 k -n d8-commander exec -t commander-postgres-0 -- patronictl list + Cluster: commander-postgres --------+---------+---------+----+-----------+ | Member | Host | Role | State | TL | Lag in MB | +----------------------+--------------+---------+---------+----+-----------+ | commander-postgres-0 | 10.111.3.167 | Replica | running | 6 | 0 | | commander-postgres-1 | 10.111.2.239 | Leader | running | 6 | | +----------------------+--------------+---------+---------+----+-----------+Check that the disk of the new DB replica was created with the necessary
storageClassd8 k -n d8-commander get pvc --selector application=spilo NAME STATUS VOLUME CAPACITY ACCESS MODES STORAGECLASS AGE pgdata-commander-postgres-0 Bound pvc-fd80fde4-d0e2-4b5f-9e3a-eac998191f11 2Gi RWO network-hdd 36h pgdata-commander-postgres-1 Bound pvc-7af2f442-3097-4fe3-a795-5ad18bb11351 2Gi RWO network-ssd 2m54s -
Delete the disk and pod of the first postgres instance
d8 k -n d8-commander delete pvc pgdata-commander-postgres-0 --wait=false
d8 k -n d8-commander delete po commander-postgres-0
Check logs
d8 k -n d8-commander logs commander-postgres-0

2024-05-19 20:43:33,293 INFO: Lock owner: commander-postgres-1; I am commander-postgres-0
2024-05-19 20:43:33,293 INFO: establishing a new patroni connection to the postgres cluster
2024-05-19 20:43:33,357 INFO: no action. I am (commander-postgres-0), a secondary, and following a leader (commander-postgres-1)
Check that the disk was created with the correct
storageClassd8 k -n d8-commander get pvc NAME STATUS VOLUME CAPACITY ACCESS MODES STORAGECLASS AGE pgdata-commander-postgres-0 Bound pvc-fd80fde4-d0e2-4b5f-9e3a-eac998191f11 2Gi RWO network-ssd 2m6s pgdata-commander-postgres-1 Bound pvc-7af2f442-3097-4fe3-a795-5ad18bb11351 2Gi RWO network-ssd 7m11s -
Perform the master switch one more time
d8 k -n d8-commander exec -it commander-postgres-0  -- patronictl failover

Current cluster topology
+ Cluster: commander-postgres --------+---------+---------+----+-----------+
| Member               | Host         | Role    | State   | TL | Lag in MB |
+----------------------+--------------+---------+---------+----+-----------+
| commander-postgres-0 | 10.111.3.189 | Replica | running |  6 |         0 |
| commander-postgres-1 | 10.111.2.239 | Leader  | running |  6 |           |
+----------------------+--------------+---------+---------+----+-----------+
Candidate ['commander-postgres-0'] []: commander-postgres-0
Are you sure you want to failover cluster commander-postgres, demoting current leader commander-postgres-1? [y/N]: y
2024-05-19 20:46:11.69855 Successfully failed over to "commander-postgres-0"
+ Cluster: commander-postgres --------+---------+---------+----+-----------+
| Member               | Host         | Role    | State   | TL | Lag in MB |
+----------------------+--------------+---------+---------+----+-----------+
| commander-postgres-0 | 10.111.3.189 | Leader  | running |  6 |           |
| commander-postgres-1 | 10.111.2.239 | Replica | stopped |    |   unknown |
+----------------------+--------------+---------+---------+----+-----------+
Make sure that both DB instances are in the
runningstated8 k -n d8-commander exec -t commander-postgres-0 -- patronictl list + Cluster: commander-postgres --------+---------+---------+----+-----------+ | Member | Host | Role | State | TL | Lag in MB | +----------------------+--------------+---------+---------+----+-----------+ | commander-postgres-0 | 10.111.3.189 | Leader | running | 6 | 0 | | commander-postgres-1 | 10.111.2.239 | Replica | running | 6 | | +----------------------+--------------+---------+---------+----+-----------+ -
Reducing the number of replicas of the PostgreSQL database (optional)
This step must be skipped if the HighAvailability is active and PostgreSQL has 2 replicas
d8 k -n d8-commander patch postgresqls.acid.zalan.do commander-postgres --type=merge -p '{"spec":{"numberOfInstances":1}}'

postgresql.acid.zalan.do/commander-postgres patched
Check the operator logs
d8 k -n d8-operator-postgres logs deployments/operator-postgres {"cluster-name":"d8-commander/commander-postgres","level":"info","msg":"cluster has been updated","pkg":"controller","time":"2024-05-19T20:50:22Z","worker":0} -
Delete the disk and pod of the first instance (if HighAvailability mode is active and PostgreSQL has 2 replicas)
This step must be skipped if HighAvailability mode is not active
d8 k -n d8-commander delete pvc pgdata-commander-postgres-1 --wait=false
d8 k -n d8-commander delete po commander-postgres-1
Check logs
d8 k -n d8-commander logs commander-postgres-1

2024-05-19 20:53:33,293 INFO: Lock owner: commander-postgres-0; I am commander-postgres-1
2024-05-19 20:53:33,293 INFO: establishing a new patroni connection to the postgres cluster
2024-05-19 20:53:33,357 INFO: no action. I am (commander-postgres-1), a secondary, and following a leader (commander-postgres-0)
Check that the disk was created with the necessary
storageClassd8 k -n d8-commander get pvc NAME STATUS VOLUME CAPACITY ACCESS MODES STORAGECLASS AGE pgdata-commander-postgres-0 Bound pvc-fd80fde4-d0e2-4b5f-9e3a-eac998191f11 2Gi RWO network-ssd 7m6s pgdata-commander-postgres-1 Bound pvc-7af2f442-3097-4fe3-a795-5ad18bb11351 2Gi RWO network-ssd 1m11sMake sure that both DB instances are in the
runningstated8 k -n d8-commander exec -t commander-postgres-0 -- patronictl list + Cluster: commander-postgres --------+---------+---------+----+-----------+ | Member | Host | Role | State | TL | Lag in MB | +----------------------+--------------+---------+---------+----+-----------+ | commander-postgres-0 | 10.111.3.189 | Leader | running | 6 | 0 | | commander-postgres-1 | 10.111.2.239 | Replica | running | 6 | | +----------------------+--------------+---------+---------+----+-----------+
-
Delete the unused disk of the temporary database replica (if HighAvailability is not active)
This step must be skipped if HighAvailability is active and PostgreSQL has 2 replicas
d8 k -n d8-commander delete pvc pgdata-commander-postgres-1

persistentvolumeclaim "pgdata-commander-postgres-1" deleted
Option 2
-
Perform a backup of the database instance
d8 k -n d8-commander exec -t commander-postgres-0 -- su - postgres -c "pg_dump -Fc -b -v -d commander" > commander.dump -
Turn off the
commandermoduled8 k patch moduleconfig commander --type=merge -p '{"spec":{"enabled":false}}' moduleconfig.deckhouse.io/commander patchedWait until the deckhouse queue will be empty
d8 system queue main

Queue 'main': length 0, status: 'waiting for task 5s'
Check that the
d8-commandernamespace has been deletedd8 k get namespace d8-commander Error from server (NotFound): namespaces "d8-commander" not found -
Set the required storage class and enable the
commandermoduled8 k patch moduleconfig commander --type=merge -p '{"spec":{"enabled":true,"settings":{"postgres":{"internal":{"storageClass":"<NEW_STORAGECLASS_NAME>"}}}}}' moduleconfig.deckhouse.io/commander patchedWait until the deckhouse queue will be empty
d8 system queue main

Queue 'main': length 0, status: 'waiting for task 5s'
Check that the DB instance has the
Runningstatusd8 k -n d8-commander get po commander-postgres-0 NAME READY STATUS RESTARTS AGE commander-postgres-0 1/1 Running 0 2m4s -
Restoring a previously saved backup of the database
d8 k -n d8-commander exec -it commander-postgres-0 -- su - postgres -c "pg_restore -v -c --if-exists -Fc -d commander" < commander.dump