Getting logs from all cluster Pods and sending them to Loki
apiVersion: deckhouse.io/v1alpha1
kind: ClusterLoggingConfig
metadata:
  name: all-logs
spec:
  type: KubernetesPods
  destinationRefs:
  - loki-storage
---
apiVersion: deckhouse.io/v1alpha1
kind: ClusterLogDestination
metadata:
  name: loki-storage
spec:
  type: Loki
  loki:
    endpoint: http://loki.loki:3100
Reading Pod logs from a specified namespace with a specified label and redirecting to Loki and Elasticsearch
Reading logs from namespace=whispers with label app=booking and storing them into Loki and Elasticsearch:
apiVersion: deckhouse.io/v1alpha1
kind: ClusterLoggingConfig
metadata:
  name: whispers-booking-logs
spec:
  type: KubernetesPods
  kubernetesPods:
    namespaceSelector:
      matchNames:
        - whispers
    labelSelector:
      matchLabels:
        app: booking
  destinationRefs:
  - loki-storage
  - es-storage
---
apiVersion: deckhouse.io/v1alpha1
kind: ClusterLogDestination
metadata:
  name: loki-storage
spec:
  type: Loki
  loki:
    endpoint: http://loki.loki:3100
---
apiVersion: deckhouse.io/v1alpha1
kind: ClusterLogDestination
metadata:
  name: es-storage
spec:
  type: Elasticsearch
  elasticsearch:
    endpoint: http://192.168.1.1:9200
    index: logs-%F
    auth:
      strategy: Basic
      user: elastic
      password: c2VjcmV0IC1uCg==
Creating a source in namespace and reading logs of all Pods in that NS with forwarding them to Loki
Namespaced pipeline - reading logs from test-whispers namespace (all Pods):
apiVersion: deckhouse.io/v1alpha1
kind: PodLoggingConfig
metadata:
  name: whispers-logs
  namespace: tests-whispers
spec:
  clusterDestinationRefs:
    - loki-storage
---
apiVersion: deckhouse.io/v1alpha1
kind: ClusterLogDestination
metadata:
  name: loki-storage
spec:
  type: Loki
  loki:
    endpoint: http://loki.loki:3100
Reading only Pods in the specified namespace and having a certain label
Read logs from Pods with label app=booking in namespace test-whispers:
apiVersion: deckhouse.io/v1alpha1
kind: PodLoggingConfig
metadata:
  name: whispers-logs
  namespace: tests-whispers
spec:
  labelSelector:
    matchLabels:
      app: booking
  clusterDestinationRefs:
    - loki-storage
---
apiVersion: deckhouse.io/v1alpha1
kind: ClusterLogDestination
metadata:
  name: loki-storage
spec:
  type: Loki
  loki:
    endpoint: http://loki.loki:3100
Migration from Promtail to Log-Shipper
Path /loki/api/v1/push has to be removed from the previously used Loki URL.
Vector will add this PATH automatically during working with Loki destination.
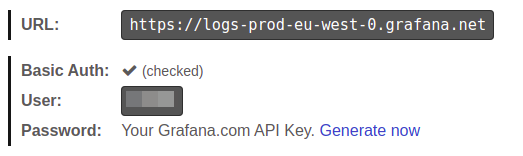
Working with Grafana Cloud
This documentation expects that you have created API key.
Firstly you should encode your token with base64.
echo -n "<YOUR-GRAFANACLOUD-TOKEN>" | base64 -w0
Then you can create ClusterLogDestination
apiVersion: deckhouse.io/v1alpha1
kind: ClusterLogDestination
metadata:
  name: loki-storage
spec:
  loki:
    auth:
      password: PFlPVVItR1JBRkFOQUNMT1VELVRPS0VOPg==
      strategy: Basic
      user: "<YOUR-GRAFANACLOUD-USER>"
    endpoint: <YOUR-GRAFANACLOUD-URL> # For example https://logs-prod-us-central1.grafana.net or https://logs-prod-eu-west-0.grafana.net
  type: Loki
Now you can create PodLogginConfig or ClusterPodLoggingConfig and send logs to Grafana Cloud.
Adding Loki source to Deckhouse Grafana
You can work with Loki from embedded to deckhouse Grafana. Just add GrafanaAdditionalDatasource
apiVersion: deckhouse.io/v1
kind: GrafanaAdditionalDatasource
metadata:
  name: loki
spec:
  access: Proxy
  basicAuth: false
  jsonData:
    maxLines: 5000
    timeInterval: 30s
  type: loki
  url: http://loki.loki:3100
Elasticsearch < 6.X usage
For Elasticsearch < 6.0 doc_type indexing should be set. Config should look like this:
apiVersion: deckhouse.io/v1alpha1
kind: ClusterLogDestination
metadata:
  name: es-storage
spec:
  type: Elasticsearch
  elasticsearch:
    endpoint: http://192.168.1.1:9200
    docType: "myDocType" # Set any string here. It should not start with '_'
    auth:
      strategy: Basic
      user: elastic
      password: c2VjcmV0IC1uCg==
Index template for Elasticsearch
It is possible to route logs to particular indexes based on metadata using index templating:
apiVersion: deckhouse.io/v1alpha1
kind: ClusterLogDestination
metadata:
  name: es-storage
spec:
  type: Elasticsearch
  elasticsearch:
    endpoint: http://192.168.1.1:9200
    index: "k8s-{{ namespace }}-%F"
For the above example for each Kubernetes namespace a dedicated index in Elasticsearch will be created.
This feature works well combining with extraLabels:
apiVersion: deckhouse.io/v1alpha1
kind: ClusterLogDestination
metadata:
  name: es-storage
spec:
  type: Elasticsearch
  elasticsearch:
    endpoint: http://192.168.1.1:9200
    index: "k8s-{{ service }}-{{ namespace }}-%F"
  extraLabels:
    service: "{{ service_name }}"
- If a log message is in JSON format, the
service_namefield of this JSON document is moved to the metadata level. - The new metadata field
serviceis used for the index template.
Splunk integration
It is possible to send logs from Deckhouse to Splunk.
- Endpoint must be equal to the Splunk instance name with the
8088port and no path provided, e.g.https://prd-p-xxxxxx.splunkcloud.com:8088. - To add a token to ingest logs, go to
Setting->Data inputs, add a newHTTP Event Collectorand copy a token. - Provide a Splunk index to store logs, e.g.,
logs.
apiVersion: deckhouse.io/v1alpha1
kind: ClusterLogDestination
metadata:
  name: splunk
spec:
  type: Splunk
  splunk:
    endpoint: https://prd-p-xxxxxx.splunkcloud.com:8088
    token: xxxx-xxxx-xxxx
    index: logs
    tls:
      verifyCertificate: false
      verifyHostname: false
Splunk destination doesn’t support pod labels for indexes. Consider exporting necessary labels with the extraLabels option.
extraLabels:
  pod_label_app: '{{ pod_labels.app }}'
Simple Logstash example
To send logs to Logstash, the tcp input should be configured on the Logstash instance side, and its codec should be set to json.
An example of the minimal Logstash configuration:
input {
  tcp {
    port => 12345
    codec => json
  }
}
output {
  stdout { codec => json }
}
An example of the ClusterLogDestination manifest:
apiVersion: deckhouse.io/v1alpha1
kind: ClusterLogDestination
metadata:
  name: logstash
spec:
  type: Logstash
  logstash:
    endpoint: logstash.default:12345
Collect Kubernetes Events
Kubernetes Events can be collected by log-shipper if events-exporter is enabled in the extended-monitoring module configuration.
Enable events-exporter by adjusting extended-monitoring settings:
apiVersion: deckhouse.io/v1alpha1
kind: ModuleConfig
metadata:
  name: extended-monitoring
spec:
  version: 1
  settings:
    events:
      exporterEnabled: true
Apply the following ClusterLoggingConfig to collect logs from the events-exporter Pod:
apiVersion: deckhouse.io/v1alpha1
kind: ClusterLoggingConfig
metadata:
  name: kubernetes-events
spec:
  type: KubernetesPods
  kubernetesPods:
    labelSelector:
      matchLabels:
        app: events-exporter
    namespaceSelector:
      matchNames:
      - d8-monitoring
  destinationRefs:
  - loki-storage
Log filters
Users can filter logs by applying two filters:
labelFilter— applies to the top-level metadata, e.g., container, namespace, or Pod name.logFilter— applies to fields of a message if it is in JSON format.
Collect only logs of the nginx container
apiVersion: deckhouse.io/v1alpha1
kind: ClusterLoggingConfig
metadata:
  name: nginx-logs
spec:
  type: KubernetesPods
  labelFilter:
  - field: container
    operator: In
    values: [nginx]
  destinationRefs:
  - loki-storage
Collect logs without strings GET /status" 200
apiVersion: deckhouse.io/v1alpha1
kind: ClusterLoggingConfig
metadata:
  name: all-logs
spec:
  type: KubernetesPods
  destinationRefs:
  - loki-storage
  labelFilter:
  - field: message
    operator: NotRegex
    values:
    - .*GET /status" 200$
Audit of kubelet actions
apiVersion: deckhouse.io/v1alpha1
kind: ClusterLoggingConfig
metadata:
  name: kubelet-audit-logs
spec:
  type: File
  file:
    include:
    - /var/log/kube-audit/audit.log
  logFilter:
  - field: userAgent
    operator: Regex
    values: ["kubelet.*"]
  destinationRefs:
  - loki-storage
Deckhouse system logs
apiVersion: deckhouse.io/v1alpha1
kind: ClusterLoggingConfig
metadata:
  name: system-logs
spec:
  type: File
  file:
    include:
    - /var/log/syslog
  labelFilter:
  - field: message
    operator: Regex
    values:
    - .*d8-kubelet-forker.*
    - .*containerd.*
    - .*bashible.*
    - .*kernel.*
  destinationRefs:
  - loki-storage
If you need logs from only one or from a small group of a Pods, try to use the kubernetesPods settings to reduce the number of reading filed. Do not use highly grained filters to read logs from a single pod.
Collect logs from production namespaces using the namespace label selector option
apiVersion: deckhouse.io/v1alpha1
kind: ClusterLoggingConfig
metadata:
  name: production-logs
spec:
  type: KubernetesPods
  kubernetesPods:
    namespaceSelector:
      labelSelector:
        matchLabels:
          environment: production
  destinationRefs:
  - loki-storage
Exclude Pods or namespaces with a label
There is a preconfigured label to exclude particular namespaces or Pods: log-shipper.deckhouse.io/exclude=true.
It can help to stop collecting logs from a namespace or Pod without changing global configurations.
---
apiVersion: v1
kind: Namespace
metadata:
  name: test-namespace
  labels:
    log-shipper.deckhouse.io/exclude: "true"
---
apiVersion: apps/v1
kind: Deployment
metadata:
  name: test-deployment
spec:
  ...
  template:
    metadata:
      labels:
        log-shipper.deckhouse.io/exclude: "true"