Deckhouse provides log collection and delivery from cluster nodes and pods to internal or external storage systems.
DVP allows you to:
- Collect logs from all or specific pods and namespaces.
- Filter logs by labels, message content, and other criteria.
- Send logs to multiple storage systems simultaneously (e.g., Loki and Elasticsearch).
- Enrich logs with Kubernetes metadata.
- Use log buffering to improve performance.
The general mechanism for log collection, delivery, and filtering is described in detail in the Architecture section.
DVP administrators can configure log collection and delivery using three custom resources:
ClusterLoggingConfig: Describes log sources at the cluster level, including collection, filtering, and parsing rules.PodLoggingConfig: Describes log sources within a specified namespace, including collection, filtering, and parsing rules.ClusterLogDestination: Sets log storage parameters.
Based on these resources, a pipeline is formed that is used in DVP to read logs and work with them using the log-shipper module.
The complete list of log-shipper module settings is available in the separate documentation section.
Log Collection and Delivery Configuration
Below is a basic Deckhouse configuration option where logs from all cluster pods are sent to an Elasticsearch-based storage.
To configure, follow these steps:
-
Enable the
log-shippermodule using the following command:d8 system module enable log-shipper -
Create a ClusterLoggingConfig resource that defines log collection rules. This resource allows you to configure log collection from pods in a specific namespace and with a specific label, flexibly configure multi-line log parsing, and set other rules.
In this example, it is specified that logs from all pods should be collected and sent to Elasticsearch:
apiVersion: deckhouse.io/v1alpha1 kind: ClusterLoggingConfig metadata: name: all-logs spec: type: KubernetesPods destinationRefs: - es-storage -
Create a ClusterLogDestination resource that describes the parameters for sending logs to storage. This resource allows you to specify one or more storage systems and describe connection parameters, buffering, and additional labels that will be applied to logs before sending.
In this example, Elasticsearch is specified as the receiving storage:
apiVersion: deckhouse.io/v1alpha1
kind: ClusterLogDestination
metadata:
  name: es-storage
spec:
  type: Elasticsearch
  elasticsearch:
    endpoint: http://192.168.1.1:9200
    index: logs-%F
    auth:
      strategy: Basic
      user: elastic
      password: c2VjcmV0IC1uCg==
Integration with External Systems
You can configure Deckhouse to work with external log storage and analysis systems,
such as Elasticsearch, Splunk, Logstash, and others,
using the type parameter of the ClusterLogDestination resource.
Elasticsearch
To send logs to Elasticsearch, create a ClusterLogDestination resource following this example:
apiVersion: deckhouse.io/v1alpha1
kind: ClusterLogDestination
metadata:
  name: es-storage
spec:
  type: Elasticsearch
  elasticsearch:
    endpoint: http://192.168.1.1:9200
    index: logs-%F
    auth:
      strategy: Basic
      user: elastic
      password: c2VjcmV0IC1uCg==
Using Index Templates
To send messages to specific indices based on metadata using index templates, use the following configuration:
apiVersion: deckhouse.io/v1alpha1
kind: ClusterLogDestination
metadata:
  name: es-storage
spec:
  type: Elasticsearch
  elasticsearch:
    endpoint: http://192.168.1.1:9200
    index: "k8s-{{ namespace }}-%F"
In the example above, a separate index will be created in Elasticsearch for each Kubernetes namespace.
This feature is convenient in combination with the extraLabels parameter:
apiVersion: deckhouse.io/v1alpha1
kind: ClusterLogDestination
metadata:
  name: es-storage
spec:
  type: Elasticsearch
  elasticsearch:
    endpoint: http://192.168.1.1:9200
    index: "k8s-{{ service }}-{{ namespace }}-%F"
  extraLabels:
    service: "{{ service_name }}"
- If the message has JSON format, the
service_namefield of this JSON document is moved to the metadata level. - The new metadata field
serviceis used in the index template.
Elasticsearch < 6.X Support
To work with Elasticsearch versions prior to 6.0, enable support for docType indices using the ClusterLogDestination resource:
apiVersion: deckhouse.io/v1alpha1
kind: ClusterLogDestination
metadata:
  name: es-storage
spec:
  type: Elasticsearch
  elasticsearch:
    endpoint: http://192.168.1.1:9200
    docType: "myDocType" # Specify the value here. It should not start with '_'.
    auth:
      strategy: Basic
      user: elastic
      password: c2VjcmV0IC1uCg==
Splunk
To configure sending events to Splunk, follow these steps:
- Configure Splunk:
- Define the endpoint. It should match your Splunk instance name with port
8088, but without specifying the path, for example,https://prd-p-xxxxxx.splunkcloud.com:8088. - Create an access token. To do this, in Splunk, open the Setting -> Data inputs section, add a new HTTP Event Collector and copy the generated token.
- Specify the Splunk index for storing logs, for example,
logs.
- Define the endpoint. It should match your Splunk instance name with port
- Configure Deckhouse by adding a ClusterLogDestination resource to send logs to Splunk:
apiVersion: deckhouse.io/v1alpha1
kind: ClusterLogDestination
metadata:
  name: splunk
spec:
  type: Splunk
  splunk:
    endpoint: https://prd-p-xxxxxx.splunkcloud.com:8088
    token: xxxx-xxxx-xxxx
    index: logs
    tls:
      verifyCertificate: false
      verifyHostname: false
destination does not support pod labels for indexing. To add the required labels, use the extraLabels option:
extraLabels:
  pod_label_app: ''
Logstash
To configure sending logs to Logstash, do the following:
-
Configure an incoming
tcpstream withjsoncodec on the Logstash side.Logstash configuration example:
input { tcp { port => 12345 codec => json } } output { stdout { codec => json } } -
Add a ClusterLogDestination resource:
apiVersion: deckhouse.io/v1alpha1
kind: ClusterLogDestination
metadata:
  name: logstash
spec:
  type: Logstash
  logstash:
    endpoint: logstash.default:12345
Graylog
To configure sending logs to Graylog, do the following:
- Ensure that Graylog has an incoming stream configured to receive messages via TCP protocol on the specified port.
-
Create a ClusterLogDestination resource following the example:
apiVersion: deckhouse.io/v1alpha1
kind: ClusterLogDestination
metadata:
  name: test-socket2-dest
spec:
  type: Socket
  socket:
    address: graylog.svc.cluster.local:9200
    mode: TCP
    encoding:
      codec: GELF
Message Format
You can choose the format of sent messages using the .encoding.codec parameter of the ClusterLogDestination resource:
- CEF
- GELF
- JSON
- Syslog
- Text
Below are configuration examples for some of them.
Syslog
Use the following configuration example to send messages via socket over TCP protocol in syslog format:
apiVersion: deckhouse.io/v1alpha1
kind: ClusterLogDestination
metadata:
  name: rsyslog
spec:
  type: Socket
  socket:
    mode: TCP
    address: 192.168.0.1:3000
    encoding:
      codec: Syslog
  extraLabels:
    syslog.severity: "alert"
    # The request_id field must be present in the message.
    syslog.message_id: "{{ request_id }}"
CEF
Deckhouse can send logs in CEF format using codec: CEF,
with overriding cef.name and cef.severity based on values from the message field of the application log in JSON format.
In the example below, app and log_level are keys containing values for overriding:
apiVersion: deckhouse.io/v1alpha1
kind: ClusterLogDestination
metadata:
  name: siem-kafka
spec:
  extraLabels:
    cef.name: '{{ app }}'
    cef.severity: '{{ log_level }}'
  type: Kafka
  kafka:
    bootstrapServers:
      - my-cluster-kafka-brokers.kafka:9092
    encoding:
      codec: CEF
    tls:
      verifyCertificate: false
      verifyHostname: true
    topic: logs
You can also set values manually:
extraLabels:
  cef.name: 'TestName'
  cef.severity: '1'
Log Transformation
You can configure one or more types of transformations that will be applied to logs before sending to storage.
Converting Records to Structured Objects
The ParseMessage transformation allows you to convert a string in the message field to a structured JSON object
based on one or more specified formats (String, Klog, SysLog, and others).
When using multiple ParseMessage transformations, string conversion (sourceFormat: String) should be performed last.
Example configuration for converting mixed format records:
apiVersion: deckhouse.io/v1alpha2
kind: ClusterLogDestination
metadata:
  name: parse-json
spec:
  ...
  transformations:
  - action: ParseMessage
    parseMessage:
      sourceFormat: JSON
  - action: ParseMessage
    parseMessage:
      sourceFormat: Klog
  - action: ParseMessage
    parseMessage:
      sourceFormat: String
      string:
        targetField: "text"
Original log record example:
/docker-entrypoint.sh: Configuration complete; ready for start up
{"level" : { "severity": "info" },"msg" : "fetching.module.release"}
I0505 17:59:40.692994   28133 klog.go:70] hello from klog
Transformation result:
{... "message": {
  "text": "/docker-entrypoint.sh: Configuration complete; ready for start up"
  }
}
{... "message": {
  "level" : "{ "severity": "info" }",
  "msg" : "fetching.module.release"
  }
}
{... "message": {
  "file":"klog.go",
  "id":28133,
  "level":"info",
  "line":70,
  "message":"hello from klog",
  "timestamp":"2025-05-05T17:59:40.692994Z"
  }
}
Label Replacement
The ReplaceKeys transformation allows you to recursively replace all matches of the source pattern with the target value in the specified label keys.
Before applying the ReplaceKeys transformation to the message field or its nested fields, convert the log record to a structured object using the ParseMessage transformation.
Example configuration for replacing dots with underscores in labels:
apiVersion: deckhouse.io/v1alpha2
kind: ClusterLogDestination
metadata:
  name: replace-dot
spec:
  ...
  transformations:
    - action: ReplaceKeys
      replaceKeys:
        source: "."
        target: "_"
        labels:
          - .pod_labels
Original log record example:
{"msg" : "fetching.module.release"} # Pod label pod.app=test
Transformation result:
{... "message": {
  "msg" : "fetching.module.release"
  },
  "pod_labels": {
    "pod_app": "test"
  }
}
Label Removal
The DropLabels transformation allows you to remove specified labels from the structured JSON message.
Before applying the DropLabels transformation to the message field or its nested fields, convert the log record to a structured object using the ParseMessage transformation.
Example configuration with label removal and preliminary ParseMessage transformation:
apiVersion: deckhouse.io/v1alpha2
kind: ClusterLogDestination
metadata:
  name: drop-label
spec:
  ...
  transformations:
    - action: ParseMessage
      parseMessage:
        sourceFormat: JSON
    - action: DropLabels
      dropLabels:
        labels:
          - .message.example
Original log record example:
{"msg" : "fetching.module.release", "example": "test"}
Transformation result:
{... "message": {
  "msg" : "fetching.module.release"
  }
}
Log Filtering
Deckhouse provides filters to exclude unnecessary messages for optimizing the log collection process:
labelFilter— applied to metadata, for example, container name (container), namespace (namespace) or pod name (pod_name);logFilter— applied to message fields, if it is in JSON format.
Collecting Logs from a Specific Container
To configure filtering using labelFilter,
create a ClusterLoggingConfig resource,
using the configuration below as an example.
In this case, the filter selects logs from containers named nginx,
and then sends them to internal Loki-based storage.
apiVersion: deckhouse.io/v1alpha1
kind: ClusterLoggingConfig
metadata:
  name: nginx-logs
spec:
  type: KubernetesPods
  labelFilter:
  - field: container
    operator: In
    values: [nginx]
  destinationRefs:
  - loki-storage
Collecting Logs Without a Specific String
Example configuration for collecting logs with filtering via labelFilter,
where the NotRegex operator excludes strings matching the specified regular expression.
apiVersion: deckhouse.io/v1alpha1
kind: ClusterLoggingConfig
metadata:
  name: all-logs
spec:
  type: KubernetesPods
  destinationRefs:
  - loki-storage
  labelFilter:
  - field: message
    operator: NotRegex
    values:
    - .*GET /status" 200$
Kubelet Audit Events
Example configuration for collecting and filtering audit events related to kubelet operation,
stored in the /var/log/kube-audit/audit.log file.
Filtering is performed using logFilter, which searches for records in the userAgent field,
matching the regular expression "kubelet.*".
apiVersion: deckhouse.io/v1alpha1
kind: ClusterLoggingConfig
metadata:
  name: kubelet-audit-logs
spec:
  type: File
  file:
    include:
    - /var/log/kube-audit/audit.log
  logFilter:
  - field: userAgent
    operator: Regex
    values: ["kubelet.*"]
  destinationRefs:
  - loki-storage
Deckhouse System Logs
Example configuration for collecting Deckhouse system logs located in the /var/log/syslog file.
Message filtering using labelFilter allows you to select only those records,
that relate to the following components:
d8-kubelet-forker, containerd, bashible and kernel.
apiVersion: deckhouse.io/v1alpha1
kind: ClusterLoggingConfig
metadata:
  name: system-logs
spec:
  type: File
  file:
    include:
    - /var/log/syslog
  labelFilter:
  - field: message
    operator: Regex
    values:
    - .*d8-kubelet-forker.*
    - .*containerd.*
    - .*bashible.*
    - .*kernel.*
  destinationRefs:
  - loki-storage
If you need logs from only one pod or a small group of pods, use kubernetesPods to limit the collection scope. Filters should be applied only for fine-tuning.
Log Buffering
Using buffering improves the reliability and performance of the log collection system. Buffering can be useful in the following cases:
-
Temporary connection issues. If there are temporary interruptions or connection instability with the log storage system (e.g., with Elasticsearch), the buffer allows you to temporarily store logs and send them when the connection is restored.
-
Load spike smoothing. During sudden spikes in log volume, the buffer allows you to smooth the peak load on the storage system, preventing its overload and potential data loss.
-
Performance optimization. Buffering helps optimize the performance of the log collection system by accumulating logs and sending them in batches, which reduces the number of network requests and improves overall throughput.
The buffer parameter of the ClusterLogDestination resource is responsible for configuring buffering.
Example of Enabling In-Memory Buffering
apiVersion: deckhouse.io/v1alpha1
kind: ClusterLogDestination
metadata:
  name: loki-storage
spec:
  buffer:
    memory:
      maxEvents: 4096
    type: Memory
  type: Loki
  loki:
    endpoint: http://loki.loki:3100
Example of Enabling Disk Buffering
apiVersion: deckhouse.io/v1alpha1
kind: ClusterLogDestination
metadata:
  name: loki-storage
spec:
  buffer:
    disk:
      maxSize: 1Gi
    type: Disk
  type: Loki
  loki:
    endpoint: http://loki.loki:3100
Example of Defining Buffer Overflow Behavior
apiVersion: deckhouse.io/v1alpha1
kind: ClusterLogDestination
metadata:
  name: loki-storage
spec:
  buffer:
    disk:
      maxSize: 1Gi
    type: Disk
    whenFull: DropNewest
  type: Loki
  loki:
    endpoint: http://loki.loki:3100
Debugging and Advanced Features
Enabling Debug Logs for the log-shipper Agent
To enable debug logs for the log-shipper agent on nodes with information about HTTP requests, connection reuse,
tracing, and other data, enable the debug parameter in the log-shipper module configuration.
Module configuration example:
apiVersion: deckhouse.io/v1alpha1
kind: ModuleConfig
metadata:
  name: log-shipper
spec:
  version: 1
  enabled: true
  settings:
    debug: true
Additional Information About Log Delivery Channels
Using Vector commands, you can get additional information about data transmission channels.
First, connect to one of the log-shipper pods:
d8 k -n d8-log-shipper get pods -o wide | grep $node
d8 k -n d8-log-shipper exec $pod -it -c vector -- bash
Execute subsequent commands from the pod’s command shell.
Topology Overview
To get a diagram of your configuration topology:
- Run the
vector graphcommand. A diagram in DOT format will be generated. - Use WebGraphviz or a similar service to render the diagram based on the DOT file content.
Example diagram for one log delivery channel in ASCII format:
+------------------------------------------------+
|  d8_cluster_source_flant-integration-d8-logs   |
+------------------------------------------------+
  |
  |
  v
+------------------------------------------------+
|       d8_tf_flant-integration-d8-logs_0        |
+------------------------------------------------+
  |
  |
  v
+------------------------------------------------+
|       d8_tf_flant-integration-d8-logs_1        |
+------------------------------------------------+
  |
  |
  v
+------------------------------------------------+
| d8_cluster_sink_flant-integration-loki-storage |
+------------------------------------------------+
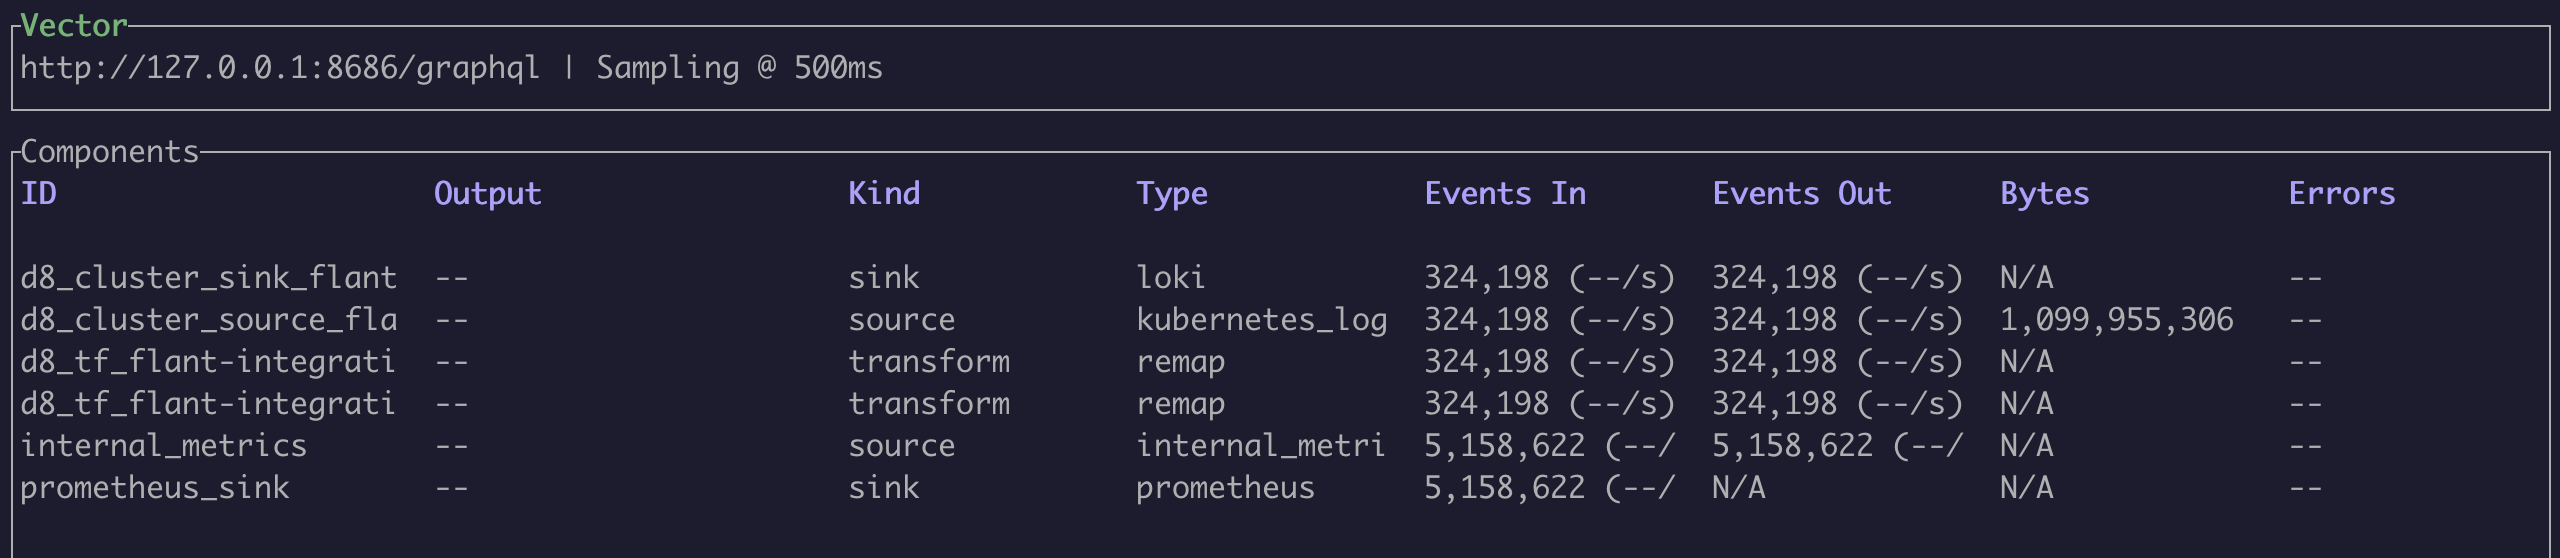
Monitoring Channel Load
To view traffic volume at each log processing stage, use the vector top command.
Example command output:
Getting Raw and Intermediate Logs
To view input data at different log processing stages, use the vector tap command.
By specifying the ID of a specific processing stage in it, you can see logs that arrive at that stage.
Glob pattern selections are also supported, for example, cluster_logging_config/*.
Examples:
-
Viewing logs before applying transformation rules (
cluster_logging_config/*is the first processing stage according to thevector graphcommand output):vector tap 'cluster_logging_config/*' -
Modified logs arriving at the input of the next components in the channel chain:
vector tap 'transform/*'
Debugging VRL Rules
To debug rules in Vector Remap Language (VRL),
use the vector vrl command.
Example VRL program:
. = {"test1": "lynx", "test2": "fox"}
del(.test2)
.
Adding Support for New Source or Sink
The log-shipper module in Deckhouse is built based on Vector with a limited set of cargo features,
to minimize the size of the executable file and speed up compilation.
To view the complete list of supported features, run the vector list command.
If the required source or sink is missing, add the corresponding cargo feature to the Dockerfile.
Special Cases
Collecting Logs from Production Namespaces via labelSelector Option
If your cluster namespaces are labeled (e.g., environment=production),
you can use the labelSelector option to collect logs from production namespaces.
Configuration example:
apiVersion: deckhouse.io/v1alpha1
kind: ClusterLoggingConfig
metadata:
  name: production-logs
spec:
  type: KubernetesPods
  kubernetesPods:
    namespaceSelector:
      labelSelector:
        matchLabels:
          environment: production
  destinationRefs:
  - loki-storage
Label for Excluding Pods and Namespaces
Deckhouse provides the log-shipper.deckhouse.io/exclude=true label for excluding specific pods and namespaces.
It helps stop log collection from pods and namespaces without changing the global configuration.
---
apiVersion: v1
kind: Namespace
metadata:
  name: test-namespace
  labels:
    log-shipper.deckhouse.io/exclude: "true"
---
apiVersion: apps/v1
kind: Deployment
metadata:
  name: test-deployment
spec:
  ...
  template:
    metadata:
      labels:
        log-shipper.deckhouse.io/exclude: "true"