The monitoring-kubernetes module provides transparent and timely monitoring of the status of all cluster nodes and key infrastructure components.
For more details about module features and configuration, refer to the corresponding documentation section.
Module architecture
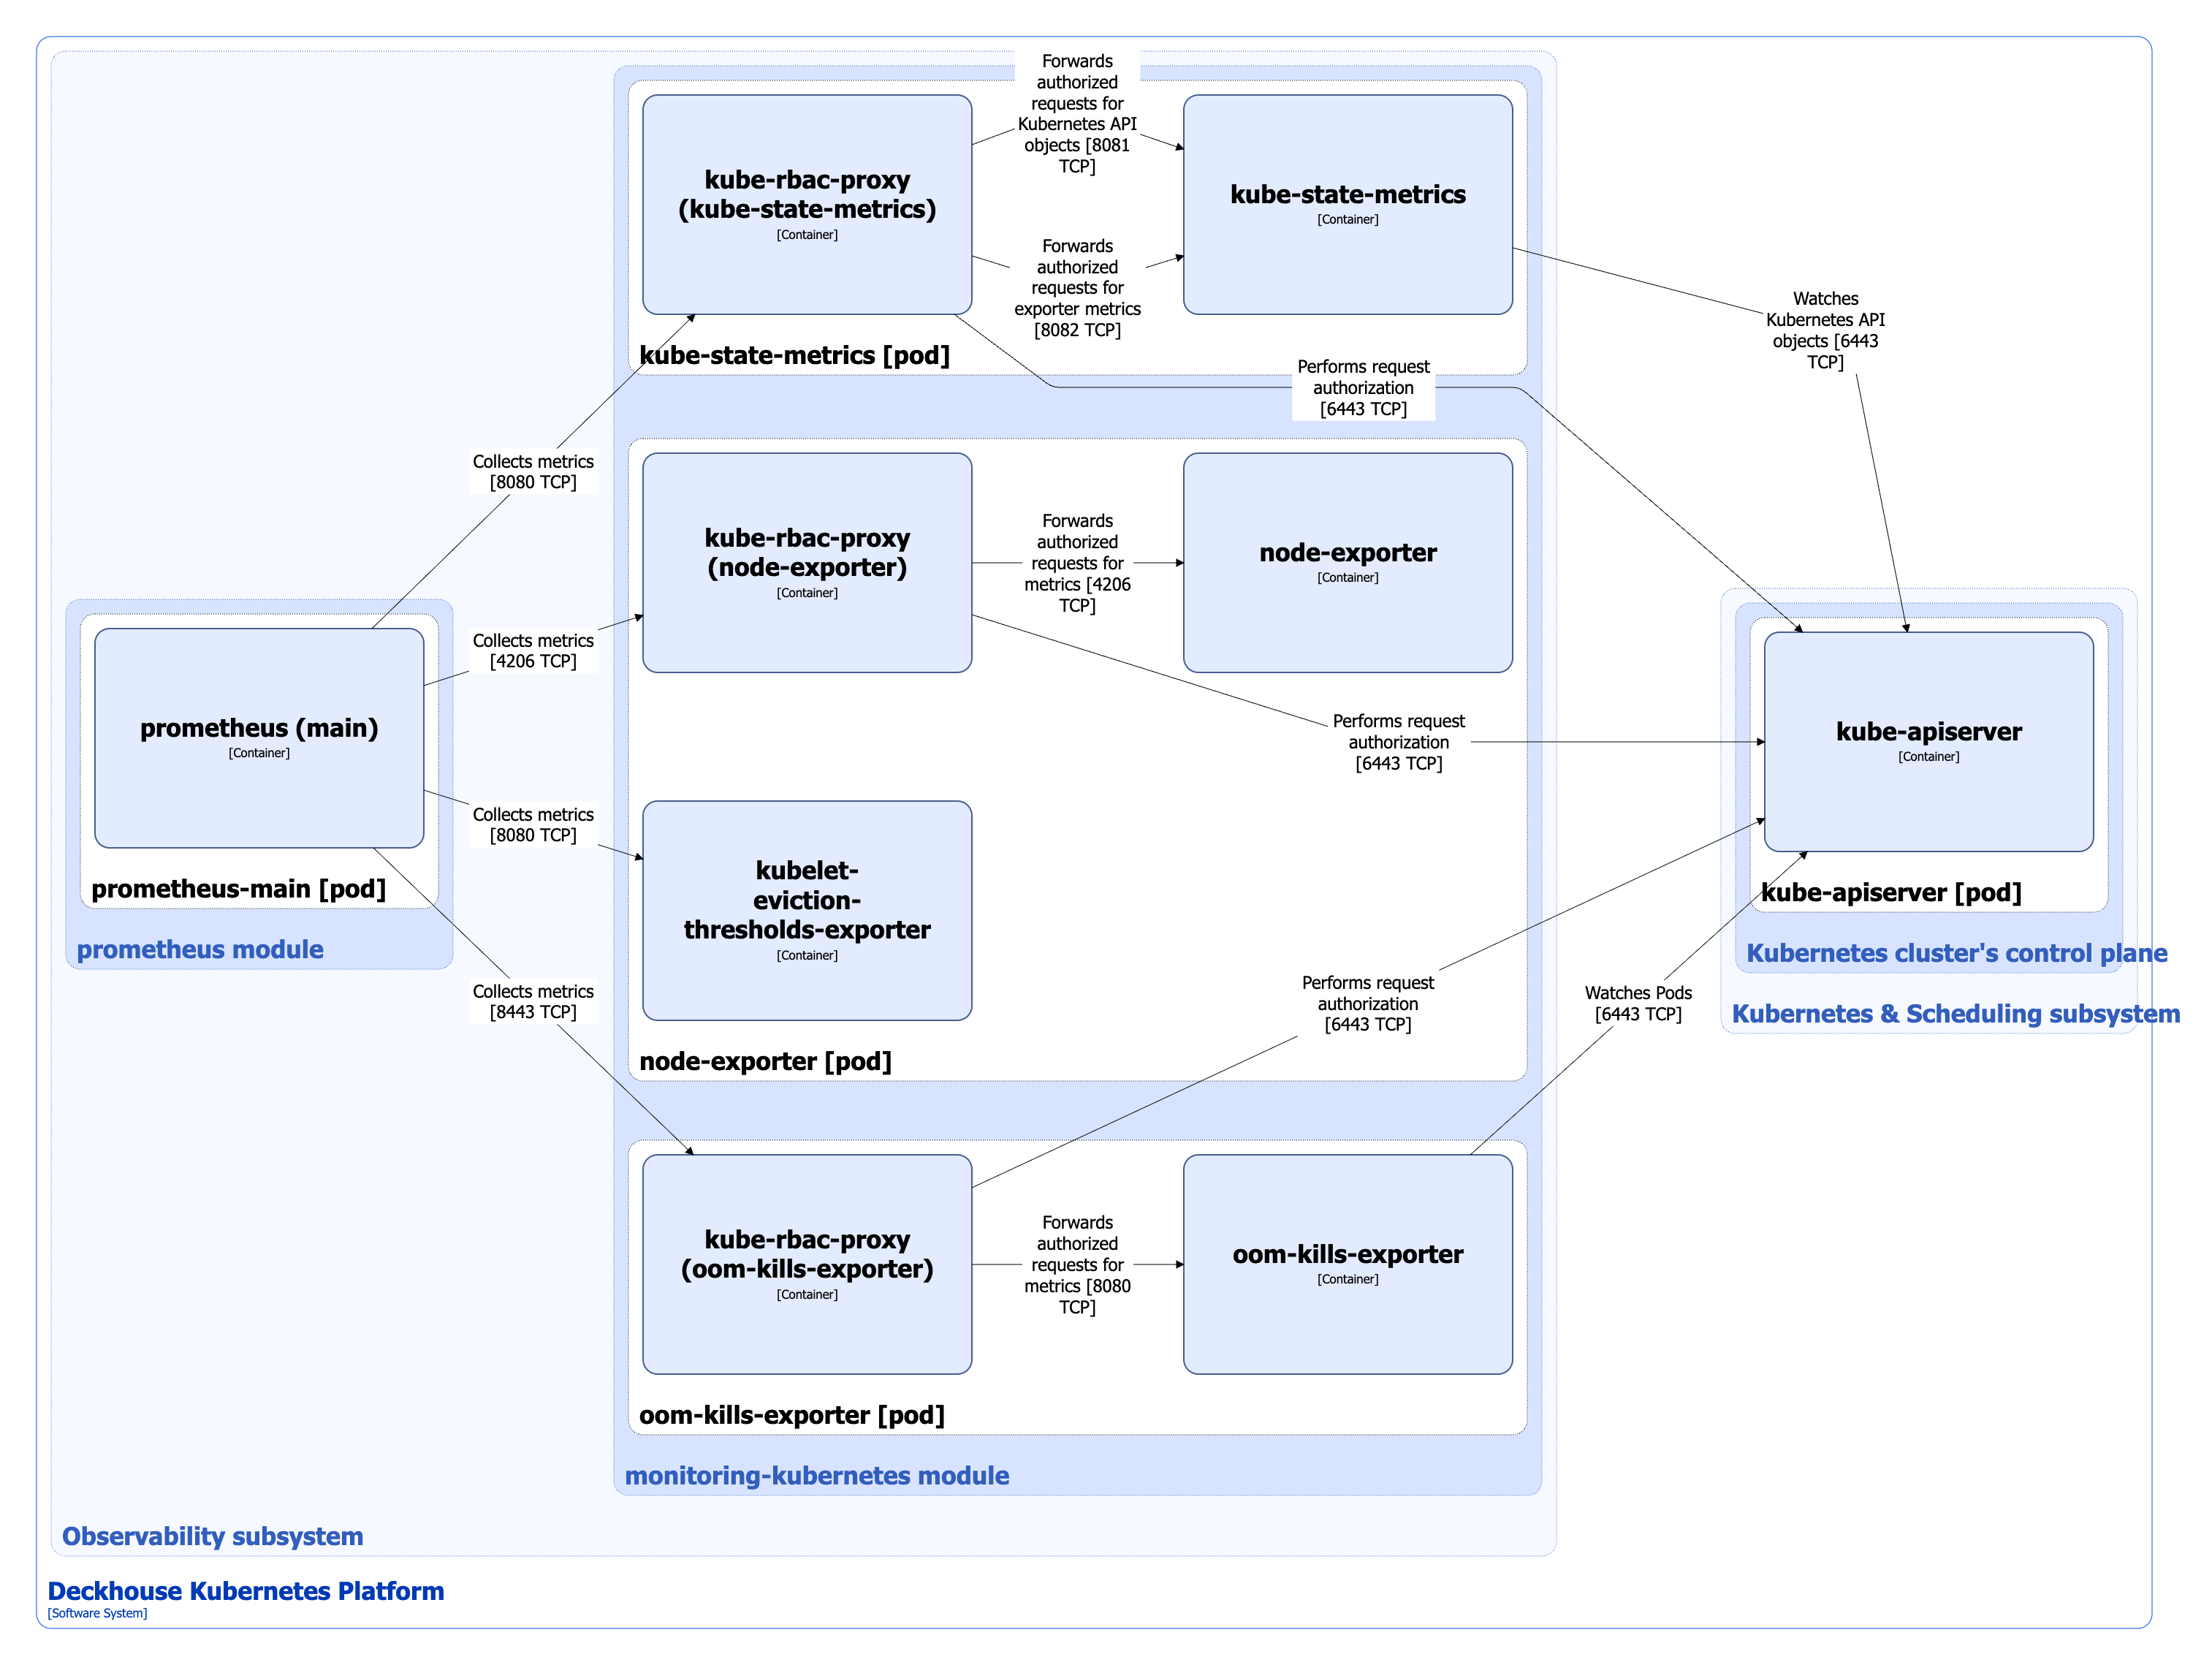
The following simplifications are made in the diagram:
- The diagram shows containers in different pods interacting directly with each other. In reality, they communicate via the corresponding Kubernetes Services (internal load balancers). Service names are omitted if they are obvious from the diagram context. Otherwise, the Service name is shown above the arrow.
- Pods may run multiple replicas. However, each pod is shown as a single replica in the diagram.
The Level 2 C4 architecture of the monitoring-kubernetes module and its interactions with other components of Deckhouse Platform (DP) are shown in the following diagram:
Module components
The module consists of the following components:
-
Kube-state-metrics (Deployment): Prometheus exporter that collects and provides metrics about the state of objects in a Kubernetes cluster. It connects to the Kubernetes API server, analyzes the current status of resources (Pods, Services, Deployments, Nodes, and others), and generates metrics based on this.
It consists of the following containers:
- kube-state-metrics: Main container. It is an open-source project.
- kube-rbac-proxy: Sidecar container with an authorization proxy based on Kubernetes RBAC that provides secure access to the exporter metrics. It is an open-source project.
-
Node-exporter (DaemonSet): Prometheus exporter that runs on each cluster node and collects metrics from these nodes. It collects data about the operating system and hardware.
It consists of the following containers:
- node-exporter: Main container. It is an open-source project;
- kubelet-eviction-thresholds-exporter: Sidecar container that collects metrics on the availability of file descriptors, sockets, free space and inodes on each node, compares them as a percentage with Eviction thresholds, stated in the kubelet configuration file, and exports the resulting values as metrics. This exporter is developed by Flant.
- kube-rbac-proxy: Sidecar container providing authorized access to the exporter metrics (described above).
-
Oom-kills-exporter (DaemonSet): Prometheus exporter that runs on each cluster node, monitors OOM-kill (Out-Of-Memory kill) events occurring with containers running on these nodes, and exports a counter of such events as a metric. Oom-kills-exporter also watches pods to synchronize labels containing container IDs that are added to the metrics.
It consists of the following containers:
- oom-kills-exporter: Main container. This exporter is developed by Flant.
- kube-rbac-proxy: Sidecar container providing authorized access to the exporter metrics (described above).
Module interactions
The module interacts with the following components:
-
Kube-apiserver:
- Watches Kubernetes API objects;
- Authorizes requests for metrics.
The following external components interact with the module:
- Prometheus-main: Collects metrics from module exporters.