The observability module extends the functionality of the prometheus module and the Deckhouse web UI, providing additional capabilities for flexible management of metrics, dashboards, and alerts, as well as access control mechanisms for them.
Module capabilities:
- Dashboard management: Allows users to add their own dashboards in Grafana format.
- Alerting and recording rule group management: Allows creating and configuring custom alerting and recording rule groups.
- Notification configuration: Allows configuring notification channels (Telegram, Slack, email, and webhooks), notification policies, and disabling notifications when needed.
- Alert management: Provides information about active alerts and stores the history of resolved alerts.
- Standard data sources provisioning.
- Custom data sources support: The module allows you to add custom data sources in addition to the provided set of standard data sources.
For more details about the module, refer to the module documentation.
Module architecture
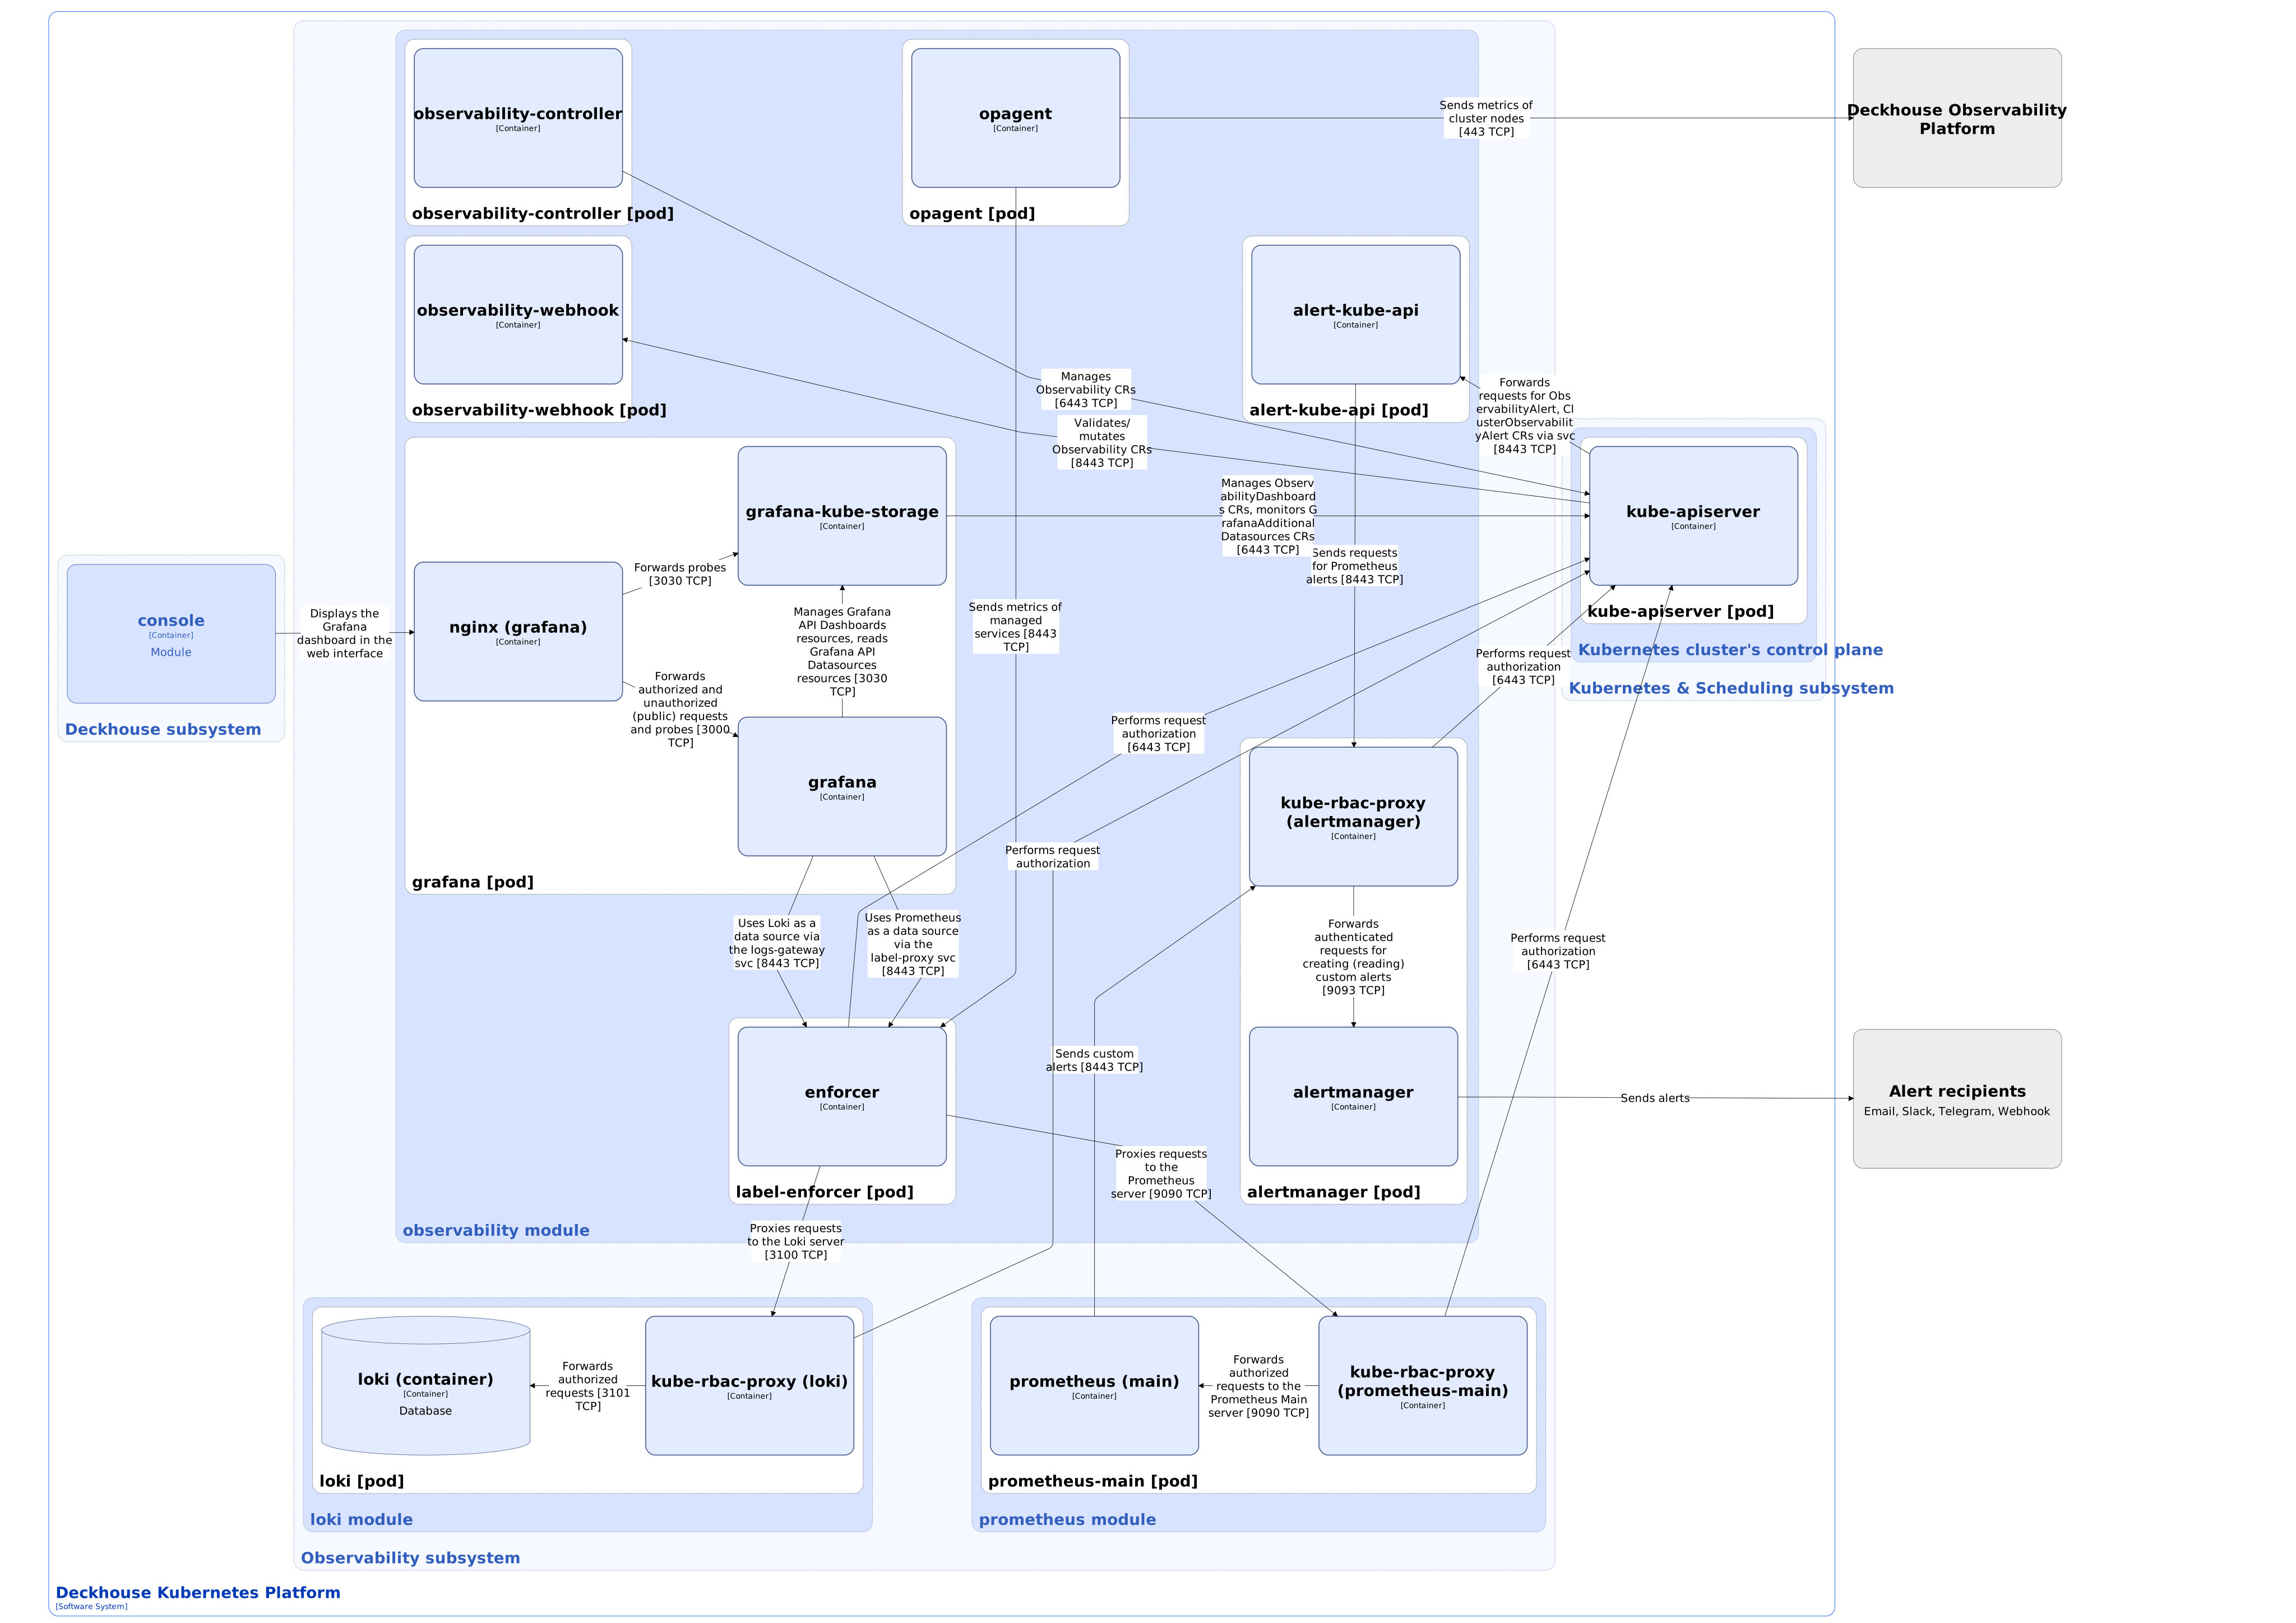
The following simplifications are made in the diagram:
- The diagram shows containers in different pods interacting directly with each other. In reality, they communicate via the corresponding Kubernetes Services (internal load balancers). Service names are omitted if they are obvious from the diagram context. Otherwise, the Service name is shown above the arrow.
- Pods may run multiple replicas. However, each pod is shown as a single replica in the diagram.
The Level 2 C4 architecture of the observability module and its interactions with other components of Deckhouse Platform (DP) are shown in the following diagram:
Module components
The module consists of the following components:
-
Observability-controller: Consists of a single observability-controller container and manages the lifecycle of most of the module’s custom resources, such as ObservabilityMetricsRulesGroup, ObservabilityNotificationChannels, ObservabilityNotificationSilence, and others. For complete list of resources managed by the module, refer to the “Custom resources” section in the module documentation.
-
Observability-webhook: Consists of a single observability-webhook container that implements a webhook server, which is used to validate and mutate Kubernetes API resources through the Validating/Mutating Admission Controllers mechanisms.
-
Alert-kube-api: Consists of a single alert-kube-api container and implements Kubernetes Extension API Server that extends Kubernetes API with ObservabilityAlert и ClusterObservabilityAlert custom resources. Alert-kube-api allows you to request alerts as custom resources using the Alertmanager component as a backend and caches them in memory for quick access.
-
Alertmanager: Receives alerts from prometheus-main component of the
prometheusmodule, processes and sends them to the end recipients. DP supports sending alerts through the following delivery channels:EmailTelegramSlackWebhook
It consists of the following containers:
-
alertmanager: Main container. A fork of the original Alertmanager made by Flant that supports multitenancy, which allows dividing alerts by system (cluster) and project ones. The delivery of alerts (policies, channels, silencers) is also multitenant, allowing individual configuration of channels and delivery policies in different projects.
-
kube-rbac-proxy: Sidecar container with an authorization proxy based on Kubernetes RBAC that provides secure access to the Alertmanager API endpoint. It is an open-source project.
-
Grafana: A component that provides a web interface for visualizing monitoring data. A fork of Grafana made by Flant is used in the module. The modified Grafana has advanced features, such as separate access to metrics and dashboards according to multitenancy. Grafana dashboards of the
observabilitymodule are integrated into the Deckhouse web UI (monitoring system management from one window).It consists of the following containers:
- grafana: Main container.
-
grafana-kube-storage: Sidecar container that implements a backend for grafana container and providing management of Dashboard resources and reading Datasource resources of the Grafana component API. These resources allow you to view and manage dashboards within namespaces (projects), as well as to connect custom data sources.
- nginx: Sidecar container that is an NGINX proxy server, which is used to publish static files. It is an open-source project.
-
Label-enforcer: A component that authorizes and proxies user requests to metrics (prometheus-main via the label-proxy service) and logs (loki via the logs-gateway service) sources, specified in the Datasource resources of grafana component API. Label-enforcer verifies RBAC access to monitoring data based on user rights, retrieves a list of available namespaces, and enriches requests with labels to filter requested data within user namespaces. For more information about metrics access control, refer to the module documentation. Label-enforcer handles both metrics read and write requests.
It consists of a single container named enforcer.
-
Opagent (DaemonSet): An agent designed to collect metrics from both the operating system and the application software installed on the servers. OpAgent is developed by Flant for the Deckhouse Observability Platform (DOP) based on Okagent (Okmeter agent), that is also a part of the Okmeter monitoring system.
In the
observabilitymodule, opAgent connects to managed services, such asmanaged-postgres,managed-memcached,managed-kafka, and others (the list of supported managed services is constantly expanding), collects metrics from them, and sends them to prometheus-main component of theprometheusmodule. If theobservability-platformmodule is enabled, opAgent collects metrics from the cluster nodes and sends them to DOP.OpAgent sends the collected data using the Prometheus Remote Write protocol:
- Metrics from managed services: To Prometheus via label-enforcer.
- Metrics from cluster nodes: To DOP.
It consists of a single container named opagent.
Module interactions
The module interacts with the following components:
-
Kube-apiserver:
- Authorizes requests for monitoring data.
- Manages module custom resources.
- Prometheus: Uses it as a data source and destination.
- Loki: Uses it as a data source.
- Alerts receivers: Sends alerts.
- DOP: Uses it as a data destination (metrics from cluster nodes).
The following external components interact with the module:
-
Kube-apiserver:
- Validates and mutates module custom resources (with validating and mutating webhooks).
- Forwards to alert-kube-api requests for ObservabilityAlert and ClusterObservabilityAlert custom resources.
- Prometheus-main: Sends alerts to alertmanager.
- Deckhouse web UI: Uses Grafana for visualizing monitoring data.