The prometheus module deploys a monitoring stack with predefined settings for Deckhouse Platform (DP) and provides the collection, storage, and processing of cluster and application metrics.
For more details about the module, refer to the module documentation section.
Module architecture
The following simplifications are made in the diagram:
- The diagram shows containers in different pods interacting directly with each other. In reality, they communicate via the corresponding Kubernetes Services (internal load balancers). Service names are omitted if they are obvious from the diagram context. Otherwise, the Service name is shown above the arrow.
- Pods may run multiple replicas. However, each pod is shown as a single replica in the diagram.
The Level 2 C4 architecture of the prometheus module and its interactions with other components of DP are shown in the following diagram:
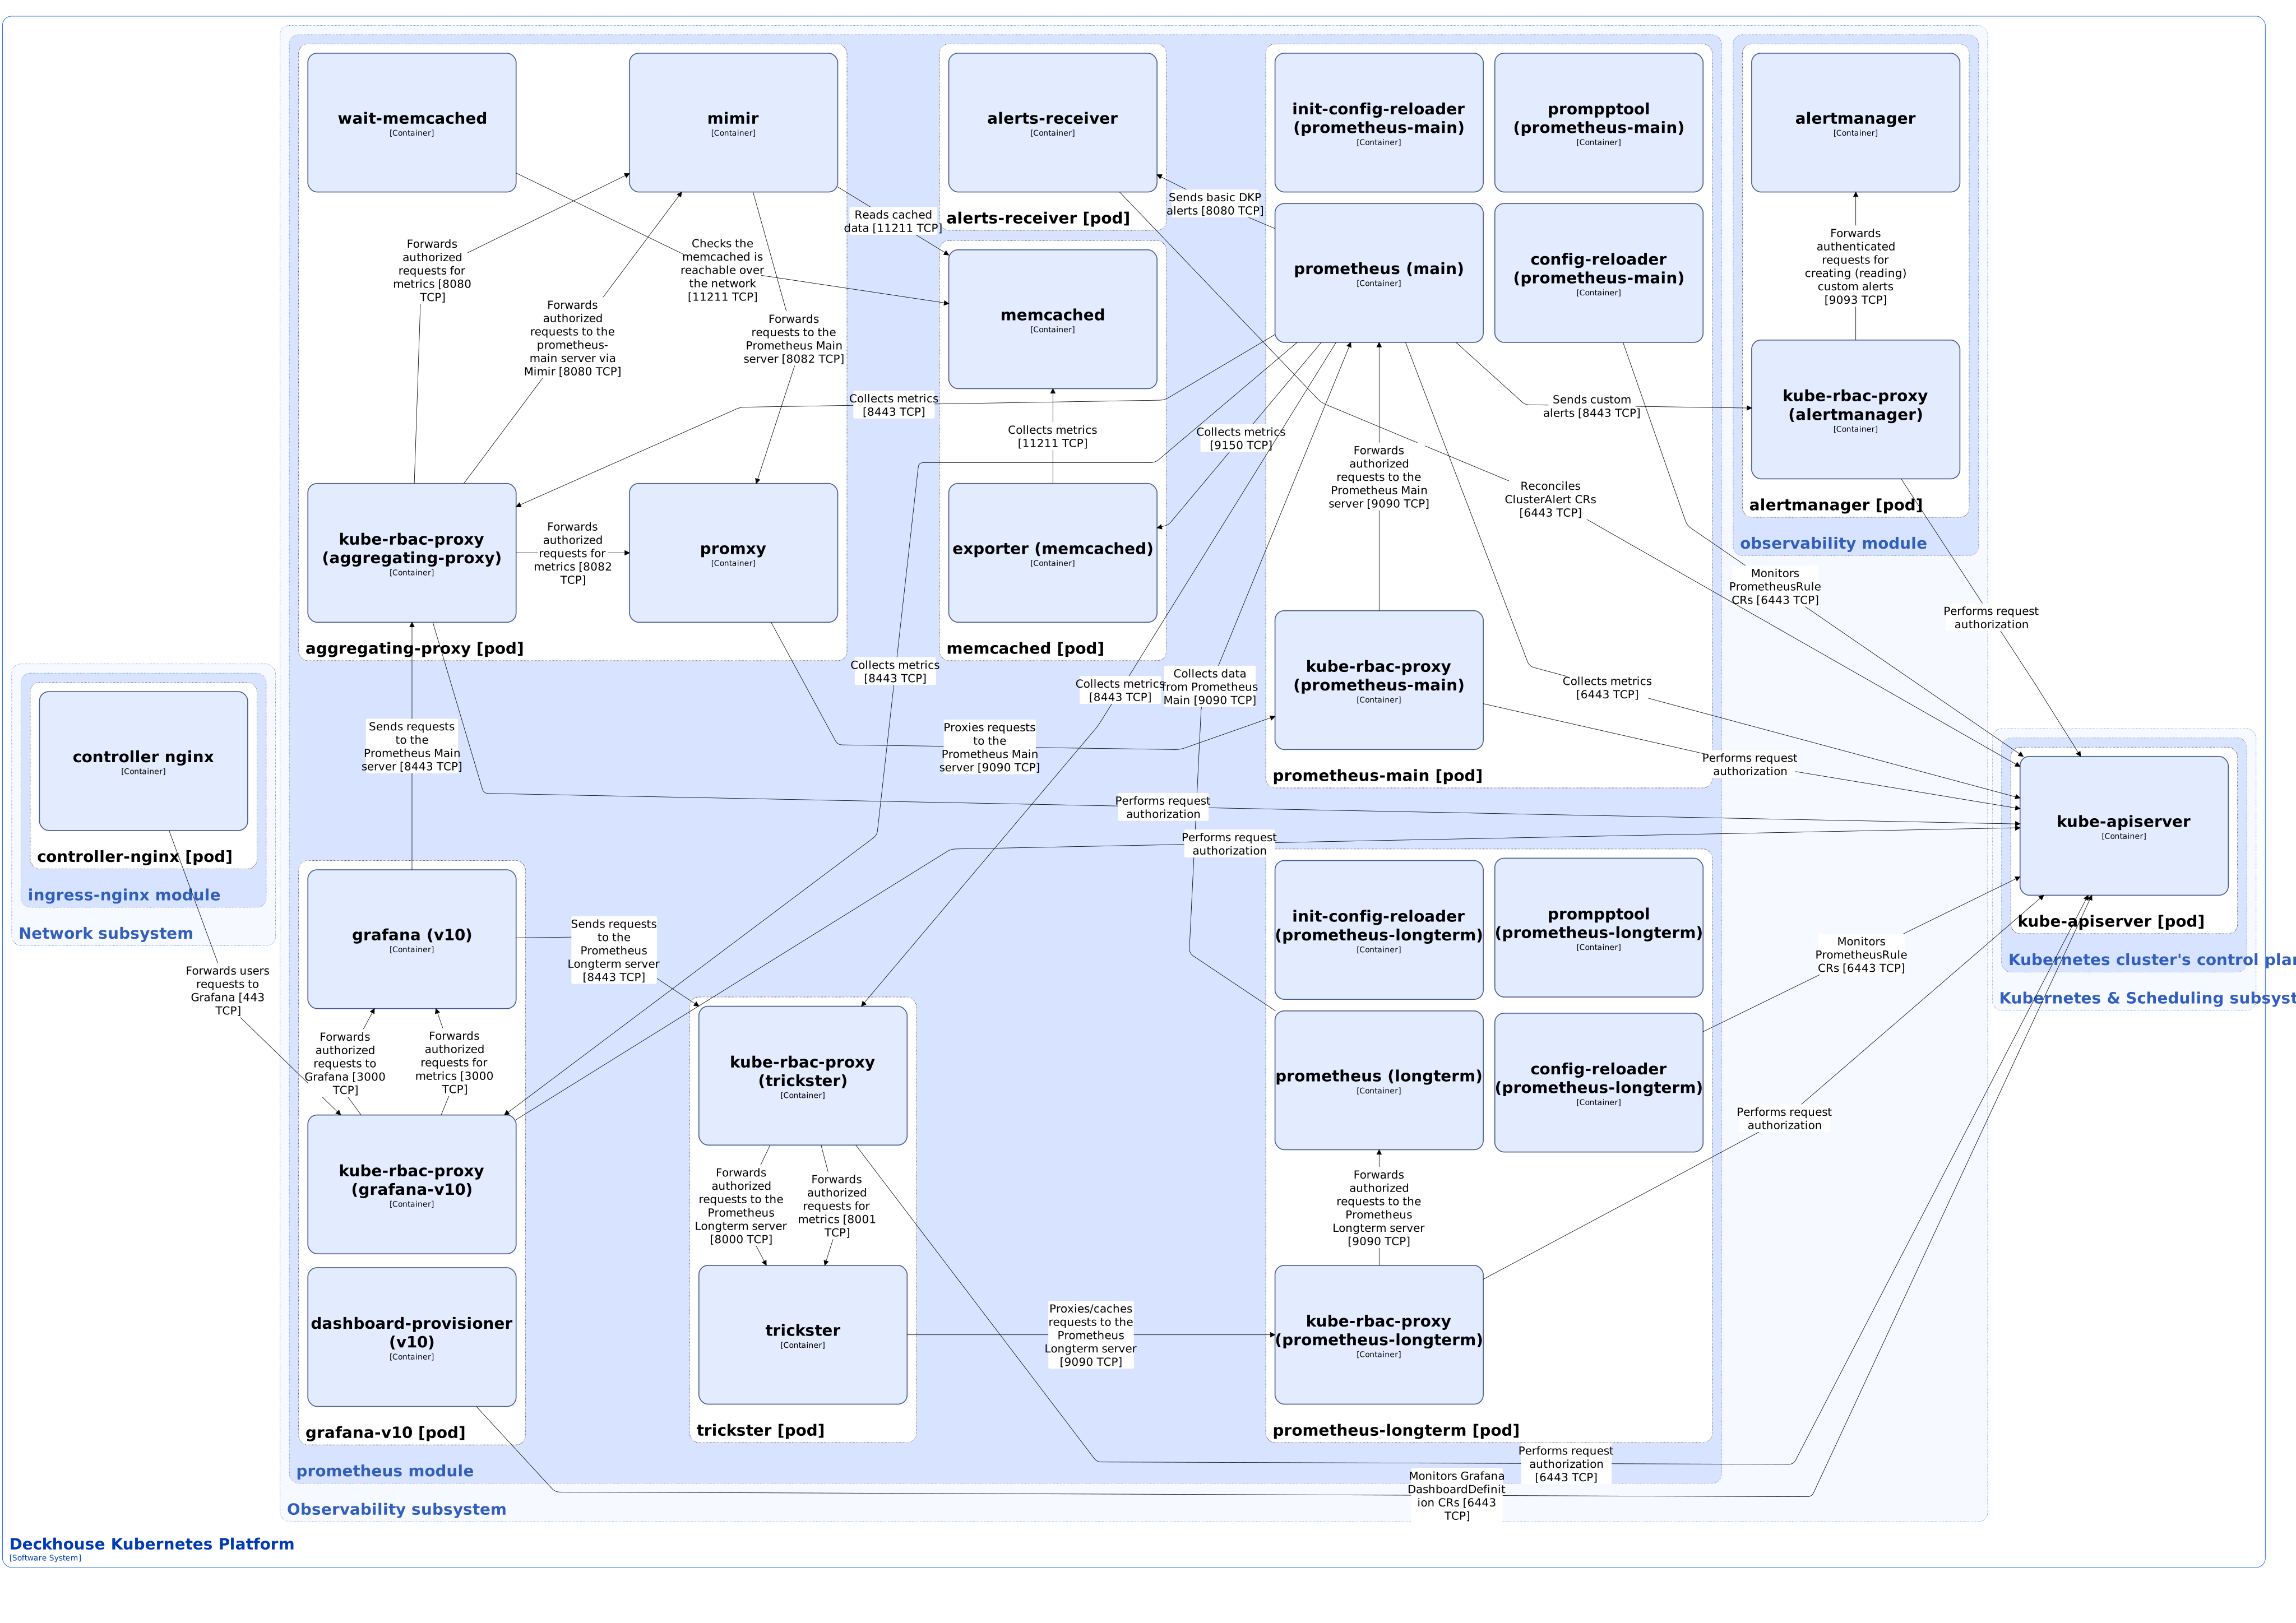
Module components
The module consists of the following components:
-
Prometheus-main (StatefulSet): Main Prometheus instance. Prometheus is a monitoring and notification system using a time series database (TSDB). It collects and analyzes application and server performance metrics in real time. Prometheus-main collects metrics from configured monitoring objects every 30 seconds. You can use the
scrapeIntervalparameter to change this value.Prometheus-main can use the original (“vanilla”) Prometheus or Deckhouse Prom++, a high-performance open-source fork of Prometheus designed to reduce memory consumption while maintaining full compatibility with the original project. The module uses Deckhouse Prom++ by default. It is possible to switch from Deckhouse Prom++ to the original Prometheus. In this case, migration of write-ahead log (WAL) data will be required, since Deckhouse Prom++ uses its own WAL log format. Migration is performed automatically using the prompptool init container.
Prometheus-main is the main data source. It collects metrics, processes configured rules, and sends alerts according to set configuration. The Prometheus Operator creates the Prometheus instance and its configuration based on following custom resources:
- Prometheus: Describes a Prometheus installation (cluster).
- ServiceMonitor: Defines metrics collection settings from a set of services.
- PrometheusRule: Contains a set of Prometheus rules.
Prometheus Operator watches Prometheus resources and, for each one, generates:
- StatefulSet with Prometheus itself.
- Secret containing
prometheus.yaml(the main configuration file) andconfigmaps.json(the configuration file for the config-reloader container, described below). Theprometheus-mainSecret is mounted in prometheus-main Pod and is used by the config-reloader container.
Prometheus Operator also watches ServiceMonitor and PrometheusRule resources and, based on them, updates the configuration (
prometheus.yamlandconfigmaps.json) in the described above Secret.For more details about the working of Prometheus Operator, refer to the
operator-prometheusmodule documentation section.For more details about the prometheus-main operation, refer to the section describing the architecture of the monitoring in DP.
Prometheus-main consists of the following containers:
- init-config-reloader: Init container that performs a single run of config-reloader to load the Prometheus configuration.
- prompptool: Init container that performs automatic WAL data migration in case of switching from Deckhouse Prom++ to the original Prometheus and vice versa.
- config-reloader: Sidecar container that monitors changes in the
prometheus.yamlconfiguration file and, if needed, triggers a Prometheus configuration reload (via a special HTTP request to the/-/reloadendpoint). Config-reloader is a utility from the Prometheus Operator open-source project. - prometheus: Main container.
- kube-rbac-proxy: Sidecar container with an authorization proxy based on Kubernetes RBAC that provides secure access to the Prometheus server. It is an open-source project.
-
Prometheus-longterm (StatefulSet): An additional Prometheus instance that scrapes the data of the primary Prometheus instance (
prometheus-main). This allows users to view and analyze historical trends over a long period of time. Prometheus-longterm receives data due to a configured federation mechanism with the primary Prometheus instance.The original Prometheus or Deckhouse Prom++ can be used in prometheus-longterm too. Prometheus-longterm has the same set of containers as in prometheus-main, as well as operation principles.
-
Grafana-v10: Optional Grafana component that provides a web interface for visualizing monitoring data. Grafana displays dashboards supplied with DP modules. Grafana could work in High Availability mode, does not store state, and is configured with custom resources. Grafana is enabled by default, but it can be disabled using the
settings.grafana.enabledparameter.Grafana-v10 will be disabled in the future DP releases. To view the monitoring dashboards, use the Deckhouse web UI.
It consists of the following containers:
- dashboard-provisioner: Sidecar container that watches GrafanaDashboardDefinition custom resources and when a new resource appears, it adds to the Grafana folder the dashboards described there.
- grafana: Main container. It is an open-source project.
- kube-rbac-proxy: Sidecar container providing authorized access to the Grafana server and its metrics (described above).
-
Aggregating-proxy: Component that performs metrics caching, data collection from several Prometheus instances (if they are in High Availability mode), data deduplication, and query calculation.
It consists of the following containers:
- wait-memcached: Init container that waits the memcached component to be available over the network. Aggregating-proxy uses memcached to cache metrics in RAM.
- mimir: Sidecar container that works with the memcached component to optimize queries and cache data. If there is no data in the cache, mimir forwards the request to the prometheus-main component via promxy, that is another sidecar container. It is an open-source project.
- promxy: Sidecar container that proxies requests to the prometheus-main component and provides a single endpoint to access data of multiple Prometheus instances. It is an open-source project.
- kube-rbac-proxy: Sidecar container providing authorized access to the mimir containers (queries to the Prometheus server and container metrics) and promxy (queries to container metrics). It’s described above in detail.
-
Memcached (StatefulSet): Component used by aggregating-proxy for caching Prometheus metrics. Memcached is a software that implements a service for caching data in RAM to speed up Prometheus metrics query execution.
It consists of the following containers:
- memcached: Main container. It is an open-source project.
- exporter: Sidecar container that exports memcached container metrics. Exporter collects memcached container metrics via a network connection, as well as from the memcached process’s PID file. It is an open-source project.
-
Trickster: Caching proxy server that reduces the load on Prometheus. It is used for caching and proxying prometheus-longterm requests. In the future DP releases, it’s expected to become deprecated and will no longer be supported.
It consists of the following containers:
- trickster: Main container. It is an open-source project.
- kube-rbac-proxy: Sidecar container providing authorized access to the proxy server and its metrics (described above).
In the future DP releases, alerts-receiver will be removed from the
prometheusmodule. The Alertmanager component of theobservabilitymodule will be used to receive all alerts. -
Alerts-receiver: A server compatible with Alertmanager API. Alerts-receiver receives basic alerts from prometheus-main, creates the ClusterAlert custom resources based on them, updates their statuses and deletes them if the alert is no longer active. The ClusterAlert custom resources are used to inform DP users on active alerts and are displayed in the Deckhouse web UI. Alerts-receiver is developed by Flant. It consists of one container.
Module interactions
The module interacts with the following components:
-
Kube-apiserver:
- Watches the PrometheusRule and GrafanaDashboardDefinition custom resources.
- Manages the ClusterAlert custom resources.
- Authorizes requests for metrics of module components.
-
Alertmanager: Sends custom alerts.
The Prometheus instance, which is part of the module, collects metrics from all DP components:
- Components of modules
- Components of cluster control plane
- Exporters that collect metrics of cluster hardware resources utilization
- Exporters that collect Kubernetes resources metrics
- User applications (additional configuration is required)
To prevent complicating the diagram with a large number of relations, Prometheus interactions related to the collection of metrics from DP components are omitted.
The following external components interact with the module:
- Ingress-controller (shown on the diagram as “controller nginx”): Forwards users requests to Grafana.
Fault tolerance and High Availability (HA) monitoring mode
The prometheus module provides built-in fault tolerance for all its key components. All monitoring services (Prometheus servers, storage systems, proxies, and other important components) are deployed in multiple copies by default. This ensures that in the event of a failure of a separate instance, the service will continue to work without loss of data and availability.
Prometheus, the main component of metric collection, runs in at least two copies (if there are enough nodes in the cluster). All Prometheus instances use the same configuration and receive the same data. To ensure seamless operation in case of failure of one of the copies, a special component, the aggregating-proxy, is used to access Prometheus. It allows you to combine metrics from several Prometheus instances and always return the most complete and up-to-date data, even if one of the copies is temporarily unavailable.